[Preprint]. 2023 Jun 14:2023.06.14.544959.
doi: 10.1101/2023.06.14.544959.

Comparison of genomic diversity between single and pooled Staphylococcus aureus colonies isolated from human colonisation cultures

Affiliations

Comparison of genomic diversity between single and pooled Staphylococcus aureus colonies isolated from human colonisation cultures

Vishnu Raghuram et al. bioRxiv. .

Update in

Abstract

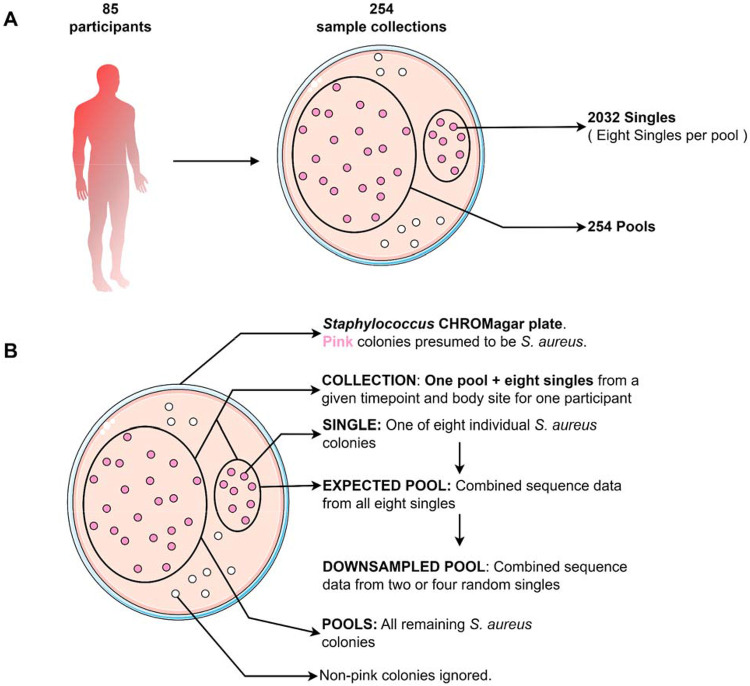
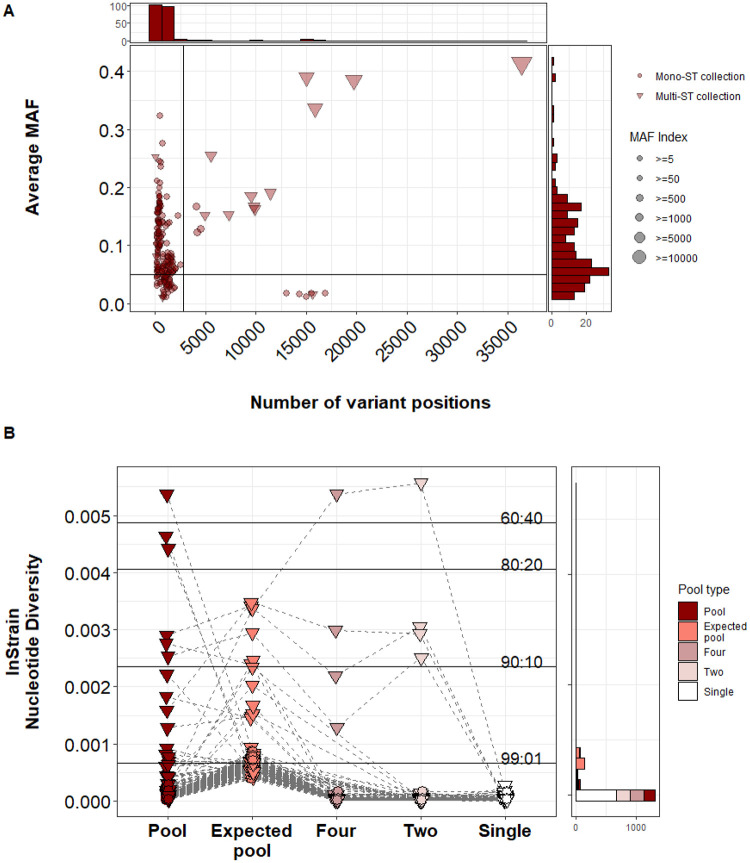
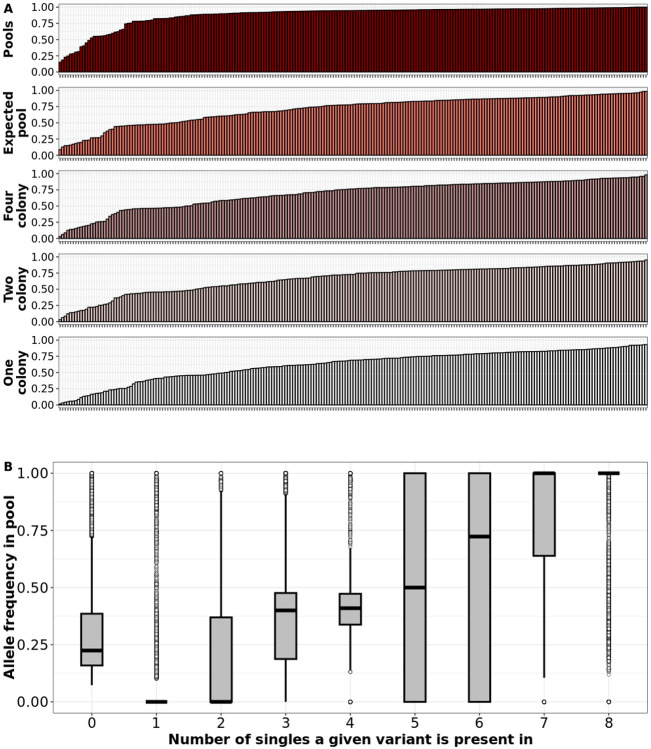
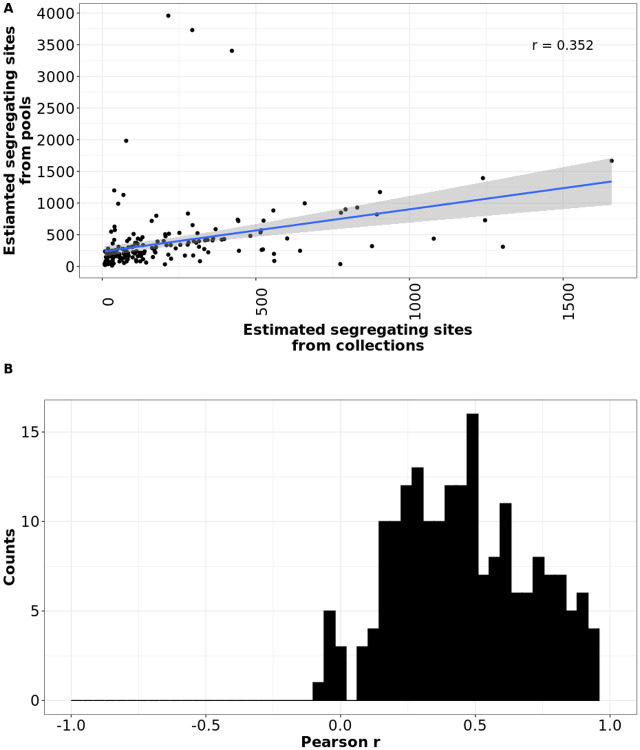
The most common approach to sampling the bacterial populations within an infected or colonised host is to sequence genomes from a single colony obtained from a culture plate. However, it is recognized that this method does not capture the genetic diversity in the population. An alternative is to sequence a mixture containing multiple colonies ("pool-seq"), but this has the disadvantage that it is a non-homogeneous sample, making it difficult to perform specific experiments. We compared differences in measures of genetic diversity between eight single-colony isolates (singles) and pool-seq on a set of 2286 S. aureus culture samples. The samples were obtained by swabbing three body sites on 85 human participants quarterly for a year, who initially presented with a methicillin-resistant S. aureus skin and soft-tissue infection (SSTI). We compared parameters such as sequence quality, contamination, allele frequency, nucleotide diversity and pangenome diversity in each pool to the corresponding singles. Comparing singles from the same culture plate, we found that 18% of sample collections contained mixtures of multiple Multilocus sequence types (MLSTs or STs). We showed that pool-seq data alone could predict the presence of multi-ST populations with 95% accuracy. We also showed that pool-seq could be used to estimate the number of polymorphic sites in the population. Additionally, we found that the pool may contain clinically relevant genes such as antimicrobial resistance markers that may be missed when only examining singles. These results highlight the potential advantage of analysing genome sequences of total populations obtained from clinical cultures rather than single colonies.

Keywords: Staphylococcus aureus; adaptation; asymptomatic carriage; genetic diversity; whole genome sequencing.


Conflict of interest statement

Conflict of interest statement The authors declare no conflict of interest.

Figures

Fig 1:
Fig 1:. Schematic representation of colony collection strategy, names, and descriptions of isolate groups analysed in this study.
(A): Diagram depicting the number of samples in this study. From 85 study participants, we collected a total of 254 culture samples. For each collection, we obtained 8 single colonies, and pooled the remaining colonies on the plate. (B): Diagram describing the terminology for specific isolate groups used in this study.
Fig 2:
Fig 2:. Pairwise SNP distance between and within collections.
(A) Boxplots showing per-collection SNP distance distributions. For each collection shown in the y-axis, the x-axis shows the corresponding distribution of core genome SNP distances in log scale. Black vertical lines show the median SNP distances and boxes show the interquartile range. Whiskers represent values up to 1.5 times the first or third quartile. Black dots represent outliers beyond the whiskers range. (B) Barplot showing number of genomes per ST. Multilocus Sequence Typing was performed by the software tool mlst (see methods). x-axis shows the number of isolates assigned to the corresponding ST shown in the y-axis. (C) Bar plot showing number of STs detected per participant. Multilocus Sequence Typing was performed for all eight singles from a participant and the number of unique STs detected per participant was plotted. (D) Maximum likelihood phylogeny representing at least one isolate from all collections. All non-identical genomes from each collection were aligned by snippy and a core genome phylogeny was constructed using fasttree (see Methods). Tree tips are coloured by ST, only top 10 most frequent STs are shown, and remaining are grouped into “Other”.
Fig 3:
Fig 3:. Assembly quality can be used to assess population heterogeneity.
(A) There was no significant difference in the assembly coverage between pools and singles. Violin plot showing distribution of assembly coverage between pools and singles. Assembly coverage for each pool and single was calculated by Bactopia against an auto-chosen reference (see methods). Circles indicate mono-ST collections and triangles indicate multi-ST collections. (B) Pool assemblies were more likely to have a higher number of contigs than single assemblies. Violin plot showing distribution of number of assembly contigs in pools and singles. Pooled samples were processed identically to singles with Bactopia using SPAdes. Circles indicate mono-ST collections and triangles indicate multi-ST collections. (C) Pooled samples have varying sources of contamination while singles are pure. CheckM contamination and heterogeneity scores showed that all single colonies have no contamination while 6% of pools are contaminated by phylogenetically distant sources and 3% of pools are contaminated by phylogenetically similar sources. The blue line marks a heterogeneity score of 50 below which the source of contamination is considered phylogenetically distant and vice versa. Circles indicate mono-ST collections and triangles indicate multi-ST collections.
Fig 4:
Fig 4:
(A) The MAF index could be used to assess multi-ST pools. Dot plot depicting the number of variant positions and the average MAF for mono-ST (circles) and multi-ST (triangle) pools. The x-axis indicates the number of variant positions compared to a reference. The y-axis indicates the average minor allele frequency (MAF). The average MAF was calculated by summing the MAFs of all intermediate alleles and dividing by the total number of variant positions. Red dots correspond to mono-ST pools and triangles correspond to multi-st pools. The black horizontal line indicates an average MAF of 0.1. The black vertical line indicates 0.1% of the S. aureus genome (2800 sites). The frequency of the dots at their corresponding x and y positions are indicated by the histogram above the x- and to the right of the y-axis. (B) Average nucleotide diversity suggested most pools comprise single strains. 94% of pools had nucleotide diversity less than a theoretical 99:1 mixture of two strains. LEFT: Dots and colours indicate average nucleotide diversity value for each pool, expected pool (reads from eight singles combined in equal proportions), downsampled pools (i.e., reads from four and two random singles combined in equal proportions) and all 2032 singles. Grey dashed lines connect corresponding samples. Black solid horizontal lines indicate the average nucleotide diversity value for in-silico mixtures of two S. aureus genomes 30,000 SNPs apart. The ratio of each mixture is indicated over each solid black line. The frequency of the dots at their corresponding x positions are indicated by the histogram to the right.
Fig 5:
Fig 5:
(A) Pools captured more variants than eight single colonies combined. Each bar indicates a collection, and the height of the bar indicates the fraction of variants found in the corresponding sample group (Pools, expected pools, four colony pools, two colony pools, single colony) to the total number of variants found in all samples in the collection (Pool plus all eight singles). For example, a bar with height 0.25 in the fifth row (One colony) shows that if one random single colony was examined from the specific collection corresponding to the bar, we would find 50% of the total number of variants found in the collection (Pool plus all eight singles). Bars for each sample group are ordered by lowest to highest. A value of one indicates 100% of the variants found in both the pools and all eight singles combined are represented in the sample group. (B) Allele frequencies in the pool were proportional to the number of singles the variant was detected in. Boxplots showing allele frequencies of variants detected in zero singles up to eight singles. Allele frequency of each variant found in the pool increased as the variant was found in more colonies in the corresponding singles. Boxes show the interquartile range and whiskers represent values up to 1.5 times the first or third quartile. White dots represent outliers beyond the whiskers range. Black horizontal line in each boxplot indicates the mean.
Fig 6:
Fig 6:. Allelic variation in pools and singles from the same sample were positively correlated
(A) The number of segregating sites in the true pools were proportional to the number of segregating sites in the expected pool. For mono-ST collections (collections where all eight singles, the pool and the auto-chosen reference were called the same ST), the number of sites with allelic variation was comparable between the true pools (y-axis) and the expected pool (x-axis) (eight singles combined). If the same site was fixed in all eight singles and in the pool, it was not included. Blue regression line depicts a linear relationship with a Pearson’s r of 0.352. (B) AFs of variants in the expected pool did not reliably predict the AFs of the same variants in the true pool. Frequency distribution plot showing Pearson’s r for all 198 mono-ST collections. x-axis depicts Pearson’s r and y-axis depicts number of collections.
Fig 7:
Fig 7:. A median of one additional AMR class can be observed in the pools compared to singles.
Ridgeline plot showing number of AMR gene classes detected in pools, the pangenome of expected and downsampled pools (pangenome of eight, four and two singles combined), and a random single colony. The x-axis shows the number of AMR classes detected in the sample by AMRFinder and the y-axis shows the corresponding sample. Black vertical line shows the median number of AMR classes detected for each sample group. White circles under each ridgeline represent individual collections and the number of AMR classes detected.
Fig 8:
Fig 8:. Diminishing returns in the number of new variants or new AMR genes observed with the addition of more sequencing runs.
Dot plot depicting the number of new variants (A) or new AMR genes (B) observed for additional sequencing runs. Red dots depict the first sequencing run being the pool, and the additional runs being single colonies (1 = Pool, 2 = Pool + one single, 3 = Pool + two singles…). White dots depict only singles (1 = one single, 2 = two singles, …)

References

    1. Giulieri SG, Guérillot R, Duchene S, Hachani A, Daniel D, Seemann T, et al. Niche-specific genome degradation and convergent evolution shaping Staphylococcus aureus adaptation during severe infections. Kana BD, Van Tyne D, Zheng M, editors. eLife. 2022. Jun 14;11:e77195. - PMC - PubMed
    1. Talbot BM, Jacko NF, Petit RA III, Pegues DA, Shumaker MJ, Read TD, et al. Unsuspected Clonal Spread of Methicillin-Resistant Staphylococcus aureus Causing Bloodstream Infections in Hospitalized Adults Detected Using Whole Genome Sequencing. Clin Infect Dis. 2022. Dec 15;75(12):2104–12. - PMC - PubMed
    1. Armstrong GL, MacCannell DR, Taylor J, Carleton HA, Neuhaus EB, Bradbury RS, et al. Pathogen Genomics in Public Health. N Engl J Med. 2019. Dec 26;381(26):2569–80. - PMC - PubMed
    1. Chaguza C, Senghore M, Bojang E, Gladstone RA, Lo SW, Tientcheu PE, et al. Within-host microevolution of Streptococcus pneumoniae is rapid and adaptive during natural colonisation. Nat Commun. 2020. Jul 10;11:3442. - PMC - PubMed
    1. Golubchik T, Batty EM, Miller RR, Farr H, Young BC, Larner-Svensson H, et al. Within-Host Evolution of Staphylococcus aureus during Asymptomatic Carriage. PLOS ONE. 2013. May 1;8(5):e61319. - PMC - PubMed

Publication types