[Preprint]. 2023 Jun 14:2023.06.14.544429.
doi: 10.1101/2023.06.14.544429.

Fusion crystallization reveals the behavior of both the 1TEL crystallization chaperone and the TNK1 UBA domain

Affiliations

Fusion crystallization reveals the behavior of both the 1TEL crystallization chaperone and the TNK1 UBA domain

Supeshala Nawarathnage et al. bioRxiv. .

Update in

Abstract

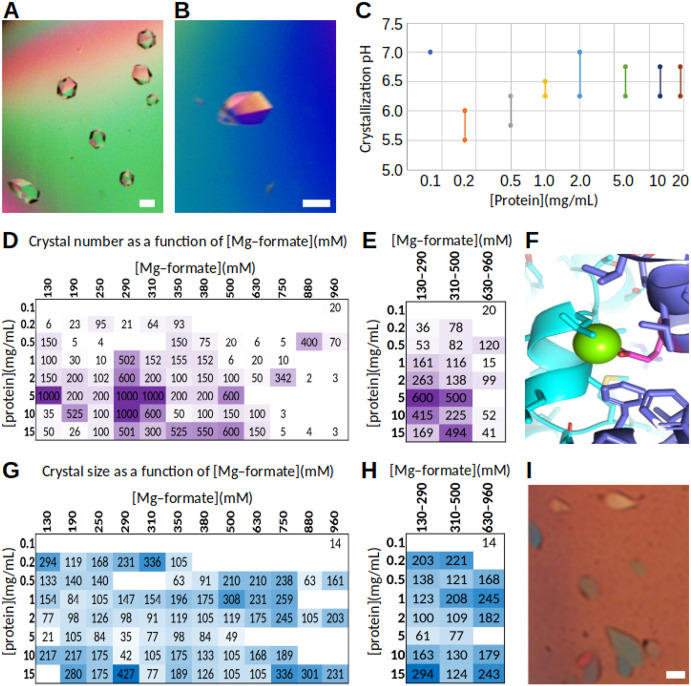
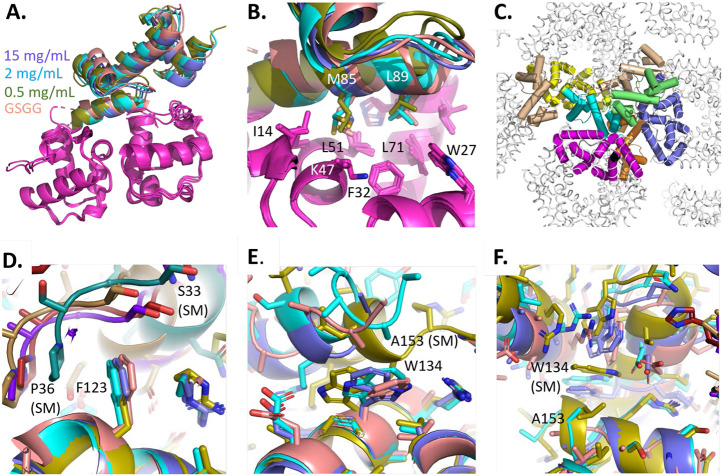
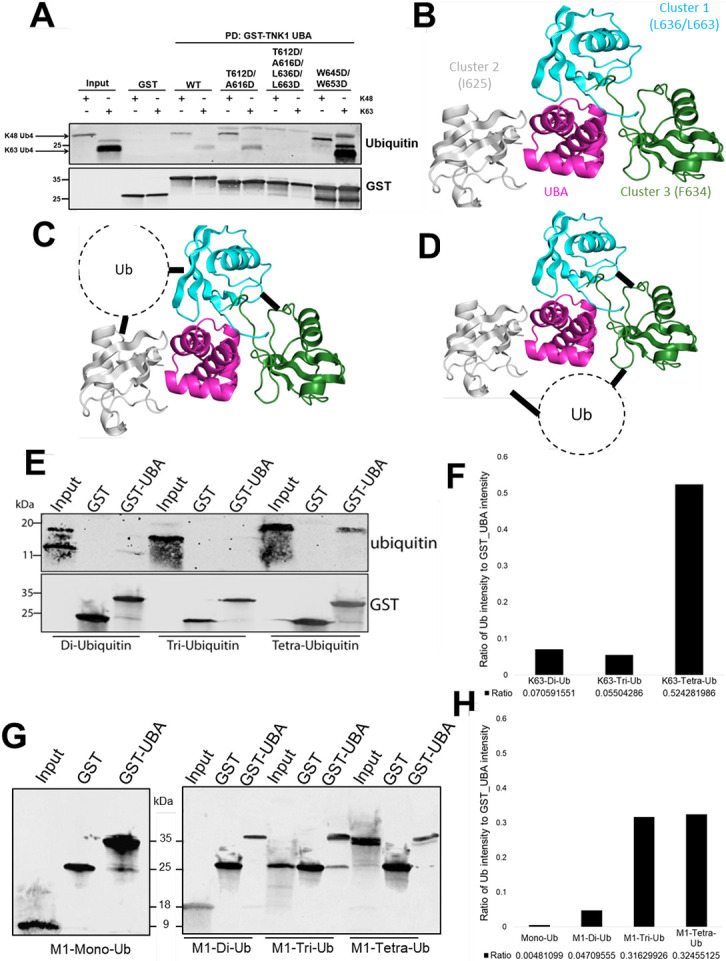
Human thirty-eight-negative kinase-1 (TNK1) is implicated in cancer progression. The TNK1-UBA domain binds polyubiquitin and plays a regulatory role in TNK1 activity and stability. Sequence analysis suggests an unusual architecture for the TNK1 UBA domain, but an experimentally-validated molecular structure is undetermined. To gain insight into TNK1 regulation, we fused the UBA domain to the 1TEL crystallization chaperone and obtained crystals diffracting as far as 1.53 Å. A 1TEL search model enabled solution of the X-ray phases. GG and GSGG linkers allowed the UBA to reproducibly find a productive binding mode against its host 1TEL polymer and to crystallize at protein concentrations as low as 0.1 mg/mL. Our studies support a mechanism of TELSAM fusion crystallization and show that TELSAM fusion crystals require fewer crystal contacts than traditional protein crystals. Modeling and experimental validation suggest the UBA domain may be selective for both the length and linkages of polyubiquitin chains.


Conflict of interest statement

Declaration of interests

The authors declare no competing interests.

Figures

Figure 1:
Figure 1:. Design, crystallization, and structure of 1TEL-GG-UBA.
A. Design model of 1TEL-GG-UBA. B. Representative crystals of 1TEL-GG-UBA at 15mg/mL. Scale bar is 100 μm. C. 1TEL-GG-UBA molecular replacement solution showing the backbones of the 1TEL domain (magenta), the UBA central α-helix (cyan), the eventual position of the UBA main chain (orange ribbon), and electron density corresponding to the initial molecular replacement solution (purple mesh, contoured to 3σ). D. Superposition of the homology model (yellow) onto the UBA domain (cyan) from the 1TEL-GG-UBA crystal structure. E. View of the 1TEL-GG-UBA crystal lattice parallel to the helical axis of the TELSAM polymers, colored as in A. F. View of two 1TEL-GG-UBA polymers perpendicular to their helical axes, in space filling representation and omitting the UBA domains for clarity. G. Superposition of the 1TEL-GG-UBA crystal structure (magenta and cyan) onto the design model (white), aligned through only the 1TEL domains. H-I. Two views, 180° apart, of the binding interface between the UBA domain (cyan) and the 1TEL polymer (magenta). Hydrogen bonds are shown as black lines while atoms making van der Waals contacts are shown as spheres. J. Superposition of the 1TEL domains of representative 1TEL wwPDB structures (purple, PDB IDs 8FT8, 8FT6) onto structures of 1TEL-GG-UBA (magenta and cyan). The two 1TEL domains from 1TEL-GG-UBA are shown (magenta), while only a single UBA domain is shown (cyan). Selected amino acid side chains are shown as sticks.
Figure 2:
Figure 2:. TELSAM fusion allows crystallization at low protein concentrations.
A. Representative crystals of 1TEL-GG-UBA at 2 mg/mL. Scale bar is 100 μm. B. Representative crystals of 1TEL-GG-UBA at 0.5 mg/mL. Scale bar is 100 μm. C. pH ranges at which crystals appeared for various input protein concentrations. D. Heat map of the number of protein crystals observed per well as a function of Mg-formate concentration. The number of crystals observed at different pH values have been averaged. E. As in C. but with the Mg-formate concentrations grouped into three ranges for clarity. F. Model of a magnesium ion interacting with the E112 at the hydrophobic inter-subunit interface of the TELSAM polymer. Two neighboring TELSAM monomers (cyan and purple) are shown as they would appear in a polymer. The V112E substitution is highlighted in pink while the putative magnesium ion is represented by a green sphere. G. Heat map of the maximum crystal size (μm) observed per well as a function of Mg-formate concentration. The maximum is the largest crystal observed at that Mg-formate concentration across all pH values tested. H. As in G. but with the Mg-formate concentrations grouped into three ranges for clarity. I. Representative crystals of 1TEL-GSGG-UBA. Scale bar is 100 μm.
Figure 3:
Figure 3:. 1TEL-UBA structures have nearly identical UBA binding modes against the 1TEL polymers.
A. 15 mg/mL (purple), 2 mg/mL (cyan), and 0.5 mg/mL (olive green) 1TEL-GG-UBA structures superimposed onto the 1TEL-GSGG-UBA structure (salmon), via the 1TEL domain (magenta). B. As in A. but zooming in on the UBA:1TEL interface. C. Schematic of crystal contacts between a UBA domain (cyan), six other 1TEL subunits (yellow, purple, and magenta) and three other UBA domains (wheat, orange, and green). Domains contacting the given UBA domain are shown as cylinders and colored, while other 1TEL subunits are shown as a gray ribbon. D. Crystal packing differences between the four 1TEL-UBA structures, focusing on F123. The structures are colored thus: 15 mg/mL UBA (purple), 15 mg/mL 1TEL (purple), 2 mg/mL UBA (cyan), 2 mg/mL 1TEL (blue-green), 0.5 mg/mL UBA (olive green), 0.5 mg/mL 1TEL (brown), GSGG UBA (salmon), and GSGG 1TEL (firebrick). All structures have been aligned through the UBA domain that hosts the F123 shown. This same UBA domain appears in the lower portion of panels D, E, and F (SM = symmetry mate). E. As in D. but focusing on W134. F. As in D. but focusing on the C-terminus of the UBA.
Figure 4:
Figure 4:. UBA-alone crystal structure and B-factor comparison.
A. Representative crystals of the UBA domain crystallized on its own. The scale bar is 100 μm. B. Asymmetric unit of the UBA-alone crystal structure, with two UBA chains. C. Superposition of the two chains from the UBA-alone structure (white) with the UBA domains from the four 1TEL–UBA fusion structures (15 mg/mL–purple, 2 mg/mL–cyan, and 0.5 mg/mL–olive green) and the AlphaFold2 prediction–yellow. D. B-factors of a single chain within the UBA-alone crystal lattice, range 12.7-79.7 Å2. E. B-factors of a single chain within the 2 mg/mL 1TEL-GG-UBA crystal lattice range 27.1-86.5 Å2. F. Three 1TEL-GG-UBA polymers from the 1TEL-flex-UBA 2mg/mL crystal lattice, viewed along their helical axes and colored according to the refined B-factors. The color scale is the same in panels D-F.
Figure 5:
Figure 5:. Aligned SEC runs of 1TEL-GG-UBA (green) with
A. mono-ubiquitin, B. M1-di-ubiquitin, C. M1-tri-ubiquitin and D. M1-tetra-ubiquitin with 1TEL-GG-UBA-alone (green), ubiquitin-alone (red) and combined (blue).
Figure 6:
Figure 6:. Predicted binding modes and corresponding experimental data.
A. Western blot of TNK1-UBA mutants incubated with or without K48- or K63-tetra-ubiquitin. B. Predicted ubiquitin binding sites supported by in vitro pull-down data. C-D. Schematic of potential UBA:tetra-ubiquitin complexes. E. Western blot of TNK1-UBA incubated with K63-linked-di-, tri-, or tetra-ubiquitin. F. Quantified ratios between the GST-UBA and bound K63-ubiquitin. G. As in E, but with mono- or M1 -linked-di-, tri-, or tetra-ubiquitin. H. As in in F, but with M1-linked-ubiquitins.

Similar articles

References

    1. Hoehn G.T., Stokland T. , Amin S., Ramírez M., Hawkins A.L., Griffin C.A., Small D. and Civin C.I. (1996). Tnk1: A Novel Intracellular Tyrosine Kinase Gene Isolated from Human Umbilical Cord Blood CD34+/Lin-/CD38-Stem/Progenitor Cells. Oncogene 12, 903–913. https://europepmc.org/article/med/8632913. - PubMed
    1. Gu T.L., Cherry J., Tucker M., Wu J., Reeves C. and Polakiewicz R.D.(2010). Identification of Activated Tnk1 Kinase in Hodgkin’s Lymphoma. Leukemia. Nature Publishing Group. 10.1038/leu.2009.293. - DOI - PubMed
    1. Ahmed S. and Miller W.T.(2022). The noncatalytic regions of the tyrosine kinase Tnk1 are important for activity and substrate specificity. JBC 298. 10.1016/j.jbc.2022.102664. - DOI - PMC - PubMed
    1. Henderson M.C., Gonzales I.M., Arora S., Choudhary A., Trent J.M., Von Hoff D.D., Mousses S. and Azorsa D.O. (2011). High-throughput RNAi Screening Identifies a Role for TNK1 in Growth and Survival of Pancreatic Cancer Cells Molecular cancer research 9, 724–732. 10.1158/1541-7786.MCR-10-0436. - DOI - PMC - PubMed
    1. Zhu Y.X., Tiedemann R., Shi C.X., Yin H., Schmidt J.E., Bruins L.A., Keats J.J. et al. (2011). RNAi Screen of the Druggable Genome Identifies Modulators of Proteasome Inhibitor Sensitivity in Myeloma Including CDK5. Blood 117, 3847–3857. 10.1182/blood-2010-08-304022. - DOI - PMC - PubMed

Publication types