[Preprint]. 2024 Sep 6:2023.06.12.544372.
doi: 10.1101/2023.06.12.544372.

Targeting Fibroblast-Endothelial Interactions in LAM Pathogenesis: 3D Spheroid and Spatial Transcriptomic Insights for Therapeutic Innovation

Affiliations

Targeting Fibroblast-Endothelial Interactions in LAM Pathogenesis: 3D Spheroid and Spatial Transcriptomic Insights for Therapeutic Innovation

Sinem Koc-Gunel et al. bioRxiv. .

Update in

Abstract

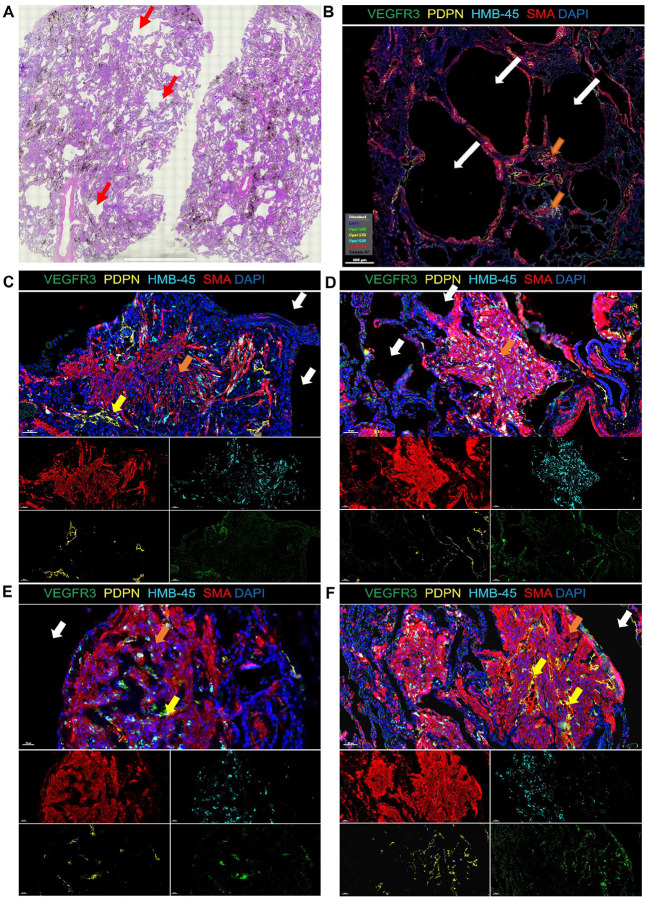
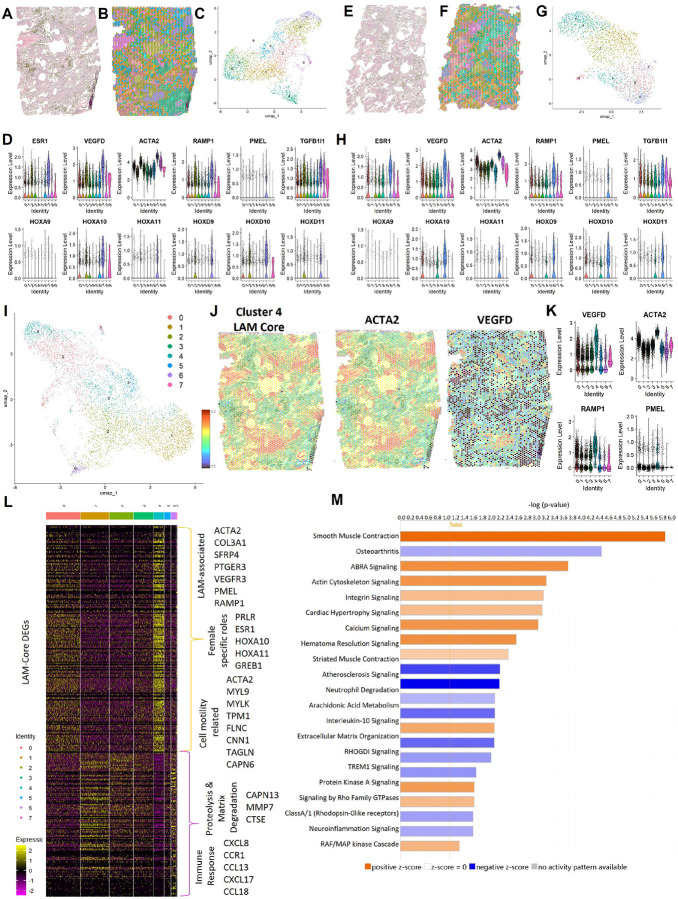
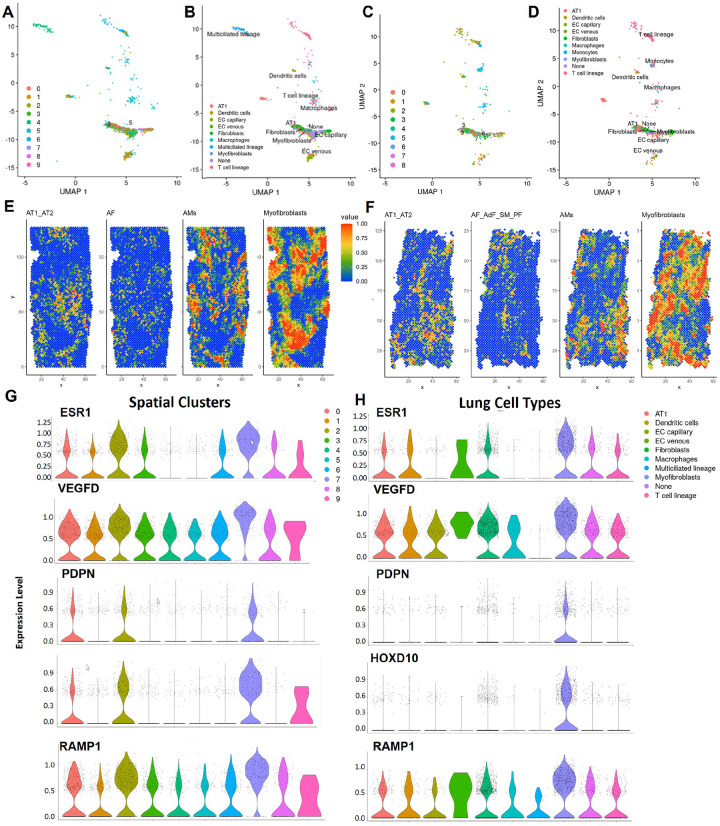
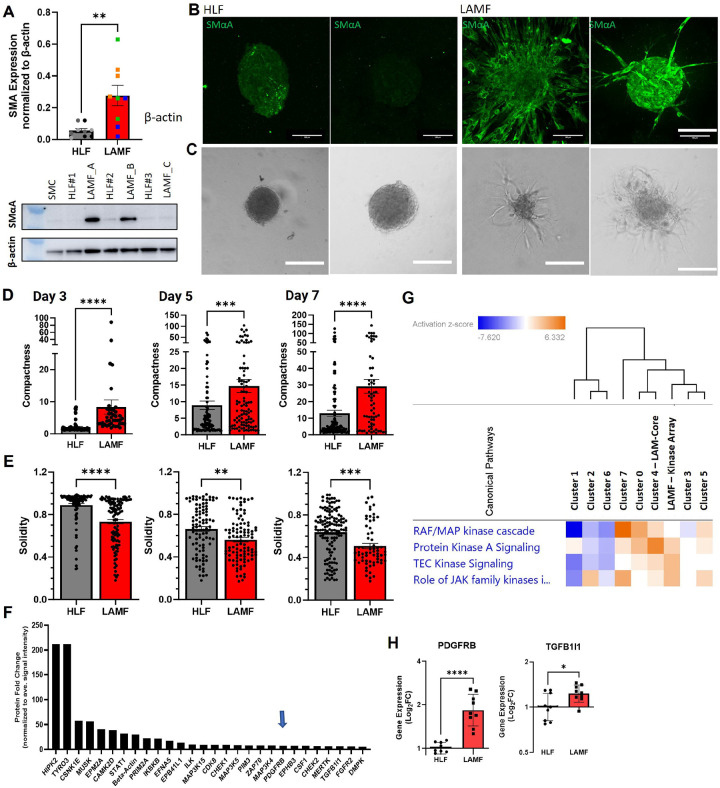
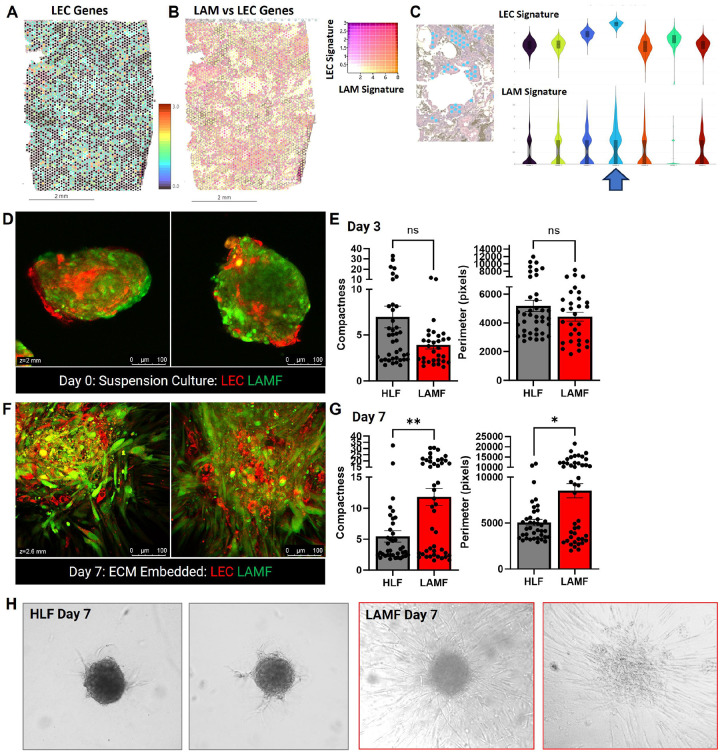
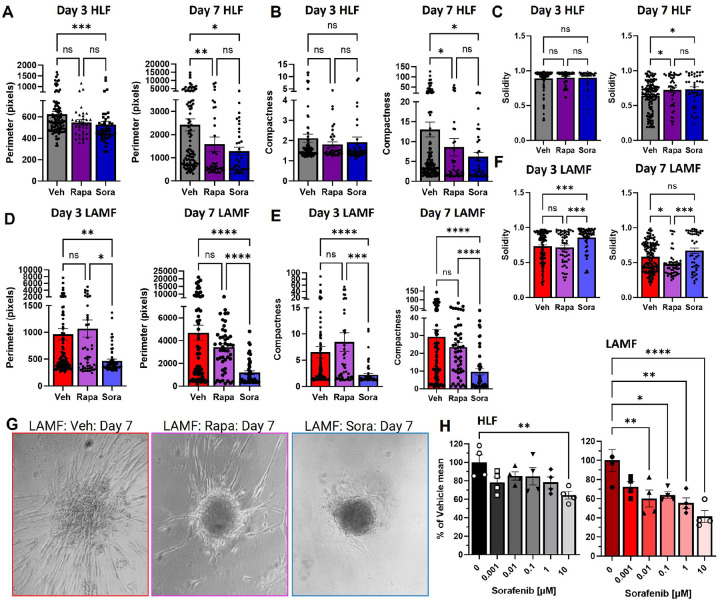
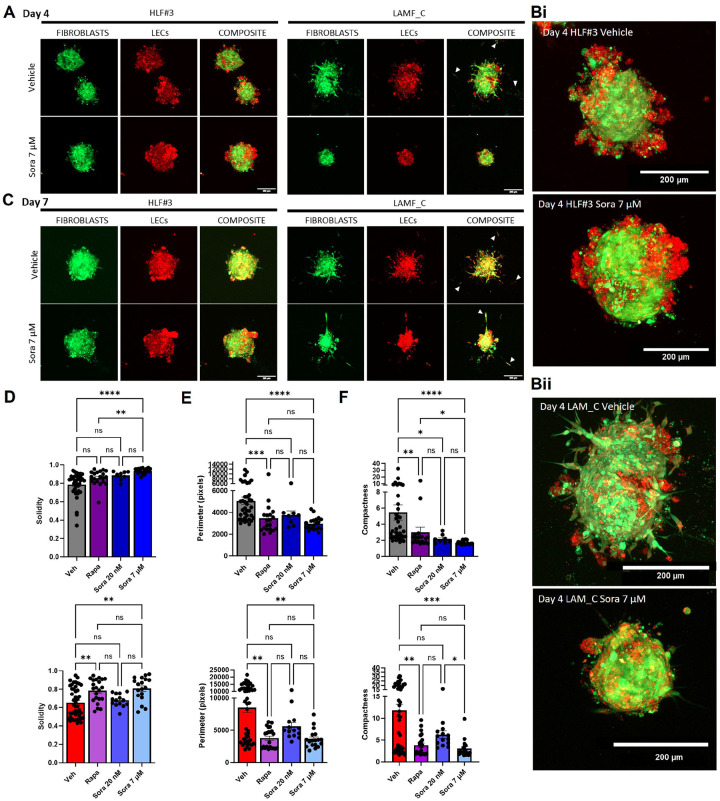
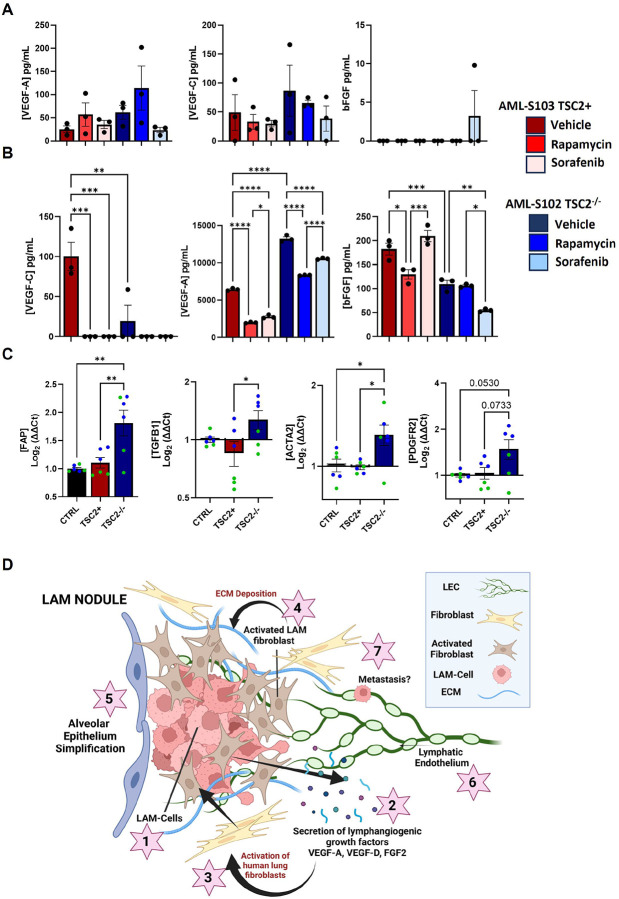
Lymphangioleiomyomatosis (LAM) is a progressive lung disease with limited treatments, largely due to an incomplete understanding of its pathogenesis. Lymphatic endothelial cells (LECs) invade LAM cell clusters, which include HMB-45-positive epithelioid cells and smooth muscle α-actin-expressing LAM-associated fibroblasts (LAMFs). Recent evidence shows that LAMFs resemble cancer-associated fibroblasts, with LAMF-LEC interactions contributing to disease progression. To explore these mechanisms, we used spatial transcriptomics on LAM lung tissues and identified a gene cluster enriched in kinase signaling pathways linked to myofibroblasts and co-expressed with LEC markers. Kinase arrays revealed elevated PDGFR and FGFR in LAMFs. Using a 3D co-culture spheroid model of primary LAMFs and LECs, we observed increased invasion in LAMF-LEC spheroids compared to non-LAM fibroblasts. Treatment with sorafenib, a multikinase inhibitor, significantly reduced invasion, outperforming Rapamycin. We also confirmed TSC2-null AML cells as key VEGF-A secretors, which was suppressed by sorafenib in both AML cells and LAMFs. These findings highlight VEGF-A and bFGF as potential therapeutic targets and suggest multikinase inhibition as a promising strategy for LAM.


Conflict of interest statement

Competing interests: Authors declare that they have no competing interests.

Figures

Figure 1:
Figure 1:. Identification of LAM nodules in patient LAM lung tissue.
(A) Tiled 20x image of H&E staining of LAM lung tissue, red arrows indicate simplified alveoli. (B–F) Representative images of LAM lung tissues stained with VEGFR3 (green), PDPN (yellow), HMB-45 (cyan) and SMAA (red). Nuclei are counterstained with DAPI (blue) in all images. White arrows indicate alveolar cysts, orange arrows highlight LAM nodules forming near cysts and yellow arrows in D indicate PDPN and VEGFR3 expressing LEC recruited to LAM nodules. Scale bars represent 2mm in A, 500 μm in B and 50 μm in C–F.
Figure 2:
Figure 2:. Spatial-omic analysis of LAM tissue highlights LAM-Core regions.
(A & E) H&E staining of LAM lung tissues used for spatial transcriptomics. (B & F) Spatial mapping of the gene clusters for each of the lung tissues identified in the UMAPS provided in C & G, respectively, the colours represent the distinct cellular clusters categorized by gene expression on one of spot transcriptome. (D&H) Violin plots for established LAM-associated genes represented across each cell cluster for LAM_D1 and LAM_D2 lung tissues. (I) UMAP where colours represent the distinct cellular clusters categorized by gene expression on one of spot transcriptome for the combined dataset from both LAM tissues. (J) Spatial localization of well-established LAM genes ACTA2 and VEGFD from LAM_D1 lungs showing LAM nodule localization correlating to high gene expression. (K) Violin plots of LAM-Core genes in the combined dataset identifying cluster 4 as the LAM-Core. (L) Heat map for gene expression for the combined dataset where each column represents the colour coded cell cluster for all differentially expressed LAM-Core enriched genes with key up and down regulated genes highlighted. (M) Significant IPA canonical pathways enrichment in the LAM-Core. Orange represents positive z-scores, and blue represents negative z-scores.
Figure 3:
Figure 3:. LAM-Core enriched gene signature maps to Myofibroblasts in Azimuth Lung v2 (HLCA) database.
(A & C) Spatial transcriptomic gene clusters from LAM_D1 and LAM-D2 tissues, respectively mapped to Lung v2 dataset for level 3 annotation. (B & D) Spatial gene clusters represented by cell type signatures in human lung tissues for LAM_D1 and LAM_D2, respectively. (E & F) Robust cell-type decomposition (RCTD) images representing LAM_D1 and LAM_D2 cell-associated gene expression. (G & H) Violin Plots for LAM_D1 tissues showing relative gene expression of LAM-Core genes and LEC gene PDPN with highest expression in Cluster 7 (G) mapping to myofibroblasts (H).
Figure 4:
Figure 4:. LAMFs represent an activated lung fibroblast phenotype compared to Human lung fibroblasts (HLFs).
(A) Relative expression of SMαA comparing HLFs and LAMFs from 3 independent donors with a representative western blot, quantification normalized to β-Actin. (B – C) Representative SMαA (green, C) and phase contrast (D) images of spheroids generated from HLF and LAMF, scale bars = 100μm. (D – E) Quantification of changes in the compactness (D) and solidity (E) of spheroids over 7 days comparing LAMF to HLF. Each dot indicates a spheroid and a minimum of 10 (range 11–78) spheroids were evaluated. N=3 biological replicated per cell type. (F) Kinase array for LAMF representing expression in LAMF relative to the average signal intensity across all proteins evaluated. (G) Heat map of canonical pathways comparing the integrated spatial transcriptomics data with the kinase array data showing kinase related pathways data shown has a cut off z-score >1 and Log10P value >1.5, orange is higher pathway activation and blue is pathway inhibition. (H) qRT-PCR comparing gene expression of PDGFRB and TGFB1I1 in HLF and LAMF. Data represents mean ± S.E.M. with significance represented by * p<0.05, ** p<0.01, **** p<0.0001.
Figure 5:
Figure 5:. LAMF-LEC organoids have increased invasion into the ECM.
(A) Spatial heatmap of localization of LEC genes in LAM_D1 tissue (SOX18, PDPN, LYVE1 and VEGFR3). (B) Co-localization of core LEC gene signature and LAM-Core signature genes in LAM lung tissue LAM_D1. (C) Violin plots showing highest expression of both LEC signature genes and LAM-Core signature genes in blue cluster 4 which spatially maps to histological regions of the lung tissue representing LAM nodules. (D) Representative IF images of LAMF-LEC spheroids with CellTracker-Red labelled LEC and CellTracker-Green labelled LAMF 24 hours after seeding in 3-D culture conditions (E) Quantification of changes in the compactness perimeter and solidity of the co-cultured spheroids over 3days comparing LAMF to HLF. Each dot indicates a spheroid and a minimum of 10 (range 11–78) spheroids were evaluated. (F) Representative images of LAMF-LEC spheroids embedded in ECM after 7 days. (G) Quantification of changes in the compactness perimeter and solidity of the co-cultured spheroids over 7 days comparing LAMF to HLF. Each dot indicates a spheroid and a minimum of 10 (range 11–78) spheroids were evaluated. (H) Representative phase contrast images of HLF and LAMF after 7 days of 3-D culture. In all experiments N=9 experimental repeats. Scale bars represent 100 μm. Data shown represents mean±SEM., significance represented by *p<0.05, **p<0.01 and ***p<0.001.
Figure 6:
Figure 6:. sorafenib treatment inhibits invasion of LAMF spheroids.
(A–C) Changes in perimeter (A & D), Compactness (B & E) and Solidity (C & F) comparing day 3 and day 7 for HLF and LAMF spheroids treated with either 20 nM rapamycin (Rapa) or 7 μM sorafenib (Sora), compared to vehicle (Veh). Each dot indicates a spheroid and a minimum of 10 (range 11–78) spheroids were evaluated for each of 3 independent donors (N=3). (G) Representative phase contrast images of spheroids at Day 7 of treatment for LAMF comparing vehicle to Rapa and Sora treatments. (H) Presto Blue viability assays for HLF and LAMF in response to increasing doses of sorafenib, data is expressed as a percentage of the vehicle mean from three experimental repeats. Data shown represents mean±SEM, significance is represented by *p<0.05, **p<0.01, ***p<0.001 and ****p<0.0001, for N=3 independent donor cells.
Figure 7:
Figure 7:. sorafenib treatment inhibits migration and invasion of LAMF-LEC spheroids.
(A–C) Representative confocal images of spheroids at day 4 (A–B) and day 7 (C) of treatment with 7 μM sorafenib (Sora) or vehicle comparing HLFs and LAMFs co-cultured with LECs. Fibroblasts are stained with CellTracker Green and LECs with Cell Tracker Red. Scale bars in all images are 200 μM. D–F) Changes in Solidity (D), perimeter (E) and Compactness (F) at day 7 for HLF-LEC and LAMF-LEC spheroids treated with either 20 nM rapamycin (Rapa) or 20 nM or 7 μM sorafenib (Sora), compared to vehicle (Veh). Each dot indicates a spheroid and a minimum of 10 (range 11–78) spheroids were evaluated per donor. Data shown represents mean±SEM, significance is represented by *p<0.05, **p<0.01, ***p<0.001 and ****p<0.0001 for each of N=3 donors.
Figure 8:
Figure 8:. sorafenib inhibits secretion of pro-angiogenic cytokines from LAMF and AML-TSC2 cells.
(A–B) secreted VEGF-A, VEGF-C and bFGF from HLF (red) or LAMF (Blue) (A) and AML-S102 (red) and S103 (blue) cells (B). (C) Gene expression of activated fibroblast markers, FAP, TGFB1, ACTA2 and PDGFRA, in HLF induced by supernatants from either HLF (black, control) or from AML-S103 (red, TSC2+) and S102 (blue, TSC2−/−) cells. Data shown represents mean±SEM, significance is represented by *p<0.05, **p<0.01, ***p<0.001 and ****p<0.0001 for each of N=3 donors. (D) Schematic depicting the proposed cellular interactions leading to LAM pathogenesis. LAM-cells (1, TSC2−/−) secrete high levels of VEGF-A, VEGF-D and FGF2 (2) which contribute to the activation of resident lung fibroblasts, generating activated myofibroblasts (3). Activated fibroblasts can lead to dynamic changes in cellular motility and influence the composition of the extracellular matrix (4), creating a unique LAM nodule niche. Activated fibroblasts can also influence alveolar stem cell behaviour (5) and these same secreted factors can recruit lymphatic endothelial cells (6) to LAM nodules, which may also provide a pathway for LAM metastasis to other organs (7).

References

    1. Johnson S., Rare diseases. 1. Lymphangioleiomyomatosis: clinical features, management, and basic mechanisms. Thorax 54, 254–264 (1999). - PMC - PubMed
    1. Kitaichi M., Nishimura K., Itoh H., Izumi T., Pulmonary Lymphangioleiomyomatosis: a report of 46 patients including a clinicopathologic study of prognostic factors. Am J Respir Crit Care Med 151, 527–533 (1995). - PubMed
    1. Harari S., Torre O., Moss J., Lymphangioleiomyomatosis: what do we know and what are we looking for? European Respiratory Review 20, 034–044 (2011). - PMC - PubMed
    1. Kwiatkowski D. J., Tuberous sclerosis: from tubers to mTOR. Ann Hum Genet 67, 87–96 (2003). - PubMed
    1. Henske E. P., Scheithauer B. W., Short M. P., Wollmann R., Nahmias J., Hornigold N., van Slegtenhorst M., Welsh C. T., Kwiatkowski D. J., Allelic loss is frequent in tuberous sclerosis kidney lesions but rare in brain lesions. Am J Hum Genet 59, 400–406 (1996). - PMC - PubMed

Publication types