[Preprint]. 2023 Jun 12:2023.06.10.544442.
doi: 10.1101/2023.06.10.544442.

A subtle structural modification of a synthetic cannabinoid receptor agonist drastically increases its efficacy at the CB1 receptor

Affiliations

A subtle structural modification of a synthetic cannabinoid receptor agonist drastically increases its efficacy at the CB1 receptor

Hideaki Yano et al. bioRxiv. .

Update in

Abstract

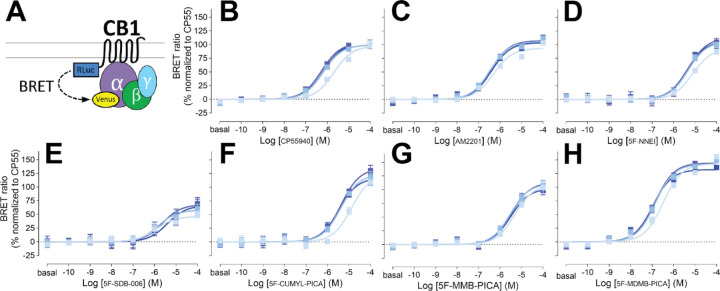
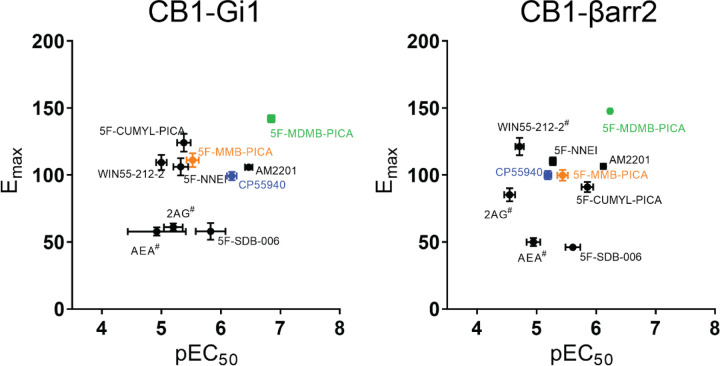
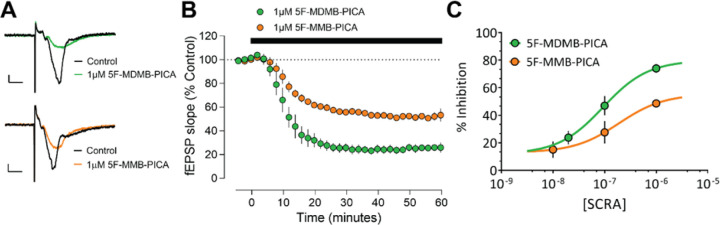
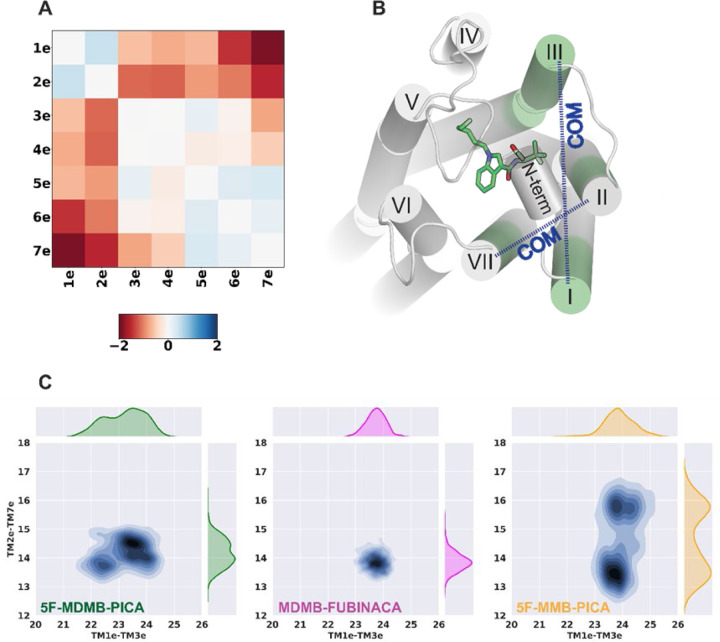
The emergence of synthetic cannabinoid receptor agonists (SCRAs) as illicit psychoactive substances has posed considerable public health risks that include fatalities. Many SCRAs exhibit much higher efficacy and potency, compared with the phytocannabinoid Δ9-tetrahydrocannabinol (THC), at the cannabinoid receptor 1 (CB1R), a G protein-coupled receptor involved in modulating neurotransmitter release. In this study, we investigated structure activity relationships (SAR) of aminoalkylindole SCRAs at CB1Rs, focusing on 5F-pentylindoles containing an amide linker attached to different head moieties. Using in vitro bioluminescence resonance energy transfer (BRET) assays, we identified a few of SCRAs exhibiting significantly higher efficacy in engaging the Gi protein and recruiting β-arrestin than the reference CB1R full agonist CP55940. Importantly, adding a methyl group at the head moiety of 5F-MMB-PICA yielded 5F-MDMB-PICA, an agonist exhibiting a large increase in efficacy and potency at the CB1R. This pharmacological observation was supported by a functional assay of the effects of these SCRAs on glutamate field potentials recorded in hippocampal slices. Molecular modeling and simulations of the CB1R bound with either of the SCRAs revealed critical structural determinants contributing to the higher efficacy of 5F-MDMB-PICA, and how these subtle differences propagated to the receptor-G protein interface. Thus, we find that apparently minor structural changes in the head moiety of SCRAs can cause major changes in efficacy. Our results highlight the need for close monitoring of structural modifications of newly emerging SCRAs and their potential for toxic drug responses in humans.

Keywords: bioluminescence resonance energy transfer; cannabinoid receptor 1; molecular dynamics; synthetic cannabinoids.


Conflict of interest statement

Competing Interest Statement The authors declare no competing financial interests.

Figures

Figure 1.
Figure 1.. Gi1 engagement BRET
Drug-induced engagement BRET between CB1R-Rluc and Gi1-Venus (A) measured in response to CP55940 (B), AM2201 (C), 5F-NNEI (D), 5F-SDB-006 (E), 5F-CUMYL-PICA (F), 5F-MMB-PICA (G), 5F-MDMB-PICA (H) at various time points (2, 16, 30, 44 min light to dark blue). Concentration-response curves are plotted as a percentage of maximal response by CP55940 at each time point and presented as means ± SEM of n ≥ 3 independent experiments.
Figure 2.
Figure 2.. β-arrestin 2 recruitment BRET
Drug-induced recruitment BRET between CB1R-Rluc and β-arrestin 2-Venus (A) measured in response to CP55940 (B), AM2201 (C), 5F-NNEI (D), 5F-SDB-006 (E), 5F-CUMYL-PICA (F), 5F-MMB-PICA (G), 5F-MDMB-PICA (H) at various time points (2, 16, 30, 44 min light to dark blue). Concentration-response curves are plotted as a percentage of maximal response by CP55940 at each time point and presented as means ± SEM of n ≥ 3 independent experiments.
Figure 3.
Figure 3.. Emax-pEC50 plot
Emax-pEC50 comparison between CB1R-Gi1 engagement and β-arrestin 2 recruitment # Y-axis cut-off value at the highest concentration is shown for its Emax.
Figure 4.
Figure 4.. Brain slice electrophysiology
Concentration‐dependent inhibition of hippocampal glutamate release by 5F-MDMB-PICA and 5F-MMB-PICA. (A) Representative averaged traces for 5F-MDMB-PICA (upper) and 5F-MMB-PICA (lower), (B) Summary time course of recordings (n ≥ 3 recordings) demonstrating the effect of SCRAs. (C) Concentration–response curve for 5F-MDMB-PICA and 5F-MMB-PICA (n ≥ 3 slices per concentration). The pEC50 was calculated to be 7.20 and 6.72 for 5F-MDMB-PICA and 5F-MMB-PICA respectively. Data points are presented as means ± SEM.
Figure 5.
Figure 5.. Ligands’ dihedral angle and binding pocket
(A) The zoom-out view of the receptor (grey) bound with Gαi (dark grey) and MDMB-FUBINACA (magenta). (B) The binding mode of 5F-MDMB-PICA (green), MDMB-FUBINACA (magenta), and 5F-MMB-PICA (yellow and orange) and their associated binding site residues that show differences in contact frequency between 5F-MDMB-PICA, MDMB-FUBINACA, and 5F-MMB-PICA. The residues that show differences are color coded correspondingly. (C) The zoom-in view of the superimposed ligands in the binding site. They occupy the same region in binding pocket but 5F-MMB-PICA picks two distinct conformers for head moiety. (D) The 2D map of head moiety dihedral angles (Supplementary Figure 1).
Figure 6.
Figure 6.. PIA-GPCR analysis and TMs’ COM distribution
(A) PIA-GPCR COM results for TMs’ extracellular domain (ΔTMe(COM) = TMe(COM)5F-MDMB-PICA – TMe(COM)5F MMB-PICA). (B) The 5F-MDMB-PICA in the binding pocket. The highlighted transmembrane sub-segments are extracellular part of TM1, TM2, TM3, and TM7 (denoted as TM1e, TM2e, TM3e, and TM7e). The blue dashed arrows show the COM distance between TM1e – TM3e and TM2e – TM7e. (C) The 2D distribution of the COM distances. 5F-MMB-PICA shows two distinct distributions for TM2e – TM7e COM distance which seems to be the result of the changes in head moiety seen for this ligand.
Figure 7.
Figure 7.. Correlation-based network pathway
(A) The CB1R structure bound with 5F-MDMB-PICA with final correlated pairs mapped on the structure. The green pairs are representative pairs for 5F-MDMB-PICA and the yellow pairs are representative for 5F-MMB-PICA. There is a noticeable difference between these two ligands signaling pathway. The CB1R/5F-MDMB-PICA network includes a pathway consisting of eight strongly correlated pairs (solid green lines) which connect the E1331.49-L3997.55 (TM1i – TM7i) changes to the changes at the extracellular-middle domain, F1742.61-D1762.63 (TM2m – TM2e), the intracellular domain, A1602.47-A3987.54 (TM2i – TM7i), H1431.59-F408H8 (TM1i – H8), T3446.36-L3997.55 (TM6i – TM7i), H406H8-R409H8 (H8 – H8), and the changes between the intracellular domain and Gα,T313ICL3-S265 (ICL3 – Gα), T313 ICL3-E318 (ICL3 – Gα), and R4007.56- K349 (TM7i – Gα). E1331.49-L3997.55 (TM1i – TM7i) is at the core of these correlated pairs. There is no such pathway for CB1R/5F-MMB-PICA. (B) The TM2e key residue H1782.65 contributes to the 5F-MDMB-PICA signaling pathway. (C) The TM2i residue (F1552.42) and TM7i NPxxY residues (P3947.50 and Y3977.53) are unique to 5F-MDMB-PICA network pathway

References

    1. Huffman JW, Dai D., Martin B.R., Compton D.R.: Design, synthesis and pharmacology of cannabimimetic indoles. Bioorganic & Medicinal Chemistry Letters 1994, 4(4):563–566.
    1. Wiley JL, Compton DR, Dai D, Lainton JA, Phillips M, Huffman JW, Martin BR: Structure-activity relationships of indole- and pyrrole-derived cannabinoids. J Pharmacol Exp Ther 1998, 285(3):995–1004. - PubMed
    1. Usui K, Fujita Y, Kamijo Y, Kokaji T, Funayama M: Identification of 5-Fluoro ADB in Human Whole Blood in Four Death Cases. J Anal Toxicol 2018, 42(2):e21–e25. - PubMed
    1. Adams AJ, Banister SD, Irizarry L, Trecki J, Schwartz M, Gerona R: “Zombie” Outbreak Caused by the Synthetic Cannabinoid AMB-FUBINACA in New York. N Engl J Med 2017, 376(3):235–242. - PubMed
    1. Notes from the field: Severe illness associated with synthetic cannabinoid use - Brunswick, Georgia, 2013. MMWR Morb Mortal Wkly Rep 2013, 62(46):939. - PMC - PubMed

Publication types