[Preprint]. 2023 Jun 14:2023.06.14.544381.
doi: 10.1101/2023.06.14.544381.

Combination of Polymeric Micelle Formulation of TGFβ Receptor Inhibitors and Paclitaxel Produce Consistent Response Across Different Mouse Models of TNBC

Affiliations

Combination of Polymeric Micelle Formulation of TGFβ Receptor Inhibitors and Paclitaxel Produce Consistent Response Across Different Mouse Models of TNBC

Natasha Vinod et al. bioRxiv. .

Update in

Abstract

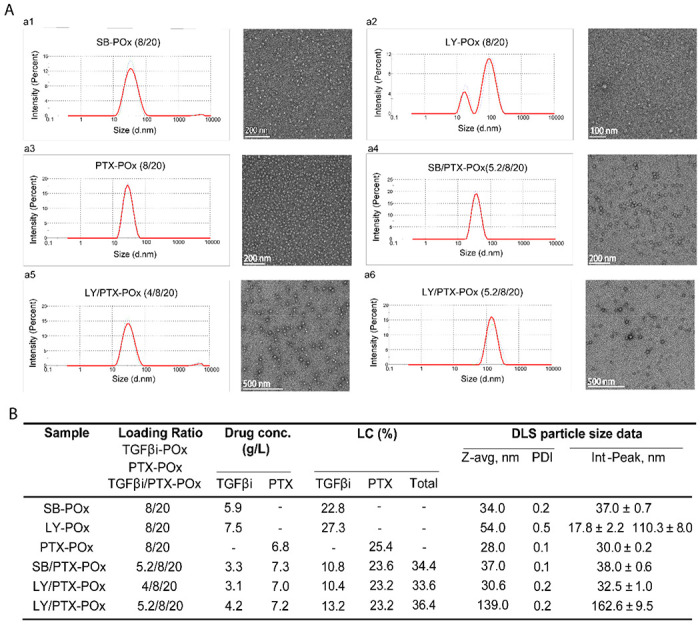
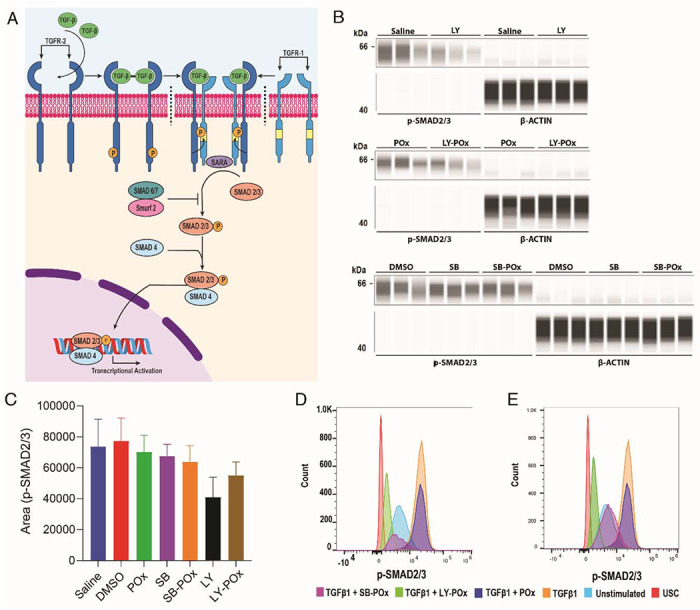
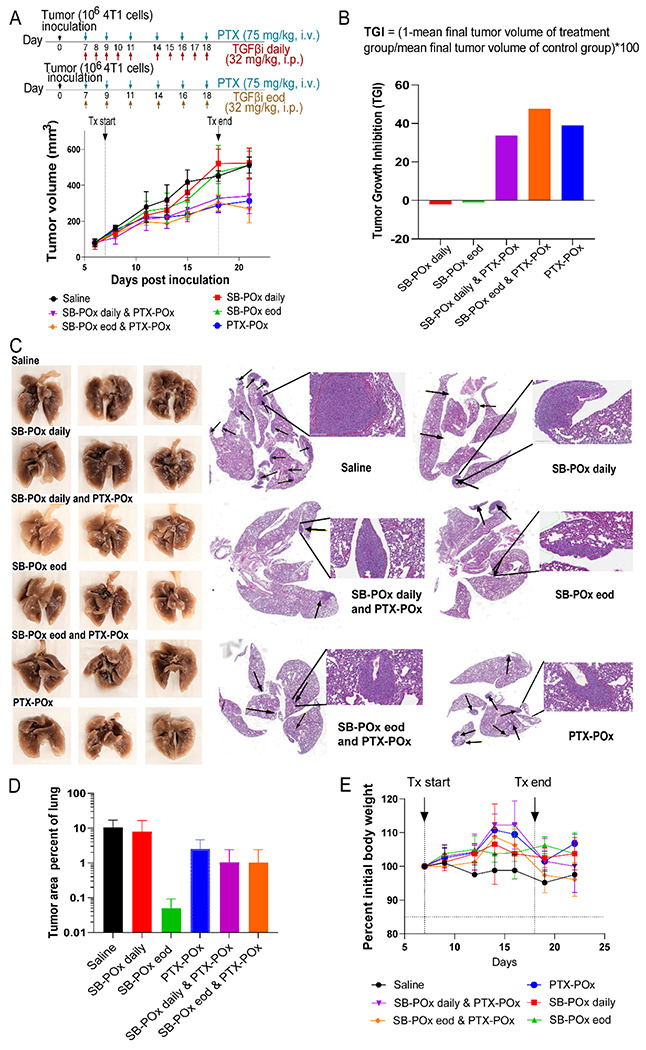
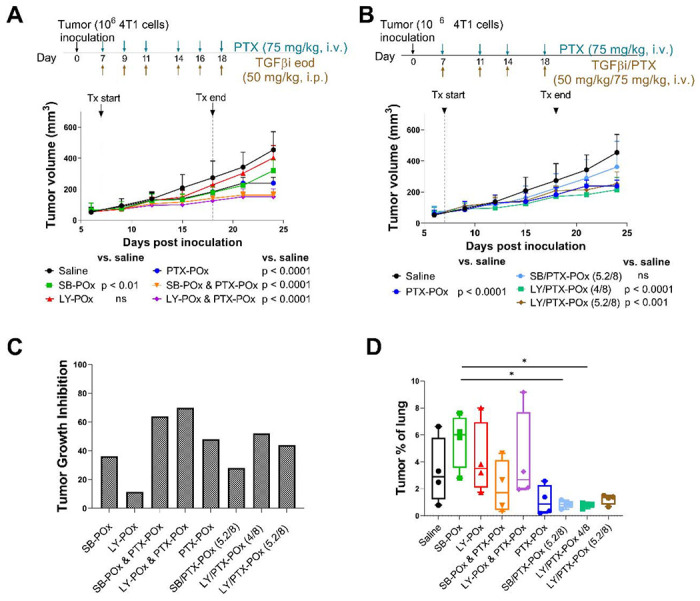
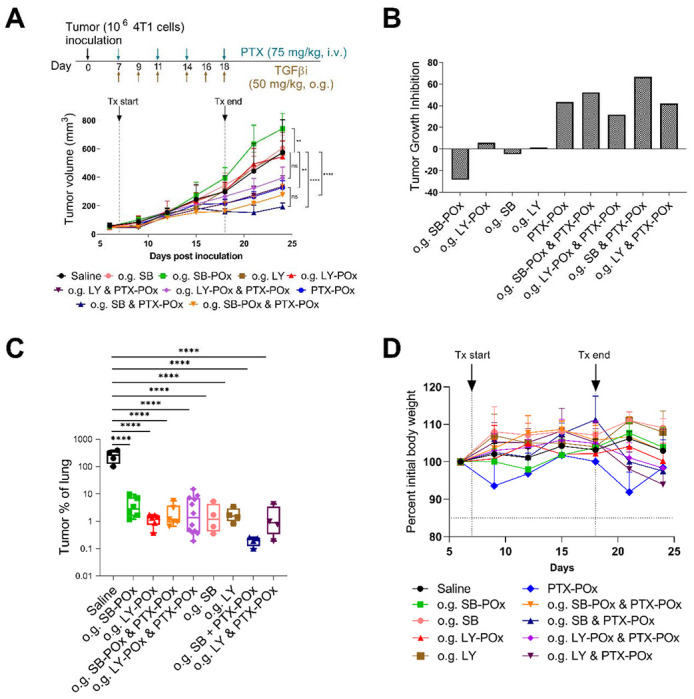
Triple-negative breast cancer (TNBC) is notoriously difficult to treat due to the lack of targetable receptors and sometimes poor response to chemotherapy. The transforming growth factor-beta (TGFβ) family of proteins and their receptors (TGFR) are highly expressed in TNBC and implicated in chemotherapy-induced cancer stemness. Here we evaluated combination treatments using experimental TGFR inhibitors (TGFβi), SB525334 (SB), and LY2109761 (LY) with Paclitaxel (PTX) chemotherapy. These TGFβi target TGFR-I (SB) or both TGFR-I&II (LY). Due to the poor water solubility of these drugs, we incorporated each of them in poly(2-oxazoline) (POx) high-capacity polymeric micelles (SB-POx and LY-POx). We assessed their anti-cancer effect as single agents and in combination with micellar Paclitaxel (PTX-POx) using multiple immunocompetent TNBC mouse models that mimic human subtypes (4T1, T11-Apobec and T11-UV). While either TGFβi or PTX showed a differential effect in each model as single agents, the combinations were consistently effective against all three models. Genetic profiling of the tumors revealed differences in the expression levels of genes associated with TGFβ, EMT, TLR-4, and Bcl2 signaling, alluding to the susceptibility to specific gene signatures to the treatment. Taken together, our study suggests that TGFβi and PTX combination therapy using high-capacity POx micelle delivery provides a robust anti-tumor response in multiple TNBC subtype mouse models.


Conflict of interest statement

Conflict of Interest: A.V.K. is an inventor on patents pertinent to the subject matter of the present contribution, co-founder, stockholder and director of DelAqua Pharmaceuticals Inc. having intent of commercial development of POx-based drug formulations. A.V.K. is also a co-founder, stockholder and director of SoftKemo Pharma Corp. and BendaRx Pharma Corp., which develop polymeric drug formulation and a blood cancer drug. M.S.P. discloses potential interest in DelAqua Pharmaceuticals Inc., SoftKemo Pharma Corp. and BendaRx Pharma Corp. as a spouse of a co-founder. C.M.P is an equity stockholder and consultant of BioClassifier LLC; C.M.P is also listed as an inventor on patent applications for the Breast PAM50 Subtyping assay.

Figures

Fig. 1
Fig. 1. Characterization of single TGFβi and co-loaded TGFβi/PTX in POx micelles by DLS and TEM.
(A) DLS intensity size distributions and the corresponding TEM images of the nanoassemblies formed in drug-loaded PMs of various compositions (a1) SB-POx (8/20); (a2) LY-POx (8/20); (a3) PTX-POx (8/20); (a4) SB/PTX-POx (5.2/8/20); (a5) LY/PTX-POx (4/8/20); (a6) LY/PTX-POx (5.2/8/20). The numbers in the brackets represent the mass ratios TGFβi/POx, PTX/POx or TGFβi/PTX/POx. (B) Drug concentration, loading capacity (LC (%) = Mdrug / (Mdrug + Mexcipient) × 100 (%)) and DLS characteristics (z-average hydrodynamic diameter, polydispersity index (PDI), diameters at intensity size distribution maxima) of the formulations presented in (A). Drug concentration in the solution was measured by HPLC. For DLS measurements, the samples prepared at POx 20 mg/ml were diluted 10 times.
Fig. 2
Fig. 2. TGFβi treatment suppresses TGFβ signaling in NIH-3T3 fibroblasts.
(A) Schematic of canonical TGFβ signaling. (B) Capillary-based western blot analysis of expression of p-SMAD2/3 (~62kDa) and housekeeping protein, β-ACTIN (~48kDa) in NIH-3T3 cells treated with TGFβi in POx PMs (SB-POx (8/20) and LY-POx (8/20)) or dissolved in DMSO. Control groups were treated with the same amounts of POx or DMSO. The images were generated using Compass for Simple Western (version 6.0). (C) The quantification of p-SMAD2/3 bands in B. *p<0.05 computed by one-way ANOVA with Tukey’s multiple comparisons test. (D, E) The p-SMAD2/3 expression analyzed by flow cytometry in NIH-3T3 cells treated with TGFβi (D) formulated in POx PMs or (E) dissolved in DMSO. The D and E panels were run in the same experiment and split for the clarity of presentation to avoid overlap between the free and micelle-formulated drug histograms. The panels have common histograms for unstained (USC), unstimulated, TGFβ stimulated controls.
Fig. 3
Fig. 3. TGFβ inhibition synergizes with chemotherapy to inhibit primary tumor growth and lung metastases in 4T1 TNBC tumor-bearing mice.
(A) Tumor growth curves following treatments with single drug SB-POx (8/20) i.p., single drug PTX-POx (8/20) i.v., or separately administered combinations SB-POx (8/20) i.p. and PTX-POx (8/20) i.v. using different SB-POx schedules (daily or eod) at 32 mg/kg. See supplementary Table S3 for the complete statistical comparison between all groups. (B) Percent tumor growth inhibition corresponding to tumor growth curves. (C) Images of lungs with metastatic nodules (left) and corresponding H&E stain images (right) with metastatic nodules indicated with black arrows from representative mice in each group. (D) Histopathological scoring of lung metastatic burden. (E) Body weight changes (percent of initial) in mice treated with TGFβi-POx and/or PTX-POx.
Fig. 4
Fig. 4. Tumor growth inhibition with i.p. versus i.v. routes of TGFβi delivery
(A) Tumor growth curves in 4T1 tumor-bearing mice treated with either single drug or separately administered TGFβi and PTX combinations, or (B) co-loaded micelles of TGFβi and PTX (common saline and PTX-POx groups were used for experiments 4A and 4B since the experiments were conducted in parallel); See supplementary Table S4 for the complete statistical comparison between all groups. (C) Percent tumor growth inhibition by treatments corresponding to 4A and 4B. (D) Histopathological scoring of lung metastatic burden. Data represent mean ± SD. N=2 with duplicate sections. *p < 0.05 computed by one-way ANOVA with Tukey’s posthoc test.
Fig. 5
Fig. 5. Tumor growth inhibition with oral route of TGFβi delivery
(A) Tumor growth curves in 4T1 tumor-bearing mice treated with orally delivered (o.g.) TGFβi formulated either in POx or 0.5% NaCMC and 0.25% Tween 80. Data represent mean ± SD. N=4. **p < 0.003, ****p < 0.0001 computed by two-way ANOVA with Tukey’s posthoc test. See supplementary Table S5 for the complete statistical comparison between all groups. (B) Percent tumor growth inhibition by treatments corresponding to 5A. (C) Histopathological scoring of lung metastatic burden. Data represent mean ± SD. N=2 with duplicate sections. ****p < 0.0001 computed by one-way ANOVA with Tukey’s posthoc test. (D) Body weight changes (percent of initial) in mice treated with TGF²i-POx and/or PTX-POx.
Fig. 6
Fig. 6. Differential sensitivity of Claudin-low TNBC subtypes to TGFβi and PTX.
Tumor growth curves following treatments with single drug SB-POx (8/20) i.p., single drug PTX-POx (8/20) i.v., or separately administered combinations SB-POx (8/20) i.p. and PTX-POx (8/20) i.v. in mice bearing (A) T11-Apobec and (B) T-11 UV tumors. Data represent mean ± SD. N=4. **p < 0.003, ****p < 0.0001 computed by two-way ANOVA with Tukey’s posthoc test. See supplementary Tables S6 and S7 for the complete statistical comparison between all groups. (C, D) Percent tumor growth inhibition by treatments corresponding to 4A and 4B as determined at the endpoint of tumor growth experiments. (E, F) Body weight changes (percent of initial) in mice treated with TGFβi-POx and/or PTX-POx.

References

    1. Sung H., Ferlay J., Siegel R.L., Laversanne M., Soerjomataram I., Jemal A., Bray F., Global cancer statistics 2020: GLOBOCAN estimates of incidence and mortality worldwide for 36 cancers in 185 countries, CA: a cancer journal for clinicians 71(3) (2021) 209–249. - PubMed
    1. Prat A., Parker J.S., Karginova 0., Fan C., Livasy C., Herschkowitz J.I., He X., Perou C.M., Phenotypic and molecular characterization of the claudin-low intrinsic subtype of breast cancer, Breast cancer research 12(5) (2010) 1–18. - PMC - PubMed
    1. Lehmann B.D., Bauer J.A., Chen X., Sanders M.E., Chakravarthy A.B., Shyr Y., Pietenpol J.A., Identification of human triple-negative breast cancer subtypes and preclinical models for selection of targeted therapies, The Journal of clinical investigation 121(7) (2011) 2750–2767. - PMC - PubMed
    1. Marra A., Trapani D., Viale G., Criscitiello C., Curigliano G., Practical classification of triple-negative breast cancer: intratumoral heterogeneity, mechanisms of drug resistance, and novel therapies, NPJ Breast Cancer 6(1) (2020) 1–16. - PMC - PubMed
    1. Fornier M., Fumoleau P., The paradox of triple negative breast cancer: novel approaches to treatment, The breast journal 18(1) (2012) 41–51. - PubMed

Publication types