

This is a preprint.
Resting-state EEG signatures of Alzheimer's disease are driven by periodic but not aperiodic changes
- PMID: 37398162
- PMCID: PMC10312609
- DOI: 10.1101/2023.06.11.544491
Resting-state EEG signatures of Alzheimer's disease are driven by periodic but not aperiodic changes
Update in
-
Resting-state EEG signatures of Alzheimer's disease are driven by periodic but not aperiodic changes.Neurobiol Dis. 2024 Jan;190:106380. doi: 10.1016/j.nbd.2023.106380. Epub 2023 Dec 17. Neurobiol Dis. 2024. PMID: 38114048
Abstract
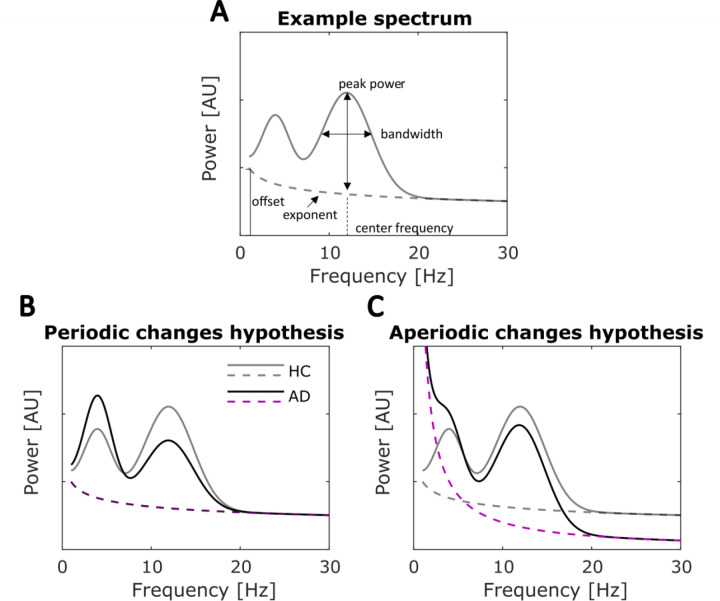
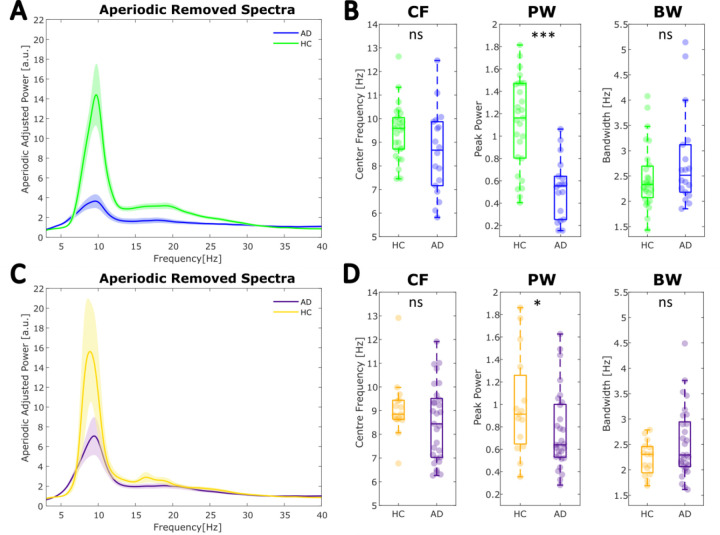
Electroencephalography (EEG) has shown potential for identifying early-stage biomarkers of neurocognitive dysfunction associated with dementia due to Alzheimer's disease (AD). A large body of evidence shows that, compared to healthy controls (HC), AD is associated with power increases in lower EEG frequencies (delta and theta) and decreases in higher frequencies (alpha and beta), together with slowing of the peak alpha frequency. However, the pathophysiological processes underlying these changes remain unclear. For instance, recent studies have shown that apparent shifts in EEG power from high to low frequencies can be driven either by frequency specific periodic power changes or rather by non-oscillatory (aperiodic) changes in the underlying 1/f slope of the power spectrum. Hence, to clarify the mechanism(s) underlying the EEG alterations associated with AD, it is necessary to account for both periodic and aperiodic characteristics of the EEG signal. Across two independent datasets, we examined whether resting-state EEG changes linked to AD reflect true oscillatory (periodic) changes, changes in the aperiodic (non-oscillatory) signal, or a combination of both. We found strong evidence that the alterations are purely periodic in nature, with decreases in oscillatory power at alpha and beta frequencies (AD < HC) leading to lower (alpha + beta) / (delta + theta) power ratios in AD. Aperiodic EEG features did not differ between AD and HC. By replicating the findings in two cohorts, we provide robust evidence for purely oscillatory pathophysiology in AD and against aperiodic EEG changes. We therefore clarify the alterations underlying the neural dynamics in AD and emphasise the robustness of oscillatory AD signatures, which may further be used as potential prognostic or interventional targets in future clinical investigations.
Conflict of interest statement
Competing interests Dr. A. Pascual-Leone is partly supported by grants from the National Institutes of Health (R01AG076708, R03AG072233) and BrightFocus Foundation. Dr. A. Pascual-Leone serves as a paid member of the scientific advisory boards for Neuroelectrics, Magstim Inc., TetraNeuron, Skin2Neuron, MedRhythms, and Hearts Radiant. He is co-founder of TI solutions and co-founder and chief medical officer of Linus Health. None of these companies have any interest in or have contributed to the present work. Dr. A Pascual-Leone is listed as an inventor on several issued and pending patents on the real-time integration of transcranial magnetic stimulation with electroencephalography and magnetic resonance imaging, and applications of noninvasive brain stimulation in various neurological disorders; as well as digital biomarkers of cognition and digital assessments for early diagnosis of dementia. The remaining authors declare no competing financial interests.
Figures


References
-
- Amariglio R. E., Frishe K., Olson L. E., Wadsworth L. P., Lorius N., Sperling R. A., & Rentz D. M. (2012). Validation of the Face Name Associative Memory Exam in cognitively normal older individuals. Journal of Clinical and Experimental Neuropsychology, 34(6), 580–587. 10.1080/13803395.2012.666230 - DOI - PMC - PubMed
-
- Babiloni C., Binetti G., Cassarino A., Dal Forno G., Del Percio C., Ferreri F., Ferri R., Frisoni G., Galderisi S., Hirata K., Lanuzza B., Miniussi C., Mucci A., Nobili F., Rodriguez G., Luca Romani G., & Rossini P. M. (2006). Sources of cortical rhythms in adults during physiological aging: A multicentric EEG study. Human Brain Mapping, 27(2), 162–172. 10.1002/hbm.20175 - DOI - PMC - PubMed
-
- Babiloni C., Binetti G., Cassetta E., Cerboneschi D., Dal Forno G., Del Percio C., Ferreri F., Ferri R., Lanuzza B., Miniussi C., Moretti D. V., Nobili F., Pascual-Marqui R. D., Rodriguez G., Romani G. L., Salinari S., Tecchio F., Vitali P., Zanetti O., … Rossini P. M. (2004). Mapping distributed sources of cortical rhythms in mild Alzheimer’s disease. A multicentric EEG study. NeuroImage, 22(1), 57–67. 10.1016/j.neuroimage.2003.09.028 - DOI - PubMed
-
- Babiloni C., Binetti G., Cassetta E., Forno G. D., Percio C. D., Ferreri F., Ferri R., Frisoni G., Hirata K., Lanuzza B., Miniussi C., Moretti D. V., Nobili F., Rodriguez G., Romani G. L., Salinari S., & Rossini P. M. (2006). Sources of cortical rhythms change as a function of cognitive impairment in pathological aging: A multicenter study. Clinical Neurophysiology, 117(2), 252–268. 10.1016/j.clinph.2005.09.019 - DOI - PubMed
-
- Babiloni C., Carducci F., Lizio R., Vecchio F., Baglieri A., Bernardini S., Cavedo E., Bozzao A., Buttinelli C., Esposito F., Giubilei F., Guizzaro A., Marino S., Montella P., Quattrocchi C. C., Redolfi A., Soricelli A., Tedeschi G., Ferri R., … Frisoni G. B. (2013). Resting state cortical electroencephalographic rhythms are related to gray matter volume in subjects with mild cognitive impairment and Alzheimer’s disease. Human Brain Mapping, 34(6), 1427–1446. 10.1002/hbm.22005 - DOI - PMC - PubMed
Publication types
Grants and funding
LinkOut - more resources
Full Text Sources