[Preprint]. 2023 Jun 2:rs.3.rs-2923510.
doi: 10.21203/rs.3.rs-2923510/v1.

Obesity-dependent increase in RalA activity disrupts mitochondrial dynamics in white adipocytes

Affiliations

Obesity-dependent increase in RalA activity disrupts mitochondrial dynamics in white adipocytes

Wenmin Xia et al. Res Sq. .

Update in

Abstract

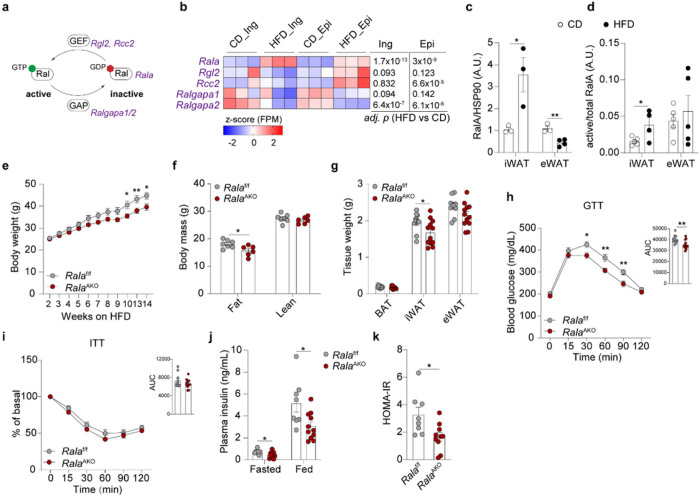
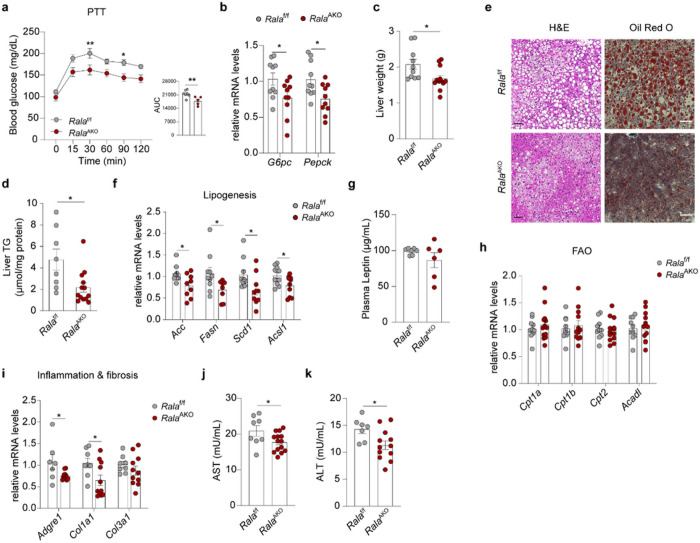
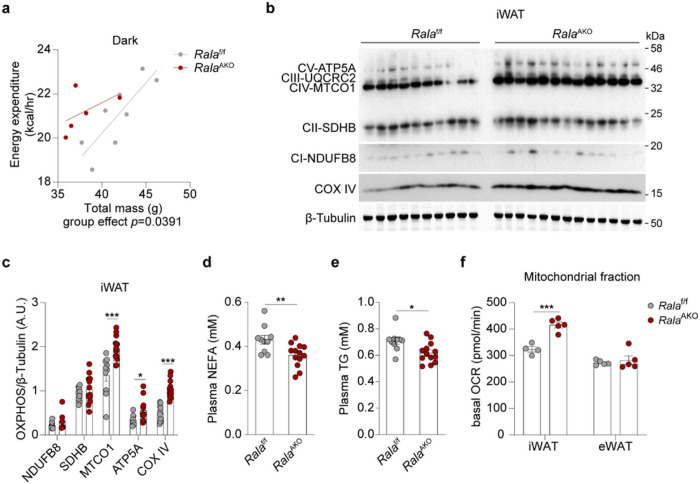
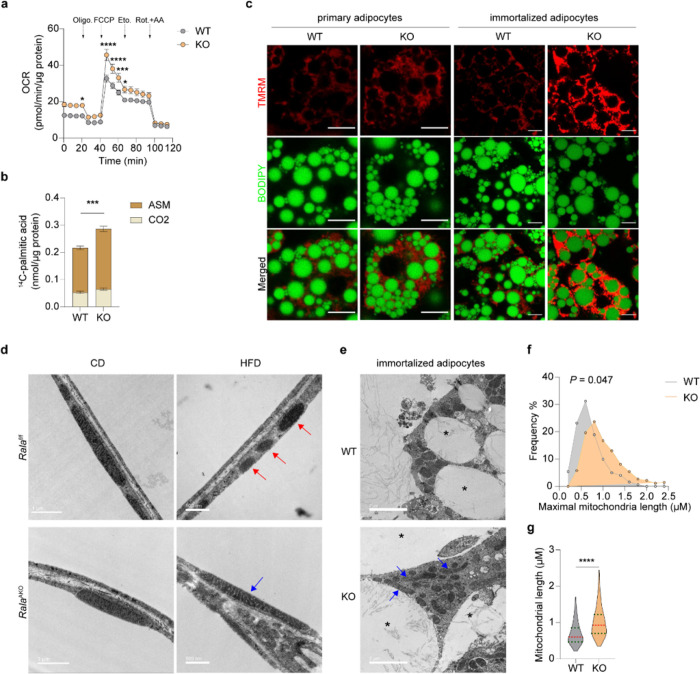
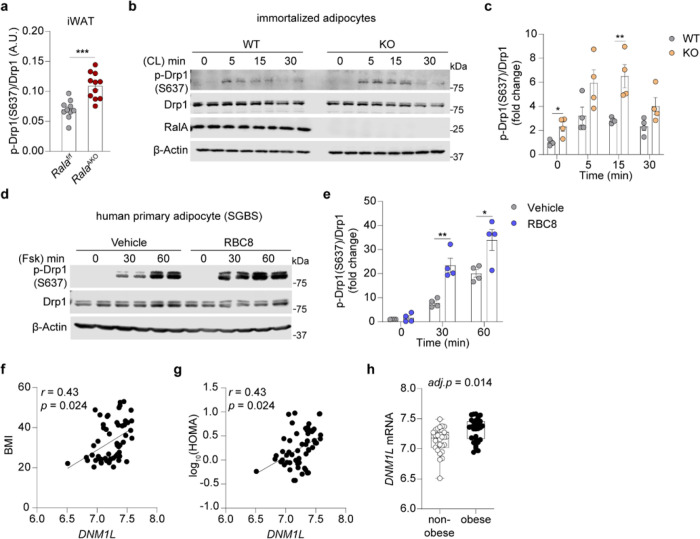
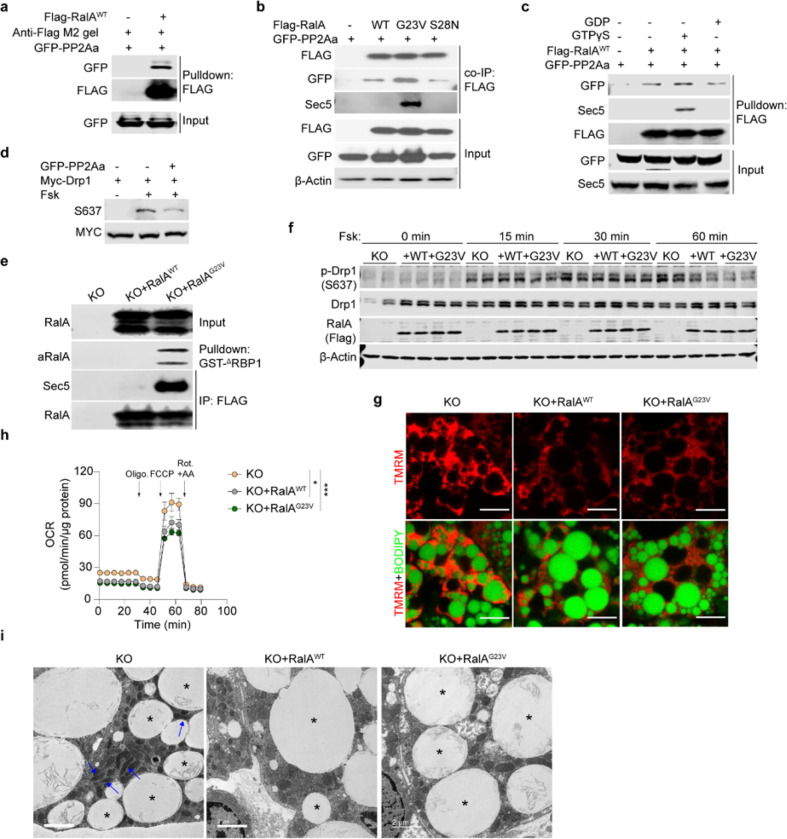
Mitochondrial dysfunction is a characteristic trait of human and rodent obesity, insulin resistance, and fatty liver disease. Here we report that mitochondria undergo fragmentation and reduced oxidative capacity specifically in inguinal white adipose tissue after feeding mice high fat diet (HFD) by a process dependent on the small GTPase RalA. RalA expression and activity are increased in white adipocytes from mice fed HFD. Targeted deletion of Rala in white adipocytes prevents the obesity-induced fragmentation of mitochondria and produces mice resistant to HFD-induced weight gain via increased fatty acid oxidation. As a result, these mice also exhibit improved glucose tolerance and liver function. In vitro mechanistic studies revealed that RalA suppresses mitochondrial oxidative function in adipocytes by increasing fission through reversing the protein kinase A-catalyzed inhibitory Ser637phosphorylation of the mitochondrial fission protein Drp1. Active RalA recruits protein phosphatase 2A (PP2Aa) to specifically dephosphorylate this inhibitory site on Drp1, activating the protein, thus increasing mitochondrial fission. Adipose tissue expression of the human homolog of Drp1, DNML1, is positively correlated with obesity and insulin resistance in patients. Thus, chronic activation of RalA plays a key role in repressing energy expenditure in obese adipose tissue by shifting the balance of mitochondrial dynamics towards excessive fission, contributing to weight gain and related metabolic dysfunction.


Conflict of interest statement

Competing interests The authors declare no competing interests.

Figures

Figure 1
Figure 1. White adipocyte-specific Rala deletion protects mice from high fat diet-induced obesity.
a, Scheme illustrating RalA activation network involving genes encoding RalA, GEF and GAP b, RNA-seq analysis of primary inguinal and epididymal mature adipocytes isolated from mice (n = 3) under 16-weeks HFD feeding. Heatmap displays transcriptional expression as z-scored FPM values. Adjusted p-values are indicated and considered significant with value < 0.05. c, Quantification of RalA protein content in mature adipocytes from iWAT and eWAT of mice fed with CD or HFD for 16 weeks (n = 3–4). d, Quantification of RalA GTPase activity in iWAT and eWAT of mice fed with CD or HFD for 4 weeks (n = 4). e, Body weight of Ralaf/f and RalaAKO mice (n = 8–10) fed with 60% HFD. f, Body mass of Ralaf/f and RalaAKO mice (n = 6–7) fed with HFD for 12 weeks, g, Fat depot weights of Ralaf/f and RalaAKO mice (n = 10–12) fed with HFD for 12 weeks, h, GTT on 11-weeks HFD-fed Ralaf/f and RalaAKO mice (n = 10–13); AUC was calculated from longitudinal chart, i, ITT on 12-week HFD-fed Ralaf/f and RalaAKO mice (n = 11–12); AUC was calculated from longitudinal chart, j, Plasma insulin levels in 8-week HFD-fed Ralaf/f and RalaAKO mice (n = 11). k, HOMA-IR was calculated using fasting glucose and insulin levels from 8-weeks HFD-fed Ralaf/f and RalaAKO mice (n =8–10). The data (c-k) are shown as the mean ± SEM, *p < 0.05, **p < 0.01, ***p < 0.001 by unpaired t-test (c, d, f, g, j, k) or two-way ANOVA with Bonferroni’s multiple comparison as post-test (e, h, i).
Figure 2
Figure 2. Loss of RalA in WAT ameliorates HFD-induced hepatic steatosis.
a, Pyruvate tolerance test (PTT) was performed on overnight fasted Ralaf/f and RalaAKO mice (n = 5–7) after 8 weeks of HFD feeding. AUC was calculated from PTT longitudinal chart, b, Relative mRNA expression of key gluconeogenic genes in livers of HFD-fed Ralaf/f and RalaAKO mice (n = 10). c, Liver weight of HFD-fed Ralaf/f and RalaAKO mice (n = 10–12). d, Triglyceride (TG) content in livers of HFD-fed Ralaf/f and RalaAKO mice (n = 8–13). e, Representative H&E staining (left; n = 3) and Oil-Red-O staining (right; n = 3) of liver sections in HFD-fed Ralaf/f and RalaAKO mice, scale bar =15 mm. f, Relative mRNA expression of lipogenic genes in livers of HFD-fed Ralaf/f and RalaAKO mice (n = 9–10). g, Plasma leptin levels in HFD-fed Ralaf/f and RalaAKO mice (n = 6–7). h, Relative mRNA expression of fatty acid oxidation (FAO) related genes in livers of HFD-fed Ralaf/f and RalaAKO mice (n = 10–11). i, Relative mRNA expression of genes related to inflammation and fibrosis in livers of HFD-fed Ralaf/f and RalaAKO mice (n = 7–11). j, k, Plasma AST (j) and ALT (k) activities in HFD-fed Ralaf/f and RalaAKO mice (n = 7–14). The data (a-d, f-k) are shown as the mean ± SEM, *p < 0.05, **p < 0.01 by unpaired t-test (b-d, f-k) or two-way ANOVA with Bonferroni’s multiple comparison as post-test (a).
Figure 3
Figure 3. RalA deficiency in WAT increases energy expenditure and mitochondrial oxidative phosphorylation.
a, Regression plot of energy expenditure (EE) measured in HFD-fed Ralaf/f and RalaAKO mice (n = 5–8) during dark phase. ANCOVA test was performed using body weight (BW) as a covariate, group effect p = 0.0391. b, c, Immunoblot (b) and quantification (c) of OXPHOS proteins in iWAT of HFD mice (n = 10–13). d, e, Plasma non-esterified fatty acid (NEFA, d) and TG (e) levels in HFD-fed Ralaf/f and RalaAKO mice (n = 10–13). f, Basal oxygen consumption rate (OCR) in mitochondria measured by Seahorse. Mitochondrial fractions were isolated from primary mature adipocytes in iWAT or eWAT of HFD-fed Ralaf/f and RalaAKO mice (n = 4–5). The data (c-f) are shown as the mean ± SEM, *p < 0.05, **p < 0.01,***p < 0.001 by unpaired t-test (c-f).
Figure 4
Figure 4. RalA knockout in white adipocytes increases mitochondrial activity and fatty acid oxidation via preventing obesity-induced mitochondrial fission in iWAT.
a, OCR was measured in differentiated primary adipocytes (n = 8). Vertical arrows indicate injection ports of indicated chemicals, b, 14C-palmitic acid oxidation in differentiated primary adipocytes under basal condition (n = 3–4). ASM: acid-soluble metabolites, c, Representative confocal images (n = 3) of live primary and immortalized adipocytes stained with TMRM (red) and BODIPY (green). Scale bar = 15 μm. d, Representative electron microscope (EM) images of iWAT from CD-fed and HFD-fed Ralaf/f and RalaAKO mice (n = 3). Red arrow indicates fissed mitochondria; blue arrow indicates elongated mitochondria. Scale bar = 1 μm (CD) or = 500 nm (HFD). e, Representative EM images of WT and RalA KO immortalized adipocytes (n = 3). blue arrow indicates elongated mitochondria; asterisk indicates lipid droplet. Scale bar = 2 μm. f, g, Histogram (f) and violin plot (g) of maximal mitochondrial length in immortalized adipocytes (n = 100–180). Violin plot is presented as violin: 25th to 75th percentile, and whiskers: min to max. The data (a, b) are shown as the mean ± SEM, *p < 0.05, **p < 0.01, ***p < 0.001, ****p < 0.0001 by unpaired t-test (b, g), two-way ANOVA alone (f) or with Bonferroni’s multiple comparison as post-test (a).
Figure 5
Figure 5. Inhibition of RalA increases Drp1 S637 phosphorylation in white adipocytes.
a, Quantification of phospho-Drp1 (S637), total Drp1 and β-Tubulin immunoblotting in iWAT of HFD-fed mice (n = 10–13). b, c, Immunoblotting (b) and quantification (c) of phospho-Drp1 (S637), total Drp1, RalA, and (B-Actin in immortalized adipocytes (n = 4). Adipocytes were treated with 1 μM CL 316,243 (CL) for indicated time, d, e, Immunoblotting (d) and quantification (e) of phospho-Drp1 (S637), total Drp1 and β-Actin in human primary adipocytes (SGBS) (n = 4). Cells were pretreated with 50 μM RBC8 or DMSO for 30 min prior to treatment with 20 μM forskolin (Fsk) for indicated time, f, g, DNM1L mRNA expression is correlated with BMI (f) and HOMA (g) in human abdominal subcutaneous adipose tissue samples (n = 56). Significance in correlation was assessed by Spearman’s correlation test, h, Box-and-whisker plot of DNM1L mRNA expression in abdominal subcutaneous adipose tissues from non-obese and obese human subjects (n = 56). The data (a, c, e) are shown as the mean ± SEM, *p < 0.05, **p < 0.01, ***p < 0.001 by unpaired t-test (c,e).
Figure 6
Figure 6. RalA interacts with Drp1 and protein phosphatase 2A, promoting dephosphorylation of Drp1 at S637.
a, Pull down assay determining PP2Aa-RalA interaction. Purified Flag-RalAWT was used to pull down GFP-PP2Aa overexpressed in HEK293T cells, b, Immunoblot analysis of co-immunoprecipitation determining interaction between RalA wildtype (WT), constitutive active (G23V), or dominant negative (S28N) mutants and PP2Aa in HEK293T cells, c, Flag-pull down assay determining interaction between PP2Aa and GTP/GDP-loaded RalA. Purified Flag-RalAWT protein loaded with either GTPγS or GDP was respectively used as a prey to pull down GFP-PP2Aa from HEK293T cells, d, In vitro dephosphorylation assay in HEK293T cells co-transfected with PP2A and Drp1 plasmids. Cells were treated for 1 hr with 20 μM forskolin (Fsk) or vehicle, e, RalA activity assay in immortalized RalA KO adipocytes reconstituted with RalAWT and RalAG23V. f, Immunoblottmg of phospho-Drp1 (S637), total Drp1, Flag-tagged RalA and β-Actin in immortalized RalA KO adipocytes with or without RalA reconstitution (n = 3). Adipocytes were treated with 20 μM forskolin for indicated time, g, Representative confocal images of live immortalized adipocytes (n = 3) stained with TMRM (red) and BODIPY (green), scale bar = 15 μM. h, OCR was measured by seahorse in immortalized adipocytes (n = 5–6). Vertical arrows indicate injection ports of indicated chemicals. Data are shown as the mean ± SEM, *p < 0.05, ***p < 0.001 by two-way ANOVA. i, Representative EM images (n = 3) of RalA KO immortalized adipocytes with or without RalA reconstitution. Blue arrow indicates elongated mitochondria; asterisk indicates lipid droplet. Scale bar = 2 μm.

References

    1. Haththotuwa R.N., Wijeyaratne C.N., and Senarath U. (2020). Worldwide epidemic of obesity. Obes. Obstet., 3–8. 10.1016/B978-0-12-817921-5.00001-1. - DOI
    1. Saltiel A.R. (2012). Insulin Resistance in the Defense against Obesity. Cell Metab. 15, 798–804. 10.1016/J.CMET.2012.03.001. - DOI - PubMed
    1. Saltiel A.R., and Kahn C.R. (2001). Insulin signalling and the regulation of glucose and lipid metabolism. Nat. 2001 4146865 414, 799–806. 10.1038/414799a. - DOI - PubMed
    1. Kahn S.E., Hull R.L., and Utzschneider K.M. (2006). Mechanisms linking obesity to insulin resistance and type 2 diabetes. Nature 444, 840–846. 10.1038/NATURE05482. - DOI - PubMed
    1. Reilly S.M., and Saltiel A.R. (2017). Adapting to obesity with adipose tissue inflammation. Nat. Rev. Endocrinol. 2017 1311 13, 633–643. 10.1038/nrendo.2017.90. - DOI - PubMed

Publication types