[Preprint]. 2023 Jun 15:rs.3.rs-3049913.
doi: 10.21203/rs.3.rs-3049913/v1.

Mycobacterium tuberculosis resides in lysosome-poor monocyte-derived lung cells during chronic infection

Affiliations

Mycobacterium tuberculosis resides in lysosome-poor monocyte-derived lung cells during chronic infection

Weihao Zheng et al. Res Sq. .

Update in

Abstract

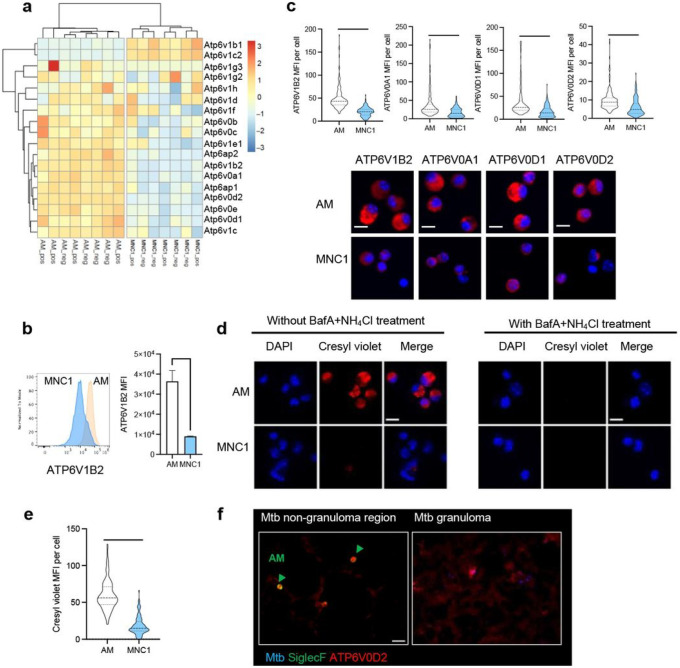
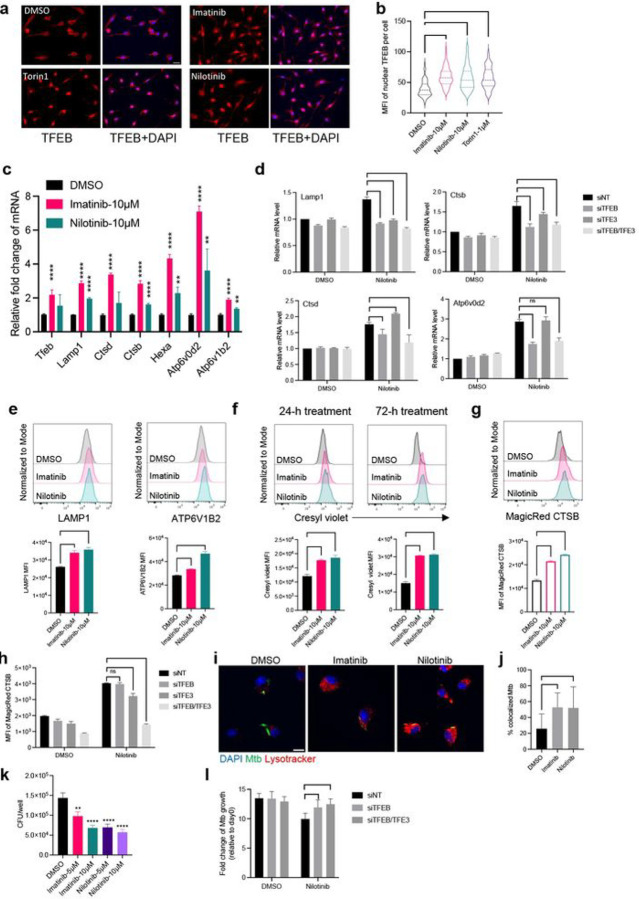
Mycobacterium tuberculosis (Mtb) persists in lung myeloid cells during chronic infection. However, the mechanisms allowing Mtb to evade elimination are not fully understood. Here, we determined that in chronic phase, CD11clo monocyte-derived lung cells termed MNC1 (mononuclear cell subset 1), harbor more live Mtb than alveolar macrophages (AM), neutrophils, and less permissive CD11chi MNC2. Transcriptomic and functional studies of sorted cells revealed that the lysosome biogenesis pathway is underexpressed in MNC1, which have less lysosome content, acidification, and proteolytic activity than AM, and less nuclear TFEB, a master regulator of lysosome biogenesis. Mtb infection does not drive lysosome deficiency in MNC1. Instead, Mtb recruits MNC1 and MNC2 to the lungs for its spread from AM to these cells via its ESX-1 secretion system. The c-Abl tyrosine kinase inhibitor nilotinib activates TFEB and enhances lysosome function of primary macrophages and MNC1 and MNC2 in vivo, improving control of Mtb infection. Our results indicate that Mtb exploits lysosome-poor monocyte-derived cells for in vivo persistence, suggesting a potential target for host-directed tuberculosis therapy.


Conflict of interest statement

Competing interests The authors declare that they have no competing interests.

Figures

Figure 1
Figure 1. MNC1 are highly permissive for Mtb intracellular survival.
C57BL/6 mice were infected with the designated strain of Mtb by low-dose aerosol. Lung cells were isolated for flow cytometry analysis or live cell sorting at the indicated timepoints post infection. a Lung phagocyte population dynamics after Mtb (H37Rv-ZsGreen) infection. Neutrophils (Neut), MNC1, and MNC2 increase in response to Mtb infection, while the number of alveolar macrophages (AM) changed minimally. b Number of Mtb H37Rv-ZsGreen+ cells in distinct lung phagocyte subsets by flow cytometry. c Cell type composition of total Mtb H37Rv-ZsGreen+ lung leukocytes by flow cytometry. After predominant distribution of Mtb in AM and neutrophils, MNC1 and MNC2 dominate by 28 dpi. d Schematic diagram of procedures to quantitate intracellular live Mtb in sorted lung phagocyte subsets. C57BL/6 mice were infected with Mtb H37Rv-live/dead or H37Rv-GFP and cells containing fluorescent protein-expressing bacteria were analyzed at 28 dpi. H37Rv-live/dead carries a plasmid that drives constitutively expression of mCherry and tetracycline-inducible GFP. For induction of GFP expression in live bacteria, doxycycline was administered via drinking water for 6 days before harvest at 28 dpi. e MNC1 contain the largest number of live Mtb per cell 28 dpi. Quantitation of live (GFP+mCherry+) or dead (GFPmCherry+) Mtb per infected cell (n ≥ 300) was performed by fluorescence microscopy on viable cells sorted from mice infected with Mtb H37Rv-live/dead. Representative images on the right show live and dead Mtb. Dead (mCherry+GFP) Mtb are red; live (mCherry+GFP+) appear yellow. The majority of the Mtb in AM and neutrophils are dead, while the majority of the bacteria in MNC1 and MNC2 are live (MNC1>MNC2). f MNC1 contain the largest number of live Mtb (H37Rv-GFP) at 28 dpi. Cells in each subset were sorted according to surface phenotypes and for bacterial status (GFP+). CFU of sorted GFP+ cells in each subset were counted after 3 wk incubation. The results are expressed as CFU per 1000 GFP+ cells in each subset. g GFP MFI correlates with live Mtb burdens in the 4 infected lung myeloid cell subsets from mice infected with H37Rv-GFP (28 dpi). Unless otherwise stated (e.g., MFI), results are presented as mean ± SD of 4–5 mice, and are representative of 2–3 independent experiments. **p<0.01 ****p<0.0001 by one-way ANOVA.
Figure 2
Figure 2. RNA-seq analysis of live-sorted phagocyte subsets from lungs of Mtb-infected mice reveals evidence of deficient lysosome biogenesis in MNC1.
C57BL/6 mice were infected with Mtb H37Rv-mCherry by low dose aerosol. After 28 days, 4 pools of lung cells from 5 infected mice per pool were prepared and stained, and 10,000 live cells from each subset in each of the 4 pools were sorted directly into RNA later and processed for bulk RNA sequencing. a t-stochastic neighbor embedding (t-sne) plot showing distinct clusters of four myeloid cell types based on RNA sequencing on cells sorted from lungs of Mtb H37Rv-mCherry infected mice. Within a clustered subset there is substantial overlap between Mtb infected and bystander cells after exclusion of one infected MNC1 outlier sample. b Heatmap showing separation of four distinct cell types based on Z-scores from variance stabilized read counts for lineage markers. The color coding of the cell types shown at the bottom correspond to the colors in (a). c Dot plot showing 7 of 18 KEGG pathways that differ significantly with an enrichment ratio greater than 0.04 for AM, MNC2, neutrophils, combined analysis (AM, MNC2, neutrophils) and MNC1. The color represents the adjusted p values, the graph is ordered by descending values (lowest p value = 1.5 × 10⁻¹⁶ for the lysosome pathway, combined analysis), while the dot size is proportional to the gene count. d Heatmap of the Z-scores from variance stabilized read counts for significantly differentially expressed genes of KEGG lysosome pathway shows separation of MNC1 from AM, MNC2, and neutrophils.
Figure 3
Figure 3. MNC1 cells are deficient in lysosomal cathepsin proteolytic activities.
C57BL/6 mice were infected by aerosol with ~100 Mtb H37Rv-ZsGreen or H37Rv-mCherry. At 28 dpi, mouse lungs were harvested for flow cytometry analysis, live cell sorting, and fluorogenic cathepsin (MagicRed®) assays. a-b Representative histograms and MFI of the fluorescent product of CTSB activity for AM and MNC1. Lung cells were isolated from mice infected with H37Rv-ZsGreen (28 dpi), then incubated with MagicRed® CTSB substrate for 30 min, and stained with antibodies for discrimination of cell subsets, followed by flow cytometry analysis. c CTSB activities in AM and MNC1 sorted from mice infected with H37Rv-mCherry for 28 days, analyzed by fluorescence microscopy. Live-sorted cells from each cell subset were treated with the fluorogenic CTSB substrate in the absence or presence of Bafilomycin A1 (BafA, 100 nM) for 1 h. Cells were fixed and analyzed by confocal microscopy. Scale bars, 10 μm. d Quantification of fluorogenic CTSB product MFI per cell from the left panel in (c). >100 cells per subset were analyzed using ImageJ. e Pan-cathepsin activities in AM and MNC1 sorted from lungs of mice infected with H37Rv-mCherry (28 dpi). Sorted cells were treated with a pool of MagicRed® fluorogenic cathepsin substrates (CTSB+CTSK+CTSL) in the absence or presence of 100 nM BafA for 1 h. Cells were fixed and analyzed by fluorescence microscopy. Scale bars, 10 μm. f Quantification of Pan-cathepsin product MFI per cell from the left panel of (e). >100 cells per subset were analyzed using ImageJ. ****p<0.0001 by unpaired Student’s t test. Results are presented as mean ± SD, representative of 2–3 independent experiments.
Figure 4
Figure 4. MNC1 cells exhibit defective lysosome acidification.
C57BL/6 mice were infected by aerosol with ~100 Mtb H37Rv-ZsGreen or H37Rv-mCherry. At 28 dpi, mouse lungs were harvested for cresyl violet staining and flow cytometry analysis or live cell sorting, and fluorescence microscopy. a Heatmap of the Z-scores from variance stabilized read counts for differentially expressed vacuolar proton ATPase (V-ATPase) subunit genes in AM vs MNC1. “_pos” indicates sorted cells containing Mtb; “_neg” indicates bystander cells that did not contain bacteria. b Representative histograms and MFI of ATP6V1B2 protein immunostaining by flow cytometry of fixed and permeabilized AM and MNC1 from mice infected with H37Rv-ZsGreen (28 dpi). c Immunofluorescence analysis of four V-ATPase subunits in AM and MNC1 sorted from H37Rv-mCherry-infected mice (28 dpi). Representative images were taken by confocal microscopy. Scale bars, 10 μm. Quantification of V-ATPase subunit MFI per cell from >100 cells per subset was done using ImageJ. d Cresyl violet assay of lysosome acidification in AM and MNC1 sorted from lungs of mice infected with H37Rv-mCherry (28 dpi). Sorted cells were treated with 5 μM cresyl violet in the absence or presence of BafA (100 nM) and NH4Cl (10 mM) for 30 min. Cells were fixed and analyzed by confocal microscopy. Scale bars, 10 μm. e Quantification of cresyl violet MFI per cell for the left panel in (d) using ImageJ (>100 cells of each type). f ATP6V0D2 and SiglecF staining of lung sections from mice infected with H37Rv-mCherry (28 dpi). Scale bar, 20 μm. Green arrow indicates SiglecF+ AM. ****p<0.0001 by unpaired Student’s t test. Data are presented as mean ± SD, representative of 2–3 independent experiments.
Figure 5
Figure 5. MNC1 are deficient in lysosomal cathepsin B and LAMP1 protein content.
C57BL/6 mice were infected by aerosol with ~100 Mtb H37Rv-ZsGreen or H37Rv-mCherry. At 28 dpi, mouse lungs were harvested for flow cytometry analysis, live cell sorting, and immunofluorescence staining. a Immunofluorescence analysis of CTSB protein in AM and MNC1 sorted from H37Rv-mCherry-infected mice (28 dpi). Representative images were taken by confocal microscopy. Scale bars, 10 μm. b Quantification of CTSB protein immunostaining MFI per cell for (a), >100 cells per subset were analyzed using ImageJ. c Immunofluorescence analysis of LAMP1 in AM and MNC1 sorted from H37Rv-mCherry-infected mice (28 dpi). Representative images were taken by confocal microscopy. Scale bars, 10 μm. d Quantification of LAMP1 MFI per cell for (c), >100 cells per subset were analyzed using ImageJ. e Representative histograms and MFI of intracellular LAMP1 analyzed by flow cytometry for AM and MNC1 from mice infected with Mtb H37Rv-ZsGreen (28 dpi). f-g LAMP1, CTSB and SiglecF staining of lung sections prepared from mice infected with H37Rv-mCherry (28 dpi). Scale bars, 20 μm. Green arrow indicating SiglecF+ AM. ****p<0.0001 by unpaired Student’s t test. Results are presented as mean ± SD, representative of 2–3 independent experiments.
Figure 6
Figure 6. TFEB in MNC1 is predominantly extranuclear.
C57BL/6 mice were infected with by aerosol with ~100 Mtb H37Rv-mCherry. At 28 dpi, mouse lungs were harvested for live cell sorting for RNA-seq analysis, and immunofluorescence staining. a RNA-seq data evidence that MNC1 express lower levels of Tfeb mRNA than do AM (28 dpi). b AM have more nuclear TFEB than MNC1. Cells were isolated and sorted from lungs of mice infected with H37Rv-mCherry (28 dpi). Anti-TFEB antibody was used for detecting TFEB in sorted cells of each subset. Representative images were taken by confocal microscopy. Scale bars, 10 μm. c-d Quantification of total TFEB MFI (c) and nuclear TFEB MFI (d) per cell in (b) from >100 cells of each subset using ImageJ. e TFEB and SiglecF staining of lung sections from mice infected with Mtb H37Rv-mCherry (28 dpi). Scale bar, 20 μm. Green arrow heads indicate SiglecF+ AM. f A model of that Mtb restriction or survival depending on the functional lysosome abundance in distinct lung mononuclear cell subsets during chronic infection. ****p<0.0001 by unpaired Student’s t test. Data: mean ± SD, representative of 2–3 independent experiments.
Figure 7
Figure 7. c-Abl inhibitors activate TFEB, enhance lysosome biogenesis, and improve control of intracellular Mtb in cultured primary macrophages.
a Torin1 (mTOR inhibitor) and two c-Abl kinase inhibitors (imatinib and nilotinib) increase nuclear translocation of TFEB. BMDM were treated with DMSO or the indicated small molecules for 4 h. Then, cells were fixed and stained with an anti-TFEB antibody. Scale bar, 20 μm. b Quantification of nuclear TFEB MFI per cell from >70 cells for each condition in (a) using ImageJ. c Imatinib and nilotinib increase lysosome gene expression. qPCR results of lysosome genes for BMDM treated with DMSO or the indicated small molecules for 24 h. d BMDM were transfected with the designated siRNA (20 nM) for 48 h, then treated with nilotinib (5 μM) for 18 h. The mRNA levels of lysosome genes were detected by qPCR. siNT: non-targeting siRNA control. e Histograms and MFI of LAMP1 and ATP6V1B2 for uninfected BMDM treated with small molecules for 24 h. f Histograms and MFI of cresyl violet for uninfected BMDM treated with small molecules for 24 h or 72 h. g Imatinib and nilotinib induce cathepsin B enzymatic activity. Histograms and MFI of fluorogenic cathepsin B product for H37Rv-infected BMDM treated with inhibitors for 72 h. h MFI of fluorogenic cathepsin B product in siRNA transfected BMDM. i Imatinib and nilotinib enhance lysosome acidification. BMDM were infected with H37Rv-ZsGreen (MOI=2), then treated with DMSO, imatinib (10 μM), or nilotinib (5 μM). BMDM were stained with DAPI and lysotracker at 24 hpi. Scale bar, 10 μm. j Imatinib and nilotinib enhance Mtb phagolysosome maturation in cultured primary macrophages. Quantification of Mtb co-localizing with lysotracker for (i) from >20 images per condition using JACoP in ImageJ. k Imatinib and nilotinib enhance control of Mtb in primary macrophages. BMDM were infected with H37Rv at MOI=1, then treated with DMSO or indicated small molecules for 4 days. Cells were then lysed and plated for CFU assay. l siRNA-transfected BMDM were infected with Mtb H37Rv (MOI=1) and then treated with nilotinib (2 μM) for 4d. Viable intracellular bacteria were quantitated by CFU assay. Results are presented as mean ± SD, n=3–4 replicates, representative of 2–3 independent experiments. **p<0.01, ***p<0.001, ****p<0.0001 by multiple unpaired Student’s t test (c), or unpaired Student’s t test (b, d, e-i).
Figure 8
Figure 8. Nilotinib treatment of Mtb-infected mice activates lysosome functions of lung myeloid subsets and reduces lung bacterial burdens.
a Experimental protocol for treatment of Mtb infected C57BL/6 mice. Mice infected with Mtb H37Rv-ZsGreen were treated with vehicle or nilotinib (20 mg/kg/day) intraperitoneally, 5 days/week, for a total of 15 doses beginning at 7 dpi and ending at 27 dpi. At 28 dpi, mice were euthanized, and lungs were harvested for the assays shown. b Nilotinib treatment of mice decreases overall Mtb lung bacterial burdens (28 dpi). c Nilotinib treatment of Mtb-infected mice increases expression of lysosome genes in lungs (qPCR analysis). Gapdh was used as a control. d Nilotinib treatment of Mtb-infected mice increases LAMP1 expression in recruited lung phagocyte subsets; flow cytometry quantitation of intracellular LAMP1 MFI in lung subsets from mice infected with H37Rv-ZsGreen treated with vehicle or nilotinib (28 dpi). e Nilotinib treatment of Mtb-infected mice increases lysosomal V-ATPase subunit ATP6V1B2 expression in recruited lung phagocyte subsets; flow cytometry quantitation of intracellular ATP6V1B2 MFI in lung subsets from mice infected with H37Rv-ZsGreen treated with vehicle or nilotinib (28 dpi). f Nilotinib treatment of Mtb-infected mice increases lysosomal acidification. Cresyl violet MFI quantitated by flow cytometry for lung subsets from H37Rv-ZsGreen-infected mice treated with vehicle or nilotinib (28 dpi). g Nilotinib treatment of Mtb-infected mice increases lysosomal cathepsin B activity in recruited phagocytes, but not resident (alveolar) macrophages. MFI of fluorogenic MagicRed® CTSB product in lung subsets from mice treated with vehicle or nilotinib (28 dpi) quantitated by flow cytometry. Results are presented as mean ± SD, n=4–8, representative of 2 independent experiments. *p<0.05, **p<0.01, ***p<0.001, by unpaired Student’s t test (b) or multiple unpaired Student’s t test (c-g).

References

    1. Ernst JD. Mechanisms of M. tuberculosis Immune Evasion as Challenges to TB Vaccine Design. Cell Host Microbe 24, 34–42 (2018). - PMC - PubMed
    1. Upadhyay S, Mittal E, Philips JA. Tuberculosis and the art of macrophage manipulation. Pathogens and disease 76, (2018). - PMC - PubMed
    1. Dartois VA, Rubin EJ. Anti-tuberculosis treatment strategies and drug development: challenges and priorities. Nat Rev Microbiol 20, 685–701 (2022). - PMC - PubMed
    1. Cegielski JP, Nahid P, Sotgiu G. The continued hunt for the elusive standard short regimen for treatment of multidrug-resistant tuberculosis. Eur Respir J 55, (2020). - PubMed
    1. Nahid P, et al. Treatment of Drug-Resistant Tuberculosis. An Official ATS/CDC/ERS/IDSA Clinical Practice Guideline. Am J Respir Crit Care Med 200, e93–e142 (2019). - PMC - PubMed

Publication types