[Preprint]. 2023 May 29:rs.3.rs-2925426.
doi: 10.21203/rs.3.rs-2925426/v1.

Proposal of a new genomic framework for categorization of pediatric acute myeloid leukemia associated with prognosis

Affiliations

Proposal of a new genomic framework for categorization of pediatric acute myeloid leukemia associated with prognosis

Masayuki Umeda et al. Res Sq. .

Update in

  • A new genomic framework to categorize pediatric acute myeloid leukemia.
    Umeda M, Ma J, Westover T, Ni Y, Song G, Maciaszek JL, Rusch M, Rahbarinia D, Foy S, Huang BJ, Walsh MP, Kumar P, Liu Y, Yang W, Fan Y, Wu G, Baker SD, Ma X, Wang L, Alonzo TA, Rubnitz JE, Pounds S, Klco JM. Umeda M, et al. Nat Genet. 2024 Feb;56(2):281-293. doi: 10.1038/s41588-023-01640-3. Epub 2024 Jan 11. Nat Genet. 2024. PMID: 38212634 Free PMC article.

Abstract

Recent studies on pediatric acute myeloid leukemia (pAML) have revealed pediatric-specific driver alterations, many of which are underrepresented in the current classification schemas. To comprehensively define the genomic landscape of pAML, we systematically categorized 895 pAML into 23 molecular categories that are mutually distinct from one another, including new entities such as UBTF or BCL11B, covering 91.4% of the cohort. These molecular categories were associated with unique expression profiles and mutational patterns. For instance, molecular categories characterized by specific HOXA or HOXB expression signatures showed distinct mutation patterns of RAS pathway genes, FLT3, or WT1, suggesting shared biological mechanisms. We show that molecular categories were strongly associated with clinical outcomes using two independent cohorts, leading to the establishment of a prognostic framework for pAML based on molecular categories and minimal residual disease. Together, this comprehensive diagnostic and prognostic framework forms the basis for future classification of pAML and treatment strategies.


Conflict of interest statement

Additional Declarations: There is NO Competing Interest.

Figures
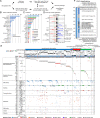
Figure 1:
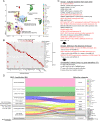
Figure 1:. Comprehensive genetic characterization of pediatric acute myeloid leukemia (pAML)
A. Study cohort of pediatric AML (n=895) and study design B. Recurrent pathogenic or likely pathogenic in-frame fusions (blue) and structural variants (SV: gray) detected in the entire cohort. Fusions included only in-frame fusions, and SVs included out-of-frame fusions resulting loss of the C-terminus of the protein and alterations detected from WGS data using CREST. C. Recurrent pathogenic or likely pathogenic somatic mutations. Colors represent types of mutations. Bars in Fig.1B–C represent the total number of alterations in the cohort. D. Results of GISTIC analysis for focal chromosomal events (shorter than 90% of the chromosome arm). The left panel shows the enrichment of focal gains, and the right panel shows the enrichment of focal loses. Green lines show a significance threshold for q values (0.25). Representative genes in enriched regions are highlighted. E. The genomic landscape and the WHO classification of pAML. Representative genes from GRIN analysis or defining alterations are shown. F. Summary of the WHO classification of the entire cohort.
Figure 2:
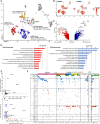
Figure 2:. Molecular categories defined by mutually exclusive gene alterations
A. UMAP plot of the entire pAML cohort (n=895) and cord blood CD34+ cells (normal controls: n=5) using top 320 variable genes. The colors of each dot denote the molecular categories of the samples. Representative category names are shown, and large clusters are highlighted in circles. B. A heatmap showing frequencies of defining gene alterations represented by the color. Statistical significance was assessed by two-sided Fisher’s exact test to calculate p values of co-occurrence, followed by the Benjamini-Hochberg adjustment for multiple testing to calculate q values (*P<0.05, **q<0.05). C. Definition of molecular categories and diagnostic flow. Molecular categories not defined in WHO5th are highlighted in red. D. A ribbon plot showing the association between WHO classification and molecular categories. Colors represent molecular categories of samples
Figure 3:
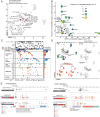
Figure 3:. Clinical and molecular profiles of molecular categories
A. Clinical background of molecular categories. Upper row. Violin plots showing age distribution within each molecular category. Large dots and bars represent the median and the range of 2.5~97.5 percentiles, respectively. Small dots represent individual patients’ ages. Bottom row. Frequency of FAB and karyotype in individual categories. B. Mutational heatmap showing mutation frequencies in each molecular category. The color of each panel represents the frequency of a mutation in each molecular category, and the statistical significance was assessed by two-sided Fisher’s exact test to calculate p values of co-occurrence followed by the Benjamini-Hochberg adjustment for multiple testing to calculate q values (*P<0.05, **q<0.05 after the adjustment). Bars on the top panel show the frequency of mutations in the entire cohort, and the colors represent mutation types. Molecular categories are clustered according to Ward clustering using the Euclidean distance of the frequency matrix. Genes are grouped according to the functional annotations. C. A heatmap showing normalized enrichment scores (NES) and false discovery rates (FDR) of gene set enrichment analysis (GSEA) of each molecular category. Colors denote NES, and asterisks show FDR (*FDR<0.05, **FDR<0.01, ***FDR<0.001) D. Violin plots showing cellular hierarchy scores in each molecular category inferred by CIBERSORT. Lines of the box represent 25% quantile, median, and 75% quantile. The upper whisker represents the higher value of maxima or 1.5 × interquartile range (IQR), and the lower whisker represents the lower value of minima or 1.5 × interquartile range (IQR). Dots show outliers. LSPC stands for leukemic stem and progenitor cells.
Figure 4:
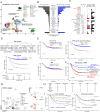
Figure 4:. Categories demarcated by HOXA and HOXB cluster expression
A. UMAP plot showing groups of molecular categories based on UMAP clustering and HOX cluster gene expression profiles. B. HOXA9 and HOXB5 expression on UMAP plot. The dot colors represent the relative expression of the genes. C. A volcano plot showing differentially expressed genes (DEG) between HOXA and HOXB groups. Genes with absolute fold change > 2 and FDR < 0.05 are considered DEGs. Representative gene names are shown. D. GO term analyses of genes with significantly high expression in each HOX group by DAVID. Bars represent logged FDR. E. Plots showing results of GRIN analyses in HOXA group (horizontal axis) and HOXB group (vertical axis). Genes with FDR<0.1 in either HOXA or HOXB groups are shown. Red or blue dots show genes enriched only in either HOXA or HOXB groups, respectively. The dotted lines represent thresholds for statistical significance (FDR<0.05). F. A mutational heatmap comparing patterns between HOXA and HOXB groups. Colors represent mutation types, and molecular categories are annotated on the top. Bar plots on the right show frequencies of mutations in HOXA and HOXB groups. Statistical significance of GRIN analysis in HOXA and HOXB groups (*FDR<0.05) and two-sided Fisher’s exact test between HOXA and HOXB groups (*P<0.05, **q<0.05 after the Benjamini-Hochberg adjustment) are also shown. GRIN results for FLT3 are for the entire gene, while Fisher’s tests were performed separately for ITD, TKD, and non-TKD mutations.
Figure 5:
Figure 5:. Characterization of cases without category-defining alterations
A. UMAP plot showing cases without category-defining alterations. Red dots represent cases with rare recurrent gene alterations, blue dots represent cases for which no pathogenic alteration was found, and black dots represent cases with at least one gene alteration not defining the phenotype. B. A plot showing the FDR of GRIN analysis for the Unclassified category (horizontal axis) and relative enrichment of the alteration in the Unclassified category (vertical axis). The dot sizes and colors denote the Unclassified category’s frequency, which included fusions, mutations, copy number loss and gain, and copy-neutral heterozygosity. C. A mutational heatmap of the Unclassified cases, including complex karyotypes and monosomy 7. Patients’ age, FAB, and UMAP clustering are annotated on the top. Colors represent mutation types. D. UMAP plots showing FAB (top-left), CD34 or CD3D expression (bottom-left), and cases with ETV6 alterations (top-right) and RUNX1 alteration (bottom-right). E. Patterns of alteration in ETV6 (left) and RUNX1 (right). Category-defining fusions are shown in the top row, alterations co-occurring with category-defining alterations in the middle row, and alterations in the Unclassified category in the bottom row. Bars represent a relative fraction of alteration in each group; the colors denote the alteration types.
Figure 6:
Figure 6:. Clinical association of molecular categories
A. UMAP plot of transcriptome data of the AAML1031 cohort (n=1,034) using top340 variable genes. The dot colors denote molecular categories assigned to the samples according to genomic profiling using the same pipeline as this study cohort. Representative category names are shown, and large clusters are highlighted in circles. B. Frequency of molecular categories in the AAML1031 cohort. Asterisks denote the statistical significance of the frequency of each category assessed by two-sided Fisher’s exact test followed by the Benjamini-Hochberg adjustment (*P<0.05, **q<0.05, blue: fewer and black: more in the AAML1031). C. Clinical features of molecular categories showing age at diagnosis (left), FLT3-ITD status (mid), and MRD (minimal residual disease) positivity at the end of induction (right). Molecular category names associated with megakaryocytic phenotypes are highlighted in red. Lines of the box represent 25% quantile, median, and 75% quantile. The upper whisker represents the higher value of maxima or 1.5 × interquartile range (IQR), and the lower whisker represents the lower value of minima or 1.5 × interquartile range (IQR). D. Grouping of molecular categories into Low, Intermediate, and High-risk groups by recursive partitioning (top) and Kaplan-Meier curves of overall survival of patients in each risk group (bottom). E. Kaplan-Meier curves and statistical significance of overall survival of patients with known prognostic factors (FLT3-ITD status: top-left, age: bottom-left, MRD positivity at the end of the induction I: top-right). F. Kaplan-Meier curves of overall survival of patients in six risk strata using risk groups (Low-Intermediate-High) and MRD positivity. G. Distribution of KMT2Ar cases among transcriptional clusters on UMAP plot, colors representing fusion partners (left) and XAGE1A and MECOM expression, colors representing relative expression (right) on UMAP plot. H. The association of fusion partners of KMT2Ar among different clusters. I. Kaplan-Meier curves of overall survival of patients with each fusion (left) and in each cluster (right). For survival curves in D, E, F, and I, statistical significance was assessed by Cox Proportional-Hazards models, and P values are shown in the plot. For the validity of prediction by KMT2Ar fusion partners and clusters in I, c-index scores assessed by bootstrapping were shown below the plots. For I, statistical significance of the enrichment and exclusivity were assessed by two-sided Fisher’s exact test followed by the Benjamini-Hochberg adjustment (*P<0.05, **q<0.05, blue: exclusive, black: enriched).

References

    1. Miles L. A. et al. Single-cell mutation analysis of clonal evolution in myeloid malignancies. Nature 587, 477–482, doi:10.1038/s41586-020-2864-x (2020). - DOI - PMC - PubMed
    1. Cicconi L. & Lo-Coco F. Current management of newly diagnosed acute promyelocytic leukemia. Ann Oncol 27, 1474–1481, doi:10.1093/annonc/mdw171 (2016). - DOI - PubMed
    1. Tenen D. G. Disruption of differentiation in human cancer: AML shows the way. Nat Rev Cancer 3, 89–101, doi:10.1038/nrc989 (2003). - DOI - PubMed
    1. Morita K. et al. Clonal evolution of acute myeloid leukemia revealed by high-throughput single-cell genomics. Nat Commun 11, 5327, doi:10.1038/s41467-020-19119-8 (2020). - DOI - PMC - PubMed
    1. Bolouri H. et al. The molecular landscape of pediatric acute myeloid leukemia reveals recurrent structural alterations and age-specific mutational interactions. Nat Med 24, 103–112, doi:10.1038/nm.4439 (2018). - DOI - PMC - PubMed

Publication types

LinkOut - more resources