[Preprint]. 2024 Nov 4:2023.06.16.545386.
doi: 10.1101/2023.06.16.545386.

CRISPR screens in iPSC-derived neurons reveal principles of tau proteostasis

Affiliations

CRISPR screens in iPSC-derived neurons reveal principles of tau proteostasis

Avi J Samelson et al. bioRxiv. .

Abstract

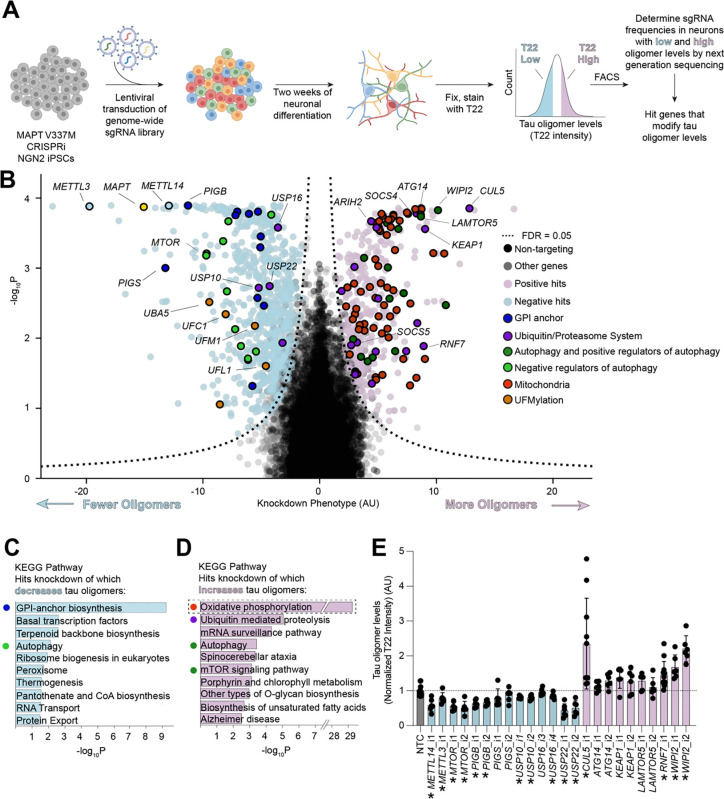
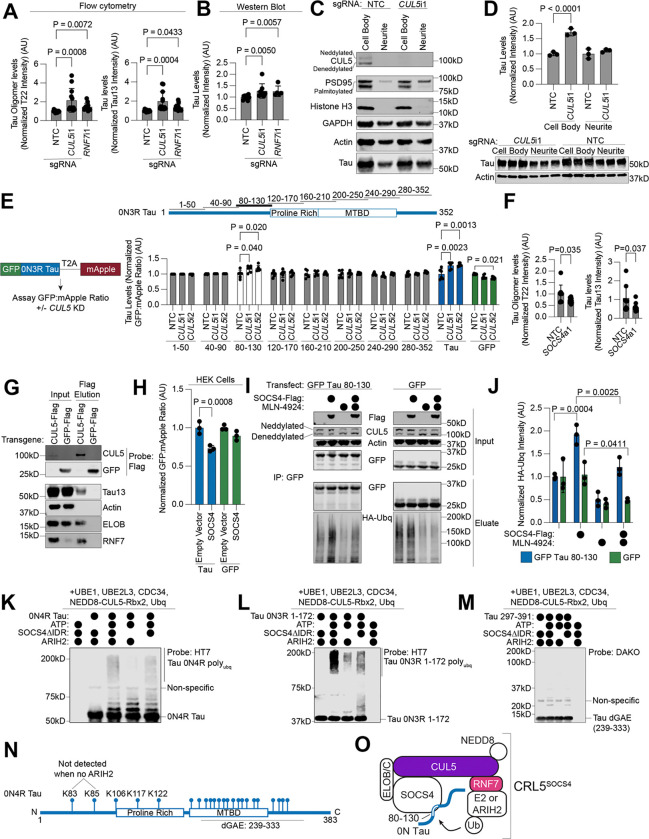
Aggregation of the protein tau defines tauopathies, which include Alzheimer's disease and frontotemporal dementia. Specific neuronal subtypes are selectively vulnerable to tau aggregation and subsequent dysfunction and death, but the underlying mechanisms are unknown. To systematically uncover the cellular factors controlling the accumulation of tau aggregates in human neurons, we conducted a genome-wide CRISPRi-based modifier screen in iPSC-derived neurons. The screen uncovered expected pathways, including autophagy, but also unexpected pathways, including UFMylation and GPI anchor synthesis. We discover that the E3 ubiquitin ligase CUL5SOCS4 is a potent modifier of tau levels in human neurons, ubiquitinates tau, and is a correlated with vulnerability to tauopathies in mouse and human. Disruption of mitochondrial function promotes proteasomal misprocessing of tau, which generates tau proteolytic fragments like those in disease and changes tau aggregation in vitro. These results reveal new principles of tau proteostasis in human neurons and pinpoint potential therapeutic targets for tauopathies.


Conflict of interest statement

DECLARATION OF INTERESTS M. K. is an inventor on US Patent 11,254,933 related to CRISPRi and CRISPRa screening, a co-scientific founder of Montara Therapeutics and serves on the Scientific Advisory Boards of Engine Biosciences, Alector, and Montara Therapeutics, and is an advisor to Modulo Bio and Recursion Therapeutics. The other authors declare no competing interests.

Figures

Figure 1:
Figure 1:. MAPT V337M neurons have higher levels of tau oligomers.
(A) Dot blots (above) and quantification (below) of the PBS-soluble fraction of native neuronal lysates probed for total tau (tau13 antibody, left) or tau oligomers using different conformation-specific antibodies (T22, center left: TTC18, center right; TOC1, right). Neurons were lysed in DPBS and insoluble material was separated by centrifugation. Pellets were sequentially solubilized and then centrifuged in 0.1% Triton X-100 in DPBS and then 0.1% SDS in DPBS. All blots were normalized to actin (below) as a loading control. All samples are the average of six biological replicates except for TOC1, which is the average of four replicates, error bars are ±standard deviation. Blots used for quantitation are in Figure S1. (B) Left, Tau oligomer levels measured using the antibody T22 by flow cytometry in isogenic iPSC-derived neurons with one or two copies of the FTLD-causing MAPT V337M mutation. Intensities were normalized to the average of WT tau neurons (white). Right, Representative histograms are shown. (C) Left, Tau levels measured by flow cytometry using the total tau antibody tau13 in isogenic iPSC-derived neurons with one or two copies of the FTLD-causing MAPT V337M mutation (B). Intensities were normalized to the average of WT tau neurons (white). Right, representative histograms are shown. All samples are the average of twelve biological replicates, error bars are ±standard deviation. Standard one-way ANOVA was used for statistical analysis in (A)-(C).
Figure 2:
Figure 2:. Genome-wide screen for tau oligomers levels in iPSC-derived neurons.
(A) Schematic of screen. MAPT V337M heterozygous iPSCs were transduced with a pooled library of sgRNAs targeting every protein-coding gene. iPSCs were differentiated into excitatory neurons for two weeks, fixed, and stained with antibodies detecting the neuronal marker NeuN and tau oligomers (T22). The thirty percent of NeuN-positive cells with the lowest (blue) and highest (pink) tau oligomer signal were separated by FACS sorting. Genomic DNA was isolated from each population and the sgRNA cassette was sequenced using next-generation sequencing. Comparison of sgRNA frequencies was used to call hit genes. (B) Volcano plot of hit genes from genome-wide screen. Phenotype (normalized log2 ratio of counts in the T22-high versus T22-low populations), is plotted versus the negative log10 of the P-value, calculated with a Mann-Whitney U-test. Positive hits are in pink, and negative in light blue. Quasi-genes composed of random sets of non-targeting controls are in black and non-hit genes are in grey. MAPT is a top hit (yellow). (C,D) KEGG Pathway enrichment analysis uncovered oxidative phosphorylation and overlapping gene sets containing mitochondrial genes as the most significantly enriched term among genes knockdown of which increased tau oligomer levels (dashed box). To reveal additional pathways, a second round of enrichment analysis was performed after removal of mitochondrial genes. Top ten pathways by adjusted p-value are listed for (C) hits knockdown of which decreased tau oligomer levels (light blue) and for (D) hits knockdown of which increased tau oligomer levels (light pink). (E) Validation of select hit genes, labelled in (B), using individually cloned sgRNAs. Mean of six biological replicates is shown. Error bars are ±standard deviation. Bars in light blue were negative hits in the primary screen, and those in pink were positive hits. The asterisks denote sgRNAs with T22 levels significantly different from the non-targeting control, NTC (p <0.05 using a standard one-way ANOVA). sgRNAs METTL14i2 and METTL3i2 were toxic to iPSCs and excluded from this analysis.
Figure 3:
Figure 3:. Secondary screens reveal modifiers specific to tau oligomer levels and MAPT genotype
(A) Schematic of retest strategy. A focused sgRNA library targeting all the hits from the genome-wide screen was screened in MAPT WT and MAPT V337M neurons using a panel of different antibodies. (B) Overlap of hit genes knockdown of which increases tau oligomer levels detected by three different tau oligomer antibodies, T22, TOC1, and M204. Top KEGG Pathways enriched for the 118 hit genes common to all three screens were calculated after removal of mitochondrial genes. (C) Overlap of hit genes knockdown of which decreases tau oligomer levels detected by three different tau oligomer antibodies, T22, TOC1, and M204. Top KEGG Pathways enriched for the hit genes common to all three screens are listed. (D) Comparison of total tau and tau oligomer screens in MAPT V337M neurons by gene score. Non targeting controls are in black and genes are in grey. ETC Complex I genes (red), ER/UFMylation genes (orange), and GPI-anchor genes (blue) were oligomer-specific hits. CUL5 is in purple. mTOR and AMPK signaling genes are in green. (E) Comparison of tau oligomer screens in MAPT WT vs. V377M neurons by gene score. Non targeting controls are in black and genes are in grey. GPI-anchor genes (blue) were V337M-specific, while knockdown of genes involved in mRNA transport (white), especially nuclear pore subunits, strongly decreased tau oligomer levels in WT but not V337M neurons. Knockdown of TCA cycle genes (red) and genes involved in AMPK signaling (green) weakly increased tau oligomers in WT, but not V337M neurons. CUL5 is in purple. (F) Non targeting controls are in black and genes are in grey. Comparison of screens for total tau levels in MAPT V337M versus WT neurons. Total tau levels in MAPT V337M neurons were more sensitive to knockdown of mTOR signaling (green) and GPI anchor genes (blue). Total tau levels in MAPT WT neurons were more sensitive to knockdown of genes involved in RNA degradation (white). CUL5 is in purple.
Figure 4:
Figure 4:. CRL5SOCS4 ubiquitinates tau and controls tau levels.
(A,B) Individual knockdown of CUL5 and RNF7 reveals increases in Tau oligomer and total tau levels by flow cytometry (A) and western blot (B), relative to non-targeting control (NTC). Average of twelve biological replicates for flow cytometry, six biological replicates for Western blot (Western blots in Figure S2A). (C). Mechanical fractionation of neurons into cell body and neurite fractions evaluated by western blot. CUL5 is only detected in the cell body fraction. Only mature, palmitoylated PSD95 is detected in the neurite fraction as expected. (D) CUL5 KD decreases tau levels in the cell body, but not neurite fraction. Quantitation (top) of Western blot data (bottom). Three biological replicates per sample. (E) Schematic of dual-fluorescence reporter for post-translational regulation of tau levels in neurons (left). Levels of each fifty-amino acid segment of tau sequence (schematic, top), tau (blue), and GFP (green) assayed in the presence of CUL5 knockdown or non-targeting control sgRNA (right). Only tau 80–130 (white) recapitulates the CUL5 knockdown sensitivity of full-length tau. Six biological replicates were used per sample. (F) Tau oligomer (left) and total tau levels (right) measured by flow cytometry following overexpression of SOCS4 using CRISPRa, compared to NTC. Average of nine biological replicates. (G) Immunoprecipitation of CUL5-Flag or GFP-flag reveals tau in the CUL5-flag eluate, along with ELOB and RNF7, markers of assembled CRL5 complexes. (H) Over-expression of SOCS4 in HEK cells with the dual-fluorescence reporter shown in (F) decreases tau levels (blue) but not GFP levels (green). Average of three biological replicates is shown. (I) Overexpression of SOCS4 in HEK cells increases the amount of ubiquitinated GFP-Tau 80–130 but not of ubiquitinated GFP. This increase in ubiquitination decreases upon treatment with the neddylation inhibitor, MLN4924. Gels representative of three biological replicates. (J) Quantitation of HA-ubiquitin signal in (I). Tau or GFP samples normalized to empty vector, vehicle treated samples. Three biological replicates. (K-M) in vitro ubiquitination reactions with three different substrates (K) 0N4R tau (L) 0N tau 1–172 (M) 0N4R Tau 239–333, also known as tau dGAE. Gels representative of three technical replicates. (N) Cartoon of ubiquitination sites identified by mass spectrometry of in vitro ubiquitination reactions labelled on equivalent sites on 0N4R tau. Lysines within the region 80–130 are labelled. MTBD, microtubule-binding domain. (O) Model of CRL5SOCS4-dependent ubiquitination of tau. For all applicable subpanels, one-way ANOVA was used for statistical analysis. P-values of >0.05 are not shown. Error bars are ±standard deviation.
Figure 5:
Figure 5:. CUL5 expression is correlated with lower vulnerability to tau aggregation in mice and to neuronal death in human Alzheimer’s Disease (AD).
(A) (Top) Representative immunofluorescence images of CA3 brain region from 10 month-old wild-type (WT) mice and human tau P301S-expressing transgenic mice (PS19), stained with DAPI (nuclear stain), AT8 (anti-phospho-tau antibody), and anti-CUL5 antibody. Scale bar, 50 μm. (Bottom) Representative immunofluorescence images of PS19 CA3 brain region stained as above. Arrow, AT8+ neuron. Arrowhead, AT8- neuron. Scale bar, 50 μm. (B) Quantification of normalized CUL5 immunofluorescence intensity in AT8+ and AT8- neurons in the CA3 brain region in PS19 mice. n=five male animals, 8–22 neurons per group, per animal. Bars represent means. P-value from mixed effects analysis. Error bars are ±standard deviation. (C) Overlap between genes expressed more highly in excitatory neurons in the human entorhinal cortex that are resilient versus vulnerable to AD and genes that increase tau oligomer levels in this study. (D) Correlation of mean expression of genes of known CRL5 components including CUL5 with vulnerability of all cell types in AD. ARIH2, CUL5, SOCS4, ELOB, RNF7 and SPSB3 are all within the top three histogram bins. (E)-(G) Correlation of mean expression of (E) CUL5 (F) ARIH2, and (G) SOCS4 with vulnerability of all brain cell types in AD. (H) Correlation of mean expression and change in expression of genes of known CRL5 components including CUL5 with vulnerability of excitatory (grey) and Somatostatin (Sst, blue) neuronal subtypes in AD. ARIH2 and CUL5 are within the top histogram bin. (I)-(J) Correlation of change in expression of (I) CUL5 and (J) ARIH2 with vulnerability of Sst neuronal subtypes in AD. For E-G and I-J, error bars represent the 95% confidence interval over 1,000 bootstraps. p-value is the Pearson correlation p-value corrected for multiple-hypothesis testing using the Benjamini-Hochberg procedure.
Figure 6:
Figure 6:. Rotenone increases ROS, tau oligomer, and total tau levels and induces a tau 25kD fragment.
(A,B) Rotenone treatment increases levels of tau oligomers (A) and total tau (B) in MAPT V337M neurons, but only total tau levels in MAPT WT neurons in a dose-dependent manner. No significance test was performed. (C) Western blot of rotenone-treated neurons reveals a tau cleavage fragment. (D) Rotenone treatment of neurons results in an equivalent fragment from a GFP-Tau transgene. (E) Traces of averaged intensity from peptides per amino acid derived from mass spectrometry data for full-length tau (black) and rotenone induced fragment (dark red). A sharp decrease in intensity is seen in the rotenone induced fragment gel slice after residue 200, except for one peptide (see Figure S6). Stars represent neo-tryptic termini identified upon digestion with GluC, pinpointing two possible C-termini for the fragment, narrowing the fragment identity to residues 172–200 (2N4R numbering: 230–258). (F) Western blot of cell lysate (top) and undiluted conditioned media (bottom) shows the presence of the 25 kD fragment in the media. (G,H) ELISA signal for (G) NTA and (H) DAKO-based ELISA as a function of rotenone concentration. (I) Neuronal levels of the 25 kD fragment quantified by Western blot as a function of rotenone concentration. (J) ROS levels quantified by CellRox and flow cytometry as a function of rotenone concentration. (K) Treatment with 100μM hydrogen peroxide (left) increases 25 kD fragment formation, while treatment with the antioxidant N-Acetyl-Cysteine at 1μM (middle) decreases fragment formation (quantitation right). If not otherwise shown, rotenone concentration is 200 nM and treatment time is 24 hours. In applicable panels, one-way ANOVA was used for all statistical analysis. Unless otherwise noted, all samples are the average of six biological replicates, error bars are ±standard deviation. P-values >0.05 are not shown.
Figure 7:
Figure 7:. ROS leads to proteasome dysfunction which causes accumulation of the tau 25kD fragment.
(A) Treatment with proteasome inhibitor MG132 at 1 μM decreases levels of the 25kD fragment. (B) Treatment with rotenone decreases proteasome activity (top) but not levels (bottom). (C) Quantitation of (B). (D) Knockdown of the proteasome regulator PSME2 increases levels of the 25 kD fragment (left) Western blot with quantitation. CRISPRa-mediated over-expression of PSME1 or PSME2 decreases fragment levels (right). Full gels in Figure S3P–Q. (E) Expression of a GFP-tau construct in which all methionines have been replaced by leucines (GFP-tauMetless) decreases fragment formation as compared to GFP-tau in neurons. Western blot (left), quantitation of western blot (right). (F-G) Increasing concentrations of 25kD fragment (F) but not BSA (G) increase the final ThT fluorescence of in vitro aggregation reactions of 10 μM 0N4R tau. Representative ThT traces of six technical replicates are shown. (H-J) Negative stain EM images of fibrils aggregated in the absence (H), or presence of 10 μM (I) or 100 μM (J) 25 kD fragment. Note straightening of fibrils in (H) and (J). Average of three biological replicates unless otherwise stated. One-way ANOVA used otherwise stated. Error bars are ±standard deviation.

References

    1. Chang C.W., Shao E., and Mucke L. (2021). Tau: Enabler of diverse brain disorders and target of rapidly evolving therapeutic strategies. Science 371. 10.1126/science.abb8255. - DOI - PMC - PubMed
    1. Wang Y., and Mandelkow E. (2016). Tau in physiology and pathology. Nature reviews. Neuroscience 17, 5–21. 10.1038/nrn.2015.1. - DOI - PubMed
    1. Tracy T.E., and Gan L. (2018). Tau-mediated synaptic and neuronal dysfunction in neurodegenerative disease. Curr Opin Neurobiol 51, 134–138. 10.1016/j.conb.2018.04.027. - DOI - PMC - PubMed
    1. Hutton M., Lendon C.L., Rizzu P., Baker M., Froelich S., Houlden H., Pickering-Brown S., Chakraverty S., Isaacs A., Grover A., et al. (1998). Association of missense and 5’-splice-site mutations in tau with the inherited dementia FTDP-17. Nature 393, 702–705. 10.1038/31508. - DOI - PubMed
    1. Poorkaj P., Grossman M., Steinbart E., Payami H., Sadovnick A., Nochlin D., Tabira T., Trojanowski J.Q., Borson S., Galasko D., et al. (2001). Frequency of tau gene mutations in familial and sporadic cases of non-Alzheimer dementia. Arch Neurol 58, 383–387. 10.1001/archneur.58.3.383. - DOI - PubMed

Publication types