[Preprint]. 2024 May 18:2023.06.02.543490.
doi: 10.1101/2023.06.02.543490.

Dendritic excitations govern back-propagation via a spike-rate accelerometer

Affiliations

Dendritic excitations govern back-propagation via a spike-rate accelerometer

Pojeong Park et al. bioRxiv. .

Update in

Abstract

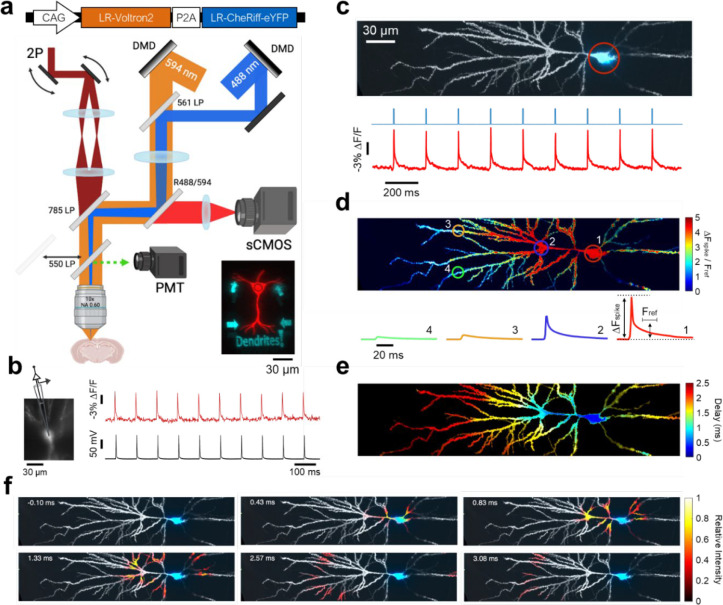
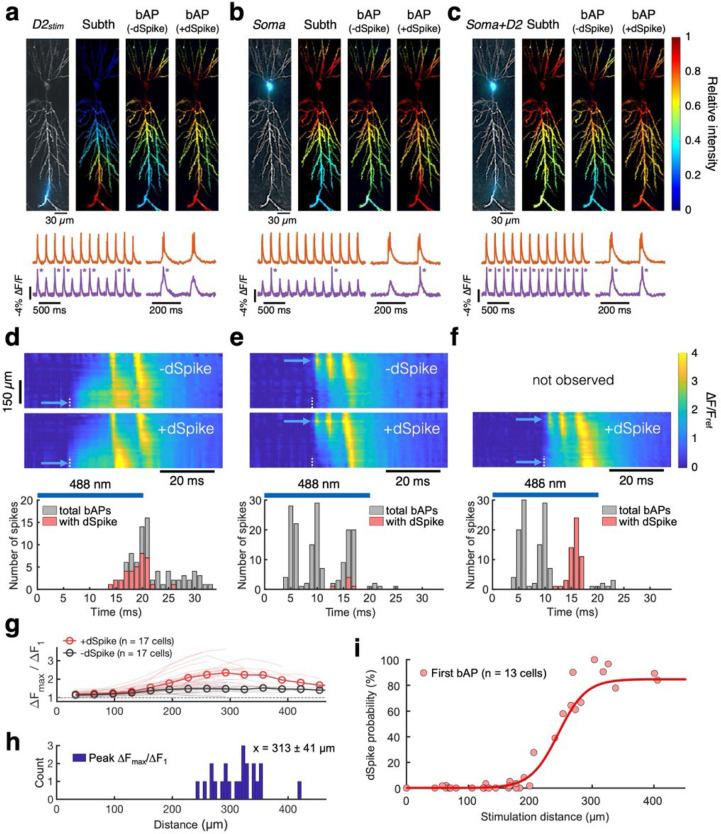
Dendrites on neurons support nonlinear electrical excitations, but the computational significance of these events is not well understood. We developed molecular, optical, and analytical tools to map sub-millisecond voltage dynamics throughout the dendritic trees of CA1 pyramidal neurons under diverse optogenetic and synaptic stimulus patterns, in acute brain slices. We observed history-dependent spike back-propagation in distal dendrites, driven by locally generated Na+ spikes (dSpikes). Dendritic depolarization created a transient window for dSpike propagation, opened by A-type KV channel inactivation, and closed by slow NaV inactivation. Collisions of dSpikes with synaptic inputs triggered calcium channel and N-methyl-D-aspartate receptor (NMDAR)-dependent plateau potentials, with accompanying complex spikes at the soma. This hierarchical ion channel network acts as a spike-rate accelerometer, providing an intuitive picture of how dendritic excitations shape associative plasticity rules.

Keywords: all-optical electrophysiology; dendritic biophysics; dendritic spikes; plateau potentials; spike back-propagation.


Conflict of interest statement

Competing interests The authors declare no competing interests.

Figures

Fig. 1 |
Fig. 1 |. Mapping dendritic voltages with all-optical electrophysiology.
a, Top: genetic construct for co-expression of LR-Voltron2 and LR-CheRiff-eYFP. Bottom: optical system combining two-photon (2P) static structural imaging (dark red), micromirror-patterned dynamic voltage imaging (orange), and micromirror-patterned optogenetic stimulation (blue). DMD, digital micromirror device. Inset: micromirror-patterned red and blue illumination on a test slide. b, Concurrent voltage imaging and whole-cell patch clamp recording at the soma. Sample rates: 1 kHz and 100 kHz, respectively. Spikes evoked by current injection (2 nA for 2 ms at 10 Hz). c, Top: 2P structural image of a CA1 neuron (gray), overlayed with eYFP epifluorescence indicating optogenetic stimulus region (blue; 10 ms duration, 5 Hz). Bottom: optogenetic stimulation (blue) and voltage-dependent fluorescence at the soma (red). d, Top: spike amplitude map from spike-triggered average of 59 well-isolated spikes. Bottom: spike-triggered average voltage traces in the correspondingly numbered circled regions. ΔFspike, peak spike amplitude. Fref, mean amplitude during the reference time (from t = 10–20 ms after spike, Methods). e, Spike delay map. f, Sub-frame interpolation showing details of spike back-propagation (see also Movie 3).
Fig. 2 |
Fig. 2 |. Spatial and temporal maps of dendritic spikes (dSpikes).
a, Example traces at the soma (orange) and a distal dendrite (> 300 μm; purple) showing trials without and with a dSpike (*) in response to stimulation at a proximal dendritic branch (D1stim; 20 ms duration at 5 Hz). b, Distribution of bAP amplitudes at the soma (orange) and at a distal dendrite (> 300 μm; purple). The amplitude in the soma had a unimodal distribution and the amplitude in the dendrites had a bimodal distribution. Black dotted lines indicate threshold between −dSpike vs. +dSpike. c, Counting all bAPs (gray), and bAPs with dSpikes from the same cell (red), as a function of time after optogenetic stimulus onset. Blue bar shows the stimulus timing. d, Left: 2P structural image (gray) overlayed with fluorescence of eYFP (blue) indicating spatial distributions of the optogenetic stimulus. Right: normalized amplitude (ΔF/Fref) map for subthreshold depolarization (stimulus-triggered average from 54 trials). Amplitude heatmaps for the following panels share the same color scale. e, Normalized amplitude (ΔF/Fref) map for back-propagating action potentials (bAPs) without dSpikes (−dSpikes; spike-triggered average from 56 spikes). Right: single-trial example of bAPs without a dSpike, sampled along the red line in (d) at the locations indicated by colored arrows. f, Corresponding plots for bAPs with dSpikes (+dSpikes). Normalized amplitude map, spike-triggered average from 8 spikes. g, Kymographs comparing single-trial instances of bAPs with (+dSpike) and without (−dSpike) a dendritic spike along the red line in (d). The soma is at the top and the distal apical dendrites are at the bottom. Blue arrowhead indicates place and time of stimulus onset. White dotted line indicates time of stimulus onset. h, Amplitude profiles for each bAP along the red line in (d). Events that rise in the distal region indicate dSpikes. Plots were color-coded by the time after stimulus onset.
Fig. 3 |
Fig. 3 |. Distal dendritic depolarization favors dendritic spikes (dSpikes).
a-f, Corresponding plots to those illustrated in Fig. 2 for stimuli at a distal dendrite (a and d, D2stim; 54 trials, 19 −dSpikes, and 37 +dSpikes), soma (b and e, Soma; 54 trials, 161 −dSpikes, and 6 +dSpikes), and both soma and distal dendrite simultaneously (c and f, Soma+D2; 54 trials, 116 −dSpikes, and 54 +dSpikes; all trials evoked at least 1 dSpike in this condition). g, Amplitude ratio of later bAPs to the first bAP (ΔFmax/ΔF1). Data sorted by the presence (+dSpike) vs. absence (−dSpike) of dSpike. Soma or proximal dendritic branch (< 200 μm) was stimulated (n = 22 branches, 17 cells, 15 animals). Mean (open circles), individual stimuli (thin lines). h, Distance from soma to the area showing peak ΔFmax/ΔF1 (x = mean ± s.d.), where ΔF1 is the amplitude of the first spike after stimulus onset and ΔFmax is the amplitude of a subsequent dSpike. i, Probability for the first bAP after stimulus onset to trigger a dSpike, as a function of stimulus distance from soma (n = 35 dendrites, 13 cells, 11 animals). Red line, sigmoidal fit.
Fig. 4 |
Fig. 4 |. Dendritic excitations implement a spike-rate accelerometer.
a, Structural image (gray) overlayed with fluorescence of eYFP (blue) showing the optogenetic stimulus. Kymograph along the red line. Example traces taken from the regions indicated by colored arrows. b, Top: number of bAPs (gray) and bAPs with dSpikes (red), as a function of time after stimulus onset, showing how acceleration of the somatic spike rate evokes a transient burst of dSpikes (n = 43 dendrite stimulus locations, 16 cells, and 13 animals). Bottom: percent of dSpikes among all bAPs. c, Equivalent experiment to (a) using wide-field illumination which covered the soma and apical trunk (blue). d, Amplitude maps of the first 12 bAPs showing two bAP failures, followed by alternating dSpikes and bAP failures. e, Plots showing period-doubling bifurcations (n = 9 cells from 9 animals). Left: bAP frequency as a function of time after stimulation onset. Middle: Normalized bAP amplitude relative to average of the final 5 bAPs. Right: Relationship between amplitudes of successive bAPs, bAPn+1 vs. bAPn showing an alternating motif. f-g, Simulations showing spiking at the soma (orange) and distal dendrites (purple) and the dynamics of A-type KV channels (blue) and NaV channels (red). f, Soma-targeted stimulation opens a transient window for dSpike excitation. g, Wide-field stimulation evokes transient period-doubling bifurcation. NaV channel reserve defined by the slow inactivation gate (fast inactivation and recovery not shown).
Fig. 5 |
Fig. 5 |. Collision of synaptic inputs and bAP-induced dSpikes triggers plateau potentials.
a, Kymographs (ΔF/F) along the apical trunk (red line) showed the effects of (top) optogenetic stimuli targeted to the soma (30 ms duration), (middle) EFS-triggered synaptic inputs (0.1 ms duration), and (bottom) combined optical and electrical stimuli. b, Area under the curve (AUC) for combined stimulus normalized to the sum of AUC for optical and EFS stimuli alone (n = 28 cells from 12 animals). c, Top: Fluorescence in a distal dendrite (> 200 μm from the soma) in response to combinations of optogenetic (30 ms, 3 bAPs) and EFS stimulation at various time offsets (ΔTime). Bottom: Corresponding data using 10 ms optogenetic stimulation (1 bAP). d, AUC for combined stimulus as a function of ΔTime. Data for each cell scaled to the range [0, 1] (n = 8 cells from 7 animals for 30 ms stimulus; n = 5 cells from 4 animals for 10 ms stimulus). Open symbols represent individual data and filled symbols represent mean at each ΔTime. Red lines: exponential fit from −245 to 0 ms; sigmoidal fit from 0 to +245 ms. e, EFS and ramped soma-targeted optogenetic stimulation. Under weak optogenetic stimulus, EFS #1 evoked a plateau potential in the dendrites (purple) with an accompanying complex spike in the soma (orange). Under strong optogenetic stimulus, EFS #2 did not evoke a complex spike or plateau potential. f, AUC for the EFS-evoked event was significantly lower when paired with strong optogenetic stimuli vs. weak stimuli (p = 0.01, n = 7 neurons from 5 animals, paired t-test). g, Repeated EFS under tonic weak optogenetic stimulus. Both EFS stimuli evoked plateau potentials. h, AUC for the first and second EFS-evoked events was similar when paired with tonic weak optogenetic stimuli (p = 0.19, n = 7 neurons from 5 animals, paired t-test). Box plots show median, 25th and 75th percentiles, and extrema.
Fig. 6 |
Fig. 6 |. Contribution of dendritic ion channels to plateau potentials.
a, Plateau potentials were evoked by concurrent optogenetic stimulation to the soma (30 ms) and EFS-triggered synaptic inputs (0.1 ms). Channel blockers: D-AP5 (50 μM, n = 6 cells from 5 animals), TTX (20 nM, n = 4 cells from 3 animals), and Ni2+ (100 μM, n = 4 cells from 4 animals) were compared to the vehicle control (n = 11 cells from 8 animals). Sample traces overlaid with the paired baseline trace measured from the same cell (gray). Fluorescence measured in a distal dendrite (> 200 μm from the soma). b, Quantification of effects in (a). Box plots show median, 25th and 75th percentiles, and extrema. ***p < 0.001 vs. control, one-way ANOVA with Bonferroni’s post hoc test. c, Example traces of a complex spike at the soma (orange) and simultaneously recorded plateau potential in the distal dendrites (purple). Overlaid shading qualitatively indicates dominant contributions of distinct dendritic ion channels. bAP propagation within dendrites is initially limited by A-type KV channel activation. The initial bAPs combine with synaptic depolarization to inactivate A-type KV channels, allowing subsequent bAPs to evoke NaV-based dSpikes. These dSpikes lead to VGCC-dependent calcium spikes, causing prolonged dendritic membrane depolarization (> 20 ms). In the presence of glutamate from presynaptic inputs, this prolonged depolarization efficiently engages NMDARs, resulting in a global plateau potential.

References

    1. Turner R., Meyers D., Richardson T. & Barker J. The site for initiation of action potential discharge over the somatodendritic axis of rat hippocampal CA1 pyramidal neurons. J. Neurosci. 11, 2270–2280 (1991). - PMC - PubMed
    1. Stuart G. J. & Sakmann B. Active propagation of somatic action potentials into neocortical pyramidal cell dendrites. Nature 367, 69–72 (1994). - PubMed
    1. Markram H., Lübke J., Frotscher M. & Sakmann B. Regulation of synaptic efficacy by coincidence of postsynaptic APs and EPSPs. Science 275, 213–215 (1997). - PubMed
    1. Stuart G. J. & Spruston N. Dendritic integration: 60 years of progress. Nat. Neurosci. 18, 1713–1721 (2015). - PubMed
    1. Magee J. C. Dendritic integration of excitatory synaptic input. Nat. Rev. Neurosci. 1, 181–190 (2000). - PubMed

Publication types