[Preprint]. 2024 Mar 13:2023.06.14.544933.
doi: 10.1101/2023.06.14.544933.

Phage predation, disease severity and pathogen genetic diversity in cholera patients

Affiliations

Phage predation, disease severity and pathogen genetic diversity in cholera patients

Naïma Madi et al. bioRxiv. .

Update in

Abstract

Despite an increasingly detailed picture of the molecular mechanisms of phage-bacterial interactions, we lack an understanding of how these interactions evolve and impact disease within patients. Here we report a year-long, nation-wide study of diarrheal disease patients in Bangladesh. Among cholera patients, we quantified Vibrio cholerae (prey) and its virulent phages (predators) using metagenomics and quantitative PCR, while accounting for antibiotic exposure using quantitative mass spectrometry. Virulent phage (ICP1) and antibiotics suppressed V. cholerae to varying degrees and were inversely associated with severe dehydration depending on resistance mechanisms. In the absence of anti-phage defenses, predation was 'effective,' with a high predator:prey ratio that correlated with increased genetic diversity among the prey. In the presence of anti-phage defenses, predation was 'ineffective,' with a lower predator:prey ratio that correlated with increased genetic diversity among the predators. Phage-bacteria coevolution within patients should therefore be considered in the deployment of phage-based therapies and diagnostics.


Conflict of interest statement

Competing interests: Authors declare that they have no competing interests.

Figures

Fig. 1.
Fig. 1.. Dehydration severity is inversely associated with higher ICP1:V. cholerae ratios in stool metagenomes.
(A) Relative abundances of phages and the seven most dominant bacterial species identified with PCA (Fig. S5) in patients with severe, moderate, or mild dehydration; these conventions equate to the World Health Organization (WHO) conventions of ‘Severe’, ‘Some’ and ‘No’ dehydration, respectively. Significant indicator species for severe or mild dehydration are shown in red or blue bold text, respectively (P<0.05 in a permutation test with 9999 iterations as implemented in the indicator species function in R). See Table S3 for indicator species results applied to all 37 species selected in the PCA dimensionality reduction (Fig. S5; Methods). (B) The ICP1:Vc ratio from metagenomics is higher in patients with mild dehydration. P-values are from a Kruskal-Wallis test with Dunn’s post-hoc test, adjusted for multiple tests using the Benjamini-Hochberg (BH) method. Only significant P-values (<0.05) are shown. Only 323 out of 344 samples were included (Vc>0% of metagenomic reads), with 165 from severe, 128 from moderate, and 30 from mild cases. A pseudocount of one was added to the ratio before log transformation. For supporting analyses using qPCR data, see Fig. S4. In (A) and (B) the solid horizontal line is the median and the boxed area is the interquartile range. (C) Redundancy analysis (RDA) showing relationships among the seven most dominant bacterial species identified with PCA (Fig. S5) and explanatory variables: phages (ICP1, ICP2, ICP3), patient metadata: age in years, vomiting state (yes or no), dehydration status (severe, moderate or mild), the location where the sample was collected, and date of sampling; and antibiotic concentration (μg/ml) from quantitative mass spectrometry for azithromycin (AZI), ciprofloxacin (CIP) and doxycycline (DOX). Angles between variables (arrows) reflect their correlations; arrow length is proportional to effect size. Samples (points) are colored by dehydration severity. All displayed variables have a significant effect (P<0.05, permutation test) except for ICP2, ICP3, and doxycycline (Table S4). For the RDA: R2=0.25 and adjusted R2=0.184, permutation test P = 0.001. To improve readability, collection date and location are not shown (see Fig. S6 for these details). Color code in all panels: blue: mild dehydration, orange: moderate, and red: severe.
Fig. 2.
Fig. 2.. Interactions between V. cholerae, phage ICP1, and azithromycin.
Generalized additive models (GAM) results, fit with relative abundance of Vc as a function of antibiotic concentrations (μg/ml) and ICP1 relative abundance in 344 metagenomes. (A) Vc declines in relative abundance with higher abundance of azithromycin (AZI) in μg/ml. (B) The relationship between ICP1 and Vc is affected by AZI concentration (μg/ml); the illustrated AZI concentrations show regular intervals between the minimum (0 μg/ml) and maximum (70 μg/ml) observed values. Both effects of AZI (A) and the ICP1-AZI interaction (B) are significant (Chi-square test, P<0.05). For details on GAM outputs see Table S6. Relative abundances are from metagenomics; see Fig. S10 for equivalent analyses using qPCR data.
Fig. 3.
Fig. 3.. Integrative conjugative elements (ICEs) are associated with lower ICP1:V. cholerae ratios in patient metagenomes.
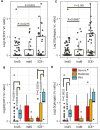
(A) Distribution of ICP1:Vc ratios across patients with different ICE profiles. (B) The same data as (A) binned into boxplots according to dehydration status: mild (blue), moderate (orange) and severe (red). (C) Distribution of phage:Vc ratios, including the sum of all phages (ICP1, ICP2, ICP3). (D) The same data as (C) binned into boxplots according to dehydration status. P-values are from a Kruskal-Wallis test with Dunn’s post-hoc test adjusted with the Benjamini-Hochberg (BH) method. Only P-values < 0.1 are shown. Only samples with appreciable Vc or ICP1 were included (224 samples with Vc>0.5% or phages >0.1% of metagenomic reads), of which 54 samples were ICE-, 26 were ind6+ and 144 were ind5+. The Y-axes were log10 transformed after adding one to the ratios. The solid horizontal line is the median and the boxed area is the interquartile range. Relative abundances are from metagenomics; see Fig. S13 for supporting analyses using qPCR data.
Fig. 4.
Fig. 4.. ICP1 selects for non-synonymous point mutations in the V. cholerae genome in the absence of ICE.
(A) Results of a GLMM modeling high frequency nonsynonymous SNV counts as a function of Vc and ICP1 standardized relative abundances. In the bottom panel, shades of gray indicate Vc relative abundance at the mean or +/− 1 standard deviation (SD) across samples. Both Vc and the interaction between Vc and ICP1 have significant effects (Wald test, P<0.05), the model was fit using 68 samples in which InStrain identified NS mutations at frequency > 10%. (B) GAM results with the mean mutation frequency as a function of the interaction between ICP1, ICE and mutation type (non-synonymous; NS, synonymous; S, or intergenic; I). Significant effects are shown with a star (Chi-square test, P<0.05). The model was fit using 130 samples that passed the post-InStrain filter for SNV quality (Methods). (C) Boxplots of mutation frequency in the presence or absence of ICP1 and/or ICEs. The only significant comparison is indicated with a star (Wilcoxon test, P=0.0094). Boxplots include 130 samples, of which 32 are ICP1+ (ICP1>=0.1% of reads) and 98 are ICP- (ICP1<0.1% of reads). The solid horizontal line is the median and the boxed area is the interquartile range. For supporting analysis using qPCR data, see Fig. S17.
Fig. 5.
Fig. 5.. ICP1 evolution in samples containing ICE ind5.
(A) The number of nonsynonymous (NS) SNVs detected in the ICP1 genome is negatively correlated with the ICP1:Vc ratio in the presence of ind5. (B) The mean frequency of NS SNVs in the ICP1 genome is positively correlated with the ICP1:Vc ratio in the presence of ind5. The X-axes were log10 transformed after adding one to the ratios. The Spearman correlation coefficients and p-values are shown. See Figures S18 and S19 for equivalent plots in ICE- and ind6 samples, and for synonymous and intergenic SNVs.

References

    1. Andrews J. R. et al., Determinants of severe dehydration from diarrheal disease at hospital presentation: Evidence from 22 years of admissions in Bangladesh. PLoS Negl Trop Dis 11, e0005512 (2017). - PMC - PubMed
    1. Ali M., Nelson A. R., Lopez A. L., Sack D. A., Updated global burden of cholera in endemic countries. PLoS Negl Trop Dis 9, e0003832 (2015). - PMC - PubMed
    1. Cholera – Global situation (2023). WHO Report. (available at https://www.who.int/emergencies/disease-outbreak-news/item/2023-DON437).
    1. Islam M. S. et al., Microbiological investigation of diarrhoea epidemics among Rwandan refugees in Zaire. Trans R Soc Trop Med Hyg 89, 506 (1995). - PubMed
    1. Dromigny J. A., Rakoto-Alson O., Rajaonatahina D., Migliani R., Ranjalahy J., Mauclere P., Emergence and rapid spread of tetracycline-resistant Vibrio cholerae strains, Madagascar. Emerg Infect Dis 8, 336–338 (2002). - PMC - PubMed

Publication types