[Preprint]. 2023 Jun 3:2023.06.02.543338.
doi: 10.1101/2023.06.02.543338.

Mapping the genomic landscape of multidrug resistance in Plasmodium falciparum and its impact on parasite fitness

Affiliations

Mapping the genomic landscape of multidrug resistance in Plasmodium falciparum and its impact on parasite fitness

Sachel Mok et al. bioRxiv. .

Update in

Abstract

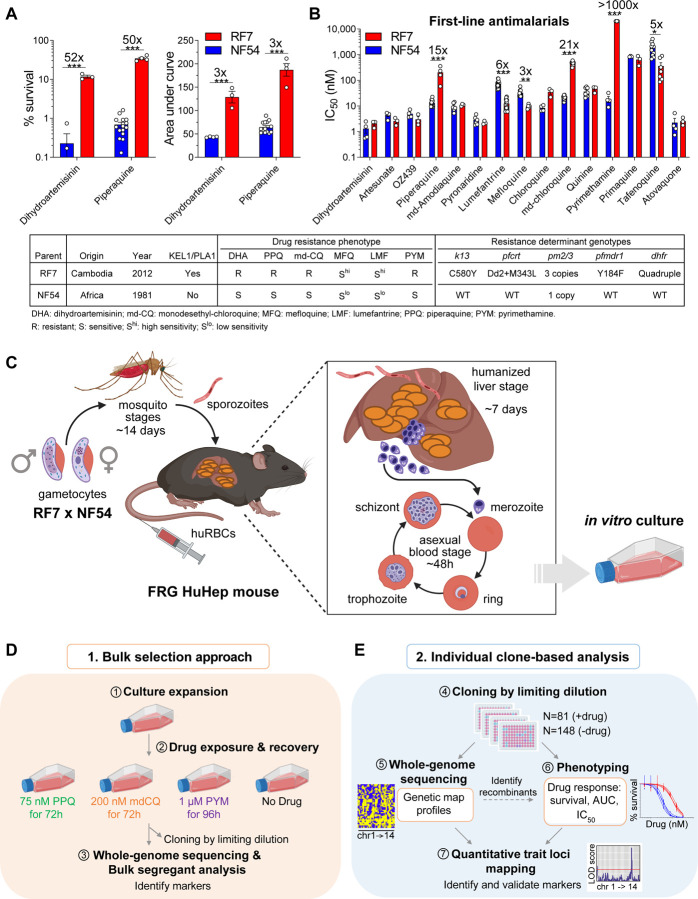
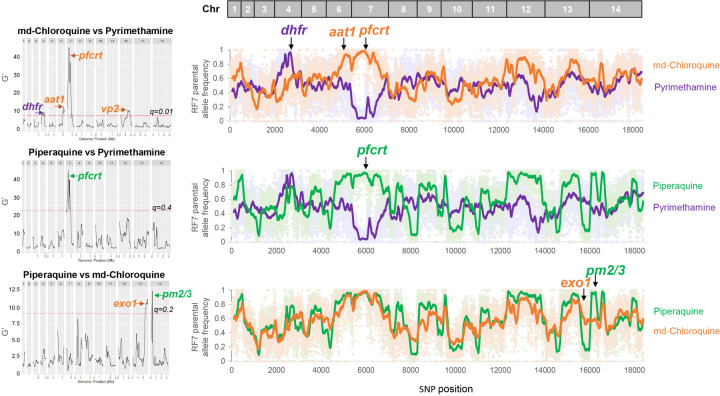
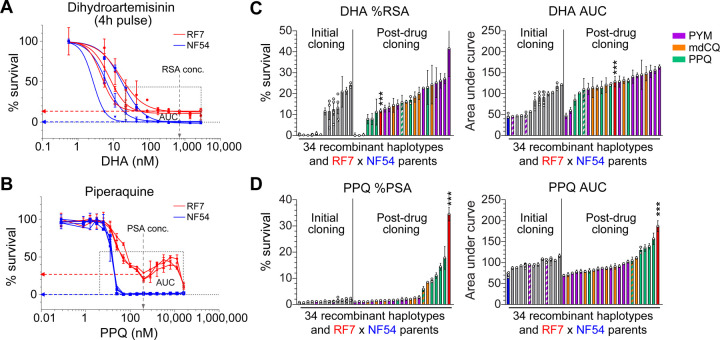
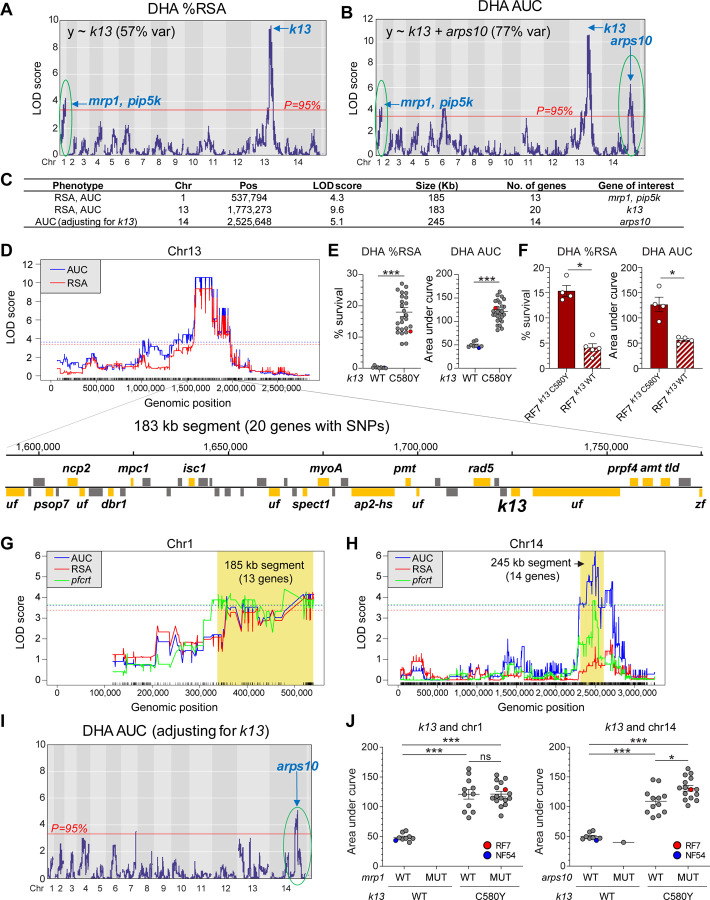
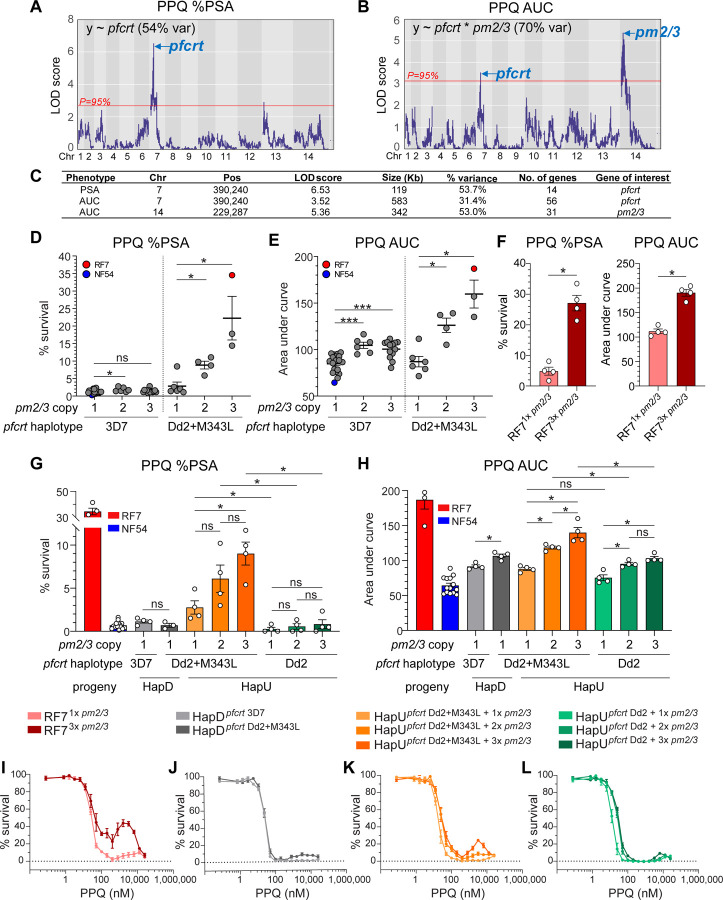
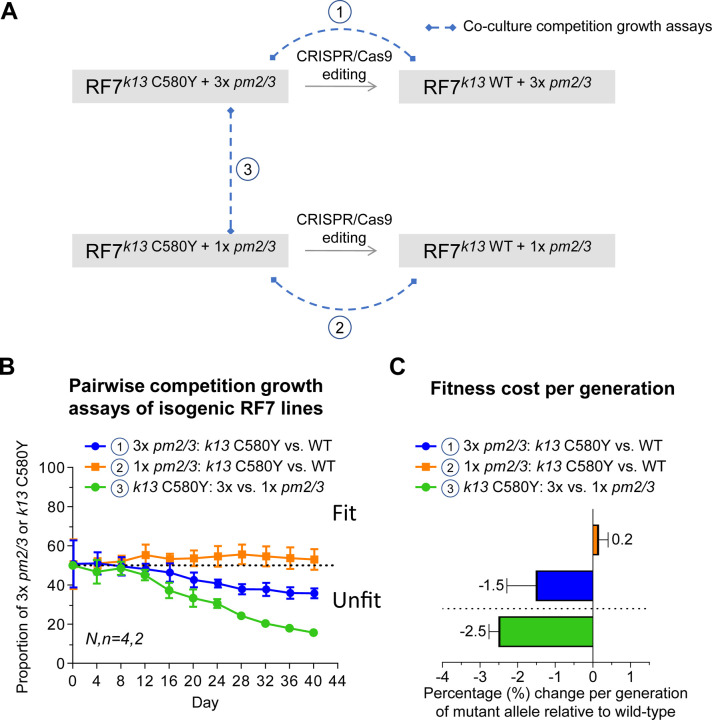
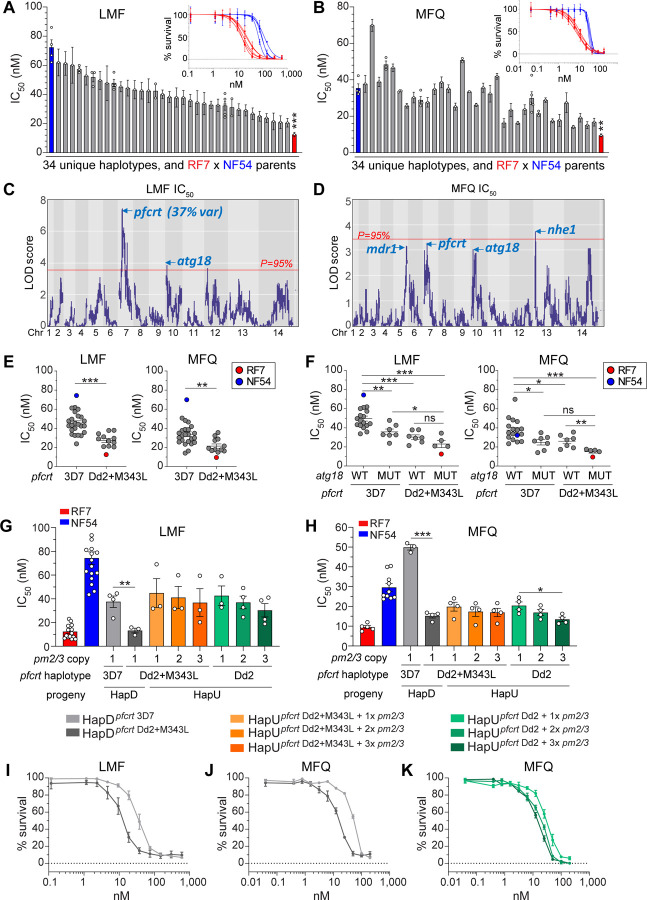
Drug-resistant Plasmodium falciparum parasites have swept across Southeast Asia and now threaten Africa. By implementing a P. falciparum genetic cross using humanized mice, we report the identification of key determinants of resistance to artemisinin (ART) and piperaquine (PPQ) in the dominant Asian KEL1/PLA1 lineage. We mapped k13 as the central mediator of ART resistance and identified secondary markers. Applying bulk segregant analysis, quantitative trait loci mapping and gene editing, our data reveal an epistatic interaction between mutant PfCRT and multicopy plasmepsins 2/3 in mediating high-grade PPQ resistance. Susceptibility and parasite fitness assays implicate PPQ as a driver of selection for KEL1/PLA1 parasites. Mutant PfCRT enhanced susceptibility to lumefantrine, the first-line partner drug in Africa, highlighting a potential benefit of opposing selective pressures with this drug and PPQ. We also identified that the ABCI3 transporter can operate in concert with PfCRT and plasmepsins 2/3 in mediating multigenic resistance to antimalarial agents.


Conflict of interest statement

Competing interests: The authors declare that they have no competing interests.

Figures

Fig 1.
Fig 1.. Antimalarial susceptibilities of the genetic cross parents RF7 × NF54 and the experimental workflow for bulk selection vs. individual clone-based linkage mapping.
(A) Bar plots of % survival derived from the RSA or the PSA and corresponding AUC values for the genetic cross parents RF7 and NF54. In the RSA and PSA, early ring-stage parasites are exposed to the pharmacologically-relevant concentrations of 700 nM DHA for 4h or 200 nM PPQ for 72h, respectively, and survival measured as a percentage of mock-treated cultures. (B) IC50 values for first-line antimalarials of RF7 and NF54. Values represent the means ± SE across 3–17 independent experiments performed with technical duplicates. Statistical significance was determined by unpaired Student’s t-tests, with a Holm-Sidak post-test to correct for multiple comparisons. The IC50 fold shifts are indicated above the bars. **P<0.01, ***P<0.001. Numbers listed above the statistics indicate the fold differences between parental IC50 values. The table summarizes parental phenotypic and genotypic characteristics. WT, wild-type. Mutant genotypes include: Dd2 pfcrt mutations: M74I, N75E, K76T, A220S, Q271E, N326S, I356T, and R371I; Quadruple dhfr mutations: N51I, C59R, S108N, and I164L. (C) Overview of the genetic cross pipeline performed in humanized FRG-NOD mice. (D) Bulk selection approach used for bulk segregant analysis, and (E) Individual clone-based linkage approach, used to identify genetic determinants of drug resistance. Images were created with BioRender.com.
Fig. 2.
Fig. 2.. Bulk segregant analyses of progeny pools pressured with PPQ, mdCQ or PYM.
Shown are the significant genetic loci enriched by each drug in individual drug-drug pairwise comparisons, and their corresponding RF7 parental allele frequencies for the set of “18k” SNPs that differ between the two parents. Regions with a False Discovery Rate (FDR) q-value < 0.01 (mdCQ vs. PYM), 0.4 (PPQ vs. PYM), or 0.2 (PPQ vs. mdCQ), were considered statistically significant QTLs.
Fig. 3.
Fig. 3.. Genetic analysis of recombinant progeny and enrichment of diverse progeny using drug pulses.
(A) Number of selfed progeny vs. genetic recombinants obtained from cloning in the absence of drug or following drug exposure. Distribution of the 34 unique recombinants selected by the various ± drug conditions of PPQ, monodesethyl chloroquine (CQ) or pyrimethamine (PYM). (B) Allelic map for the 34 recombinant progeny grouped by drug-treatment condition. Shown are the parental alleles inherited by each progeny for 14,476 SNPs (after excluding SNPs missing in any of the 36 haplotypes), the genotypes of known resistant markers (k13, pfcrt, pfmdr1, dhfr, dhps and pm2 copy) and the number of derived progeny clones per haplotype sorted by selection condition. (C) Mean RF7 allele frequency inherited by the 34 recombinant progeny clones for each drug-treatment group. (D) Count of KEL1/PLA1/PfPailin haplotypes in progeny clones that were selected by each drug condition. Statistical significance was tested for the drug-selected progeny clones against the “no drug” group by Fisher’s exact test. **P<0.01; ns, not significant. (E) Frequency of RF7 parental allele in progeny clones derived post-treatment with PPQ (N=6), mdCQ (N=7) or PYM (N=12) or in the absence of drug (N=12), showing the skews in allele frequency at specific loci in the genome, as indicated by dashed lines.
Fig. 4.
Fig. 4.. Phenotypic response of parents and progeny to DHA and PPQ.
(A and B) Dose-response curves for RF7 and NF54 parents across a range of DHA (A) and PPQ (B) concentrations (N,n=3,2). The % survival at the RSA and PSA concentrations of 700 nM DHA and 200 nM PPQ for 4h or 72h, respectively, were used to determine DHA and PPQ resistance levels, whereas AUC values were measured as total survival across a range of concentrations (22 nM to 2.8 µM for DHA and 1.6 nM to 25.6 µM for PPQ). (C and D) DHA and PPQ response measured by % RSA and DHA AUC values (C), and % PSA and PPQ AUC values (D), respectively, in the 46 recombinant and three NF54-selfed progeny that were derived from cloning ± drug exposure. Each bar represents the mean % survival or AUC ± SE for a recombinant haplotype and ordered by the parasites’ resistance levels in ascending order independently for each drug index. For certain haplotype groups in which identical clones were obtained, multiple points depict more than one sibling progeny being phenotyped. Significance between the genetic cross parents’ responses were tested by unpaired Student’s t-tests (N,n=3–4,2). ***P<0.001. RSA, ring-stage survival assay. PSA, piperaquine survival assay. AUC, area under the curve.
Fig. 5.
Fig. 5.. QTL mapping of DHA response in progeny identifies k13 as the primary DHA resistance locus.
(A and B) LOD plots for % RSA (A) and AUC levels (B) showing the significant QTLs above the 95% probability threshold (red line). (C) List of QTL segments for % RSA and AUC levels. (D) Genes in QTL segment on chr13, with those having non-synonymous mutations between RF7 and NF54 colored in orange (n=20), or grey where mutations were absent in RF7 and NF54. (E) The % RSA and AUC levels in recombinant progeny segregated by k13 parental allele, C580Y (RF7) and WT (NF54). Significance was tested using Mann-Whitney U. ***P<0.001. (F) DHA response in k13-edited isogenic RF7 clones showed that k13 WT allele reduces % RSA and AUC levels. Bars represent the means ± SE for four independent experiments performed in technical replicates. Significance was tested using Mann-Whitney U. *P<0.05. (G and H) Linkage of chr1 (G) and chr14 (H) segments with pfcrt from QTL analysis using the pfcrt genotype as an outcome. Shown are the significant QTLs above the 95% probability threshold for each analysis. (I) LOD plot for AUC levels after adjusting for k13 as a covariate suggests independent inheritance of chr14 segment with k13 and co-inheritance of chr1 segment with k13. (J) Scatter plot of AUC levels in progeny segregated by k13, mrp1 (chr1) and arps1 (chr14) genotypes showing that the RF7 chr14 segment increases DHA AUC levels. Significance between groups were tested using Mann-Whitney U. *P<0.05, ***P<0.001.
Fig. 6.
Fig. 6.. QTL mapping of PPQ resistance in progeny and response in pfcrt-edited progeny reveals an association of PPQ-R with mutant Dd2+M343L pfcrt and multicopy pm2/3.
(A and B) LOD plots for % PSA (A) and AUC levels (B) showing QTLs detected above the 95% probability threshold (red line). (C) List of QTL segments for % PSA and AUC levels. (D and E) Scatter plot of the % PSA (D) or AUC levels (E) for 34 independent recombinant progeny and parents segregated by pm2/3 copy and pfcrt genotypes. Significant differences in PPQ response between the recombinant groups harboring different pm2/3 copies were tested by Mann-Whitney U. *P<0.05, ***P<0.001. (F) PPQ response in isogenic RF7 clones containing 1 vs. 3 copies of pm2/3 in the Dd2+M343L pfcrt background showing that single copy pm2/3 reduces % PSA and AUC levels. Bars represent the means ± SE for four independent experiments performed in technical replicates. Significance was tested using Mann-Whitney U. *P<0.05. (G) PPQ % PSA and (H) AUC levels in pfcrt-edited HapD progeny (3D7 vs. Dd2+M343L) having single pm2/3 copy and in edited HapU progeny (Dd2 vs. Dd2+M343L) having either 1, 2 or 3 copies of pm2/3. Bars represent the means ± SE for four independent experiments performed in technical replicates. Significance between the isogenic edited progeny lines was tested using Mann-Whitney U. *P<0.05; ns, non-significant. The colored key for parasites lines applies to panels G to L. (I to L) Dose response curve in RF7 clones (I), HapD (J), unedited HapU (K) and edited HapU (L) progeny showing that multicopy pm2/3 and mutant pfcrt are necessary for the PPQ biphasic response. In parallel studies, serum was noted to lower % PSA (fig. S8, B and C). Here, each line depicts the mean % parasite survival ± SE across 3–4 independent experiments performed in technical duplicates.
Fig. 7.
Fig. 7.. Impact of mutant k13 and multicopy pm2/3 on parasite’s asexual fitness.
(A) Experimental design showing the generation of the panel of isogenic RF7 lines used in the co-culture competitive fitness assays. (B) Pairwise competitive growth assays showing the proportion of k13 C580Y or WT alleles in the RF7 line harboring either 3 copies or 1 copy of pm2/3, and the proportion of RF7 lines carrying either 3 or 1 copy of pm2/3 measured at 4 day intervals over 40 days. Values shown are the averaged % from four independent experiments with two technical replicates per pairwise competition assay. (C) Fitness cost per generation showing the relative change in percentage of the k13 and pm2/3 genotypes for each pairwise comparison.
Fig. 8.
Fig. 8.. QTL mapping of LMF and MFQ response identifies multiple peaks including mutant Dd2 pfcrt.
(A) LMF IC50 and (B) MFQ IC50 values of the 34 recombinant haplotypes and two parents. Each bar represents the mean IC50 ± SE for a haplotype group, and haplotypes were ordered based on descending IC50 levels for LMF. For certain haplotype groups in which identical clones were obtained, multiple points depict more than one sibling progeny being phenotyped. Significance between the genetic cross parents’ responses were tested by Mann-Whitney U (N,n=10–14,2 for LMF and N,n=11,2 for MFQ). ***P<0.001. Inset panels depict dose response curves for the RF7 (red) or NF54 (blue) parents across a range of LMF and MFQ concentrations. Each curve represents the mean ± SD for an independent experiment performed in technical duplicates. (C) LOD plots showing significant QTLs for LMF above the 95% probability threshold (red line). (D) LOD plots showing multiple QTLs for MFQ falling just below the 95% probability threshold (red line). (E) LMF IC50 and MFQ IC50 values for the 34 independent recombinant progeny and two parents, grouped by the pfcrt haplotypes. Significant differences in drug response between the pfcrt haplotypes were tested by Mann-Whitney U. **P<0.01, ***P<0.001. (F) LMF IC50 and MFQ IC50 values for the 34 independent recombinant progeny and two parents, grouped by their atg18 genotypes and pfcrt haplotypes. WT: wild-type, MUT: mutant T38I. Significant differences in drug response between the recombinant groups with different atg18 or pfcrt alleles were tested by Mann-Whitney U. *P<0.05, **P<0.01, ***P<0.001. (G) LMF IC50 values in pfcrt-edited HapD progeny (3D7 vs. Dd2+M343L) having single pm2/3 copy and in edited HapU progeny (Dd2 vs. Dd2+M343L) having either 1, 2 or 3 copies of pm2/3. Bars represent the means ± SE for 3–4 independent experiments performed in technical replicates. Significance between the isogenic edited progeny lines were tested using unpaired Student’s t-tests. **P<0.01. (H) MFQ IC50 values in pfcrt-edited HapD progeny (3D7 vs. Dd2+M343L) having single pm2/3 copy and in edited HapU progeny (Dd2 vs. Dd2+M343L) having either 1, 2 or 3 copies of pm2/3. Bars represent the means ± SE for 3–4 independent experiments performed in technical replicates. Significance between the isogenic edited progeny lines were tested using unpaired Student’s t-tests. *P<0.05, ***P<0.001. The colored key for parasites lines applies to panels G to K. (I) LMF and (J) MFQ dose response curve in edited HapD progeny showing that mutant Dd2+M343L pfcrt confers increased tolerance to these drugs. Each line depicts the mean % parasite survival ± SE across 3–4 independent experiments performed in technical duplicates. (K) MFQ dose response curve in edited HapU pfcrt-edited Dd2 progeny with variable pm2/3 copies showing that single pm2/3 copy associates with reduced MFQ sensitivity. Each line depicts the mean % parasite survival ± SE across 4 independent experiments performed in technical duplicates.
Fig. 9.
Fig. 9.. Phenotypic response of genetic cross parents, RF7 × NF54, to preclinical compounds and identification of pfcrt, abci3, pm2/3 in MMV665939 and MMV675939 resistance.
(A) 72h drug susceptibility IC50 values for RF7 x NF54 to a panel of experimental compounds. Values represent the means ± SE across 3–7 independent replicates performed in technical duplicates. Statistical significance was determined by unpaired Student’s t-tests and adjusted by multiple testing and the IC50 fold-shifts are indicated above the bars. ***P<0.001. (B) Dose response curves for parents across a range of MMV665939 and MMV675939 showing a sigmoidal survival curve for MMV665939 and a biphasic response for MMV675939 in the drug-resistant RF7 parent. Each line represents the mean % parasite survival ± SE for one independent experiment performed in technical duplicates. N,n=4,2. (C and D) LOD plots for MMV665939 IC50 (C) and MMV675993 AUC levels (D) showing QTLs identified above the 95% confidence threshold. (E) MMV665939 IC50 and (F) MMV675939 AUC levels for the 34 independent recombinant progeny and two parents, grouped by the pm2/3 copy, pfcrt and abci3 genotypes. Significant differences in drug response between the recombinant groups harboring 1 vs. >1 pm2/3 copies or between pfcrt haplotypes were tested by Mann-Whitney U. *P<0.05, **P<0.01, ***P<0.001. (G) MMV665939 IC50 and (H) MMV675939 AUC levels in pfcrt-edited HapD progeny (3D7 vs. Dd2+M343L) and in edited HapU progeny (Dd2 vs. Dd2+M343L) having either 1, 2 or 3 copies of pm2/3. Values represent the means ± SE across 4 independent experiments performed in technical duplicates. Statistical significance was determined by Mann-Whitney U, *P<0.05. The colored key for parasites lines applies to panels G to K. (I) MMV675939 dose response curves in HapD (3D7 WT) vs. edited HapD (Dd2+M343L) progeny showing that mutant pfcrt is sufficient to generate a biphasic curve on a single copy pm2/3 background. Each line depicts the mean % parasite survival ± SE across 4 independent experiments performed in technical duplicates. (J) MMV675939 dose response curves of HapU (Dd2+M343L) with 1–3 copies of pm2/3 showing that multicopy pm2/3 can augment the biphasic response. Each line depicts the mean % parasite survival ± SE across 4 independent experiments performed in technical duplicates. (K) MMV675939 dose response curves in edited HapU (Dd2 pfcrt) progeny with 1–3 copies of pm2/3 showing that the M343L mutation is not required to generate a biphasic response on a Dd2 pfcrt background. Each line depicts the mean % parasite survival ± SE across 4 independent experiments performed in technical duplicates.

References

    1. World Health Organization, WHO World Malaria Report 2022. https://www.who.int/teams/global-malaria-programme/reports/world-malaria..., (2022).
    1. Plowe C. V., Malaria chemoprevention and drug resistance: a review of the literature and policy implications. Malar J 21, 104 (2022). - PMC - PubMed
    1. Hanboonkunupakarn B., White N. J., Advances and roadblocks in the treatment of malaria. Br J Clin Pharmacol 88, 374–382 (2022). - PMC - PubMed
    1. Dondorp A. M., Nosten F., Yi P., Das D., Phyo A. P., Tarning J., Lwin K. M., Ariey F., Hanpithakpong W., Lee S. J., Ringwald P., Silamut K., Imwong M., Chotivanich K., Lim P., Herdman T., An S. S., Yeung S., Singhasivanon P., Day N. P., Lindegardh N., Socheat D., White N. J., Artemisinin resistance in Plasmodium falciparum malaria. N Engl J Med 361, 455–467 (2009). - PMC - PubMed
    1. Imwong M., Dhorda M., Myo Tun K., Thu A. M., Phyo A. P., Proux S., Suwannasin K., Kunasol C., Srisutham S., Duanguppama J., Vongpromek R., Promnarate C., Saejeng A., Khantikul N., Sugaram R., Thanapongpichat S., Sawangjaroen N., Sutawong K., Han K. T., Htut Y., Linn K., Win A. A., Hlaing T. M., van der Pluijm R. W., Mayxay M., Pongvongsa T., Phommasone K., Tripura R., Peto T. J., von Seidlein L., Nguon C., Lek D., Chan X. H. S., Rekol H., Leang R., Huch C., Kwiatkowski D. P., Miotto O., Ashley E. A., Kyaw M. P., Pukrittayakamee S., Day N. P. J., Dondorp A. M., Smithuis F. M., Nosten F. H., White N. J., Molecular epidemiology of resistance to antimalarial drugs in the Greater Mekong subregion: an observational study. Lancet Infect Dis 20, 1470–1480 (2020). - PMC - PubMed

Publication types