[Preprint]. 2025 Feb 5:2023.06.13.544658.
doi: 10.1101/2023.06.13.544658.

H3.3-G34R Mutation-Mediated Epigenetic Reprogramming Leads to Enhanced Efficacy of Immune Stimulatory Gene Therapy in Diffuse Hemispheric Gliomas

Affiliations

H3.3-G34R Mutation-Mediated Epigenetic Reprogramming Leads to Enhanced Efficacy of Immune Stimulatory Gene Therapy in Diffuse Hemispheric Gliomas

Maria B Garcia-Fabiani et al. bioRxiv. .

Abstract

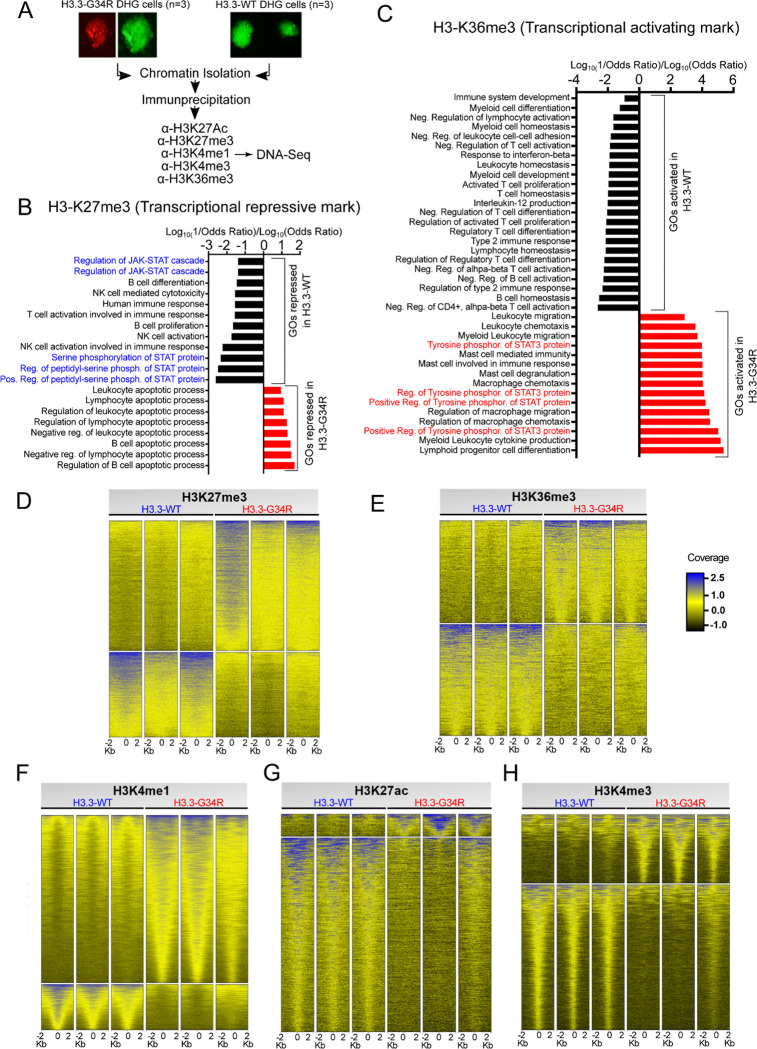
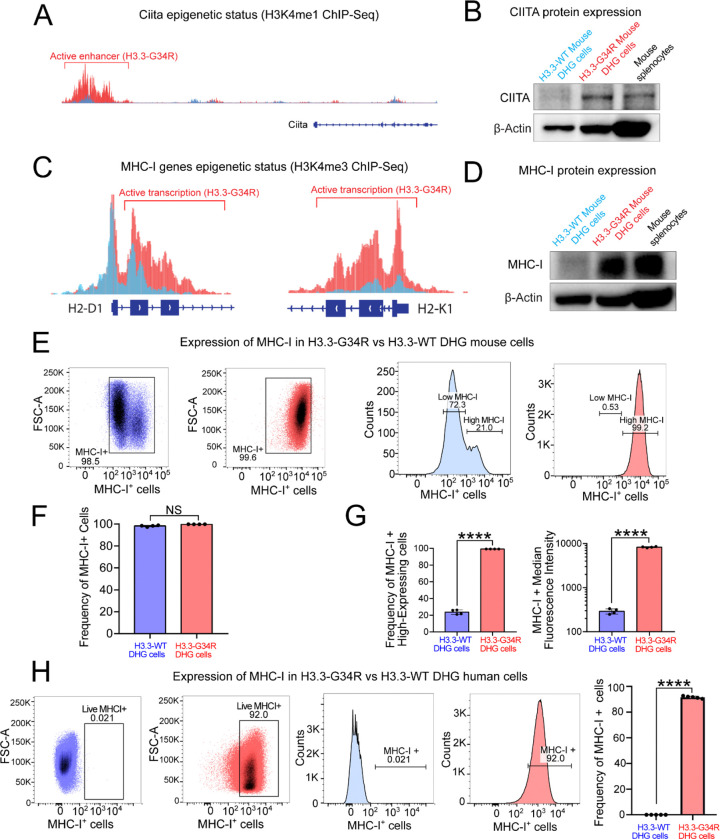
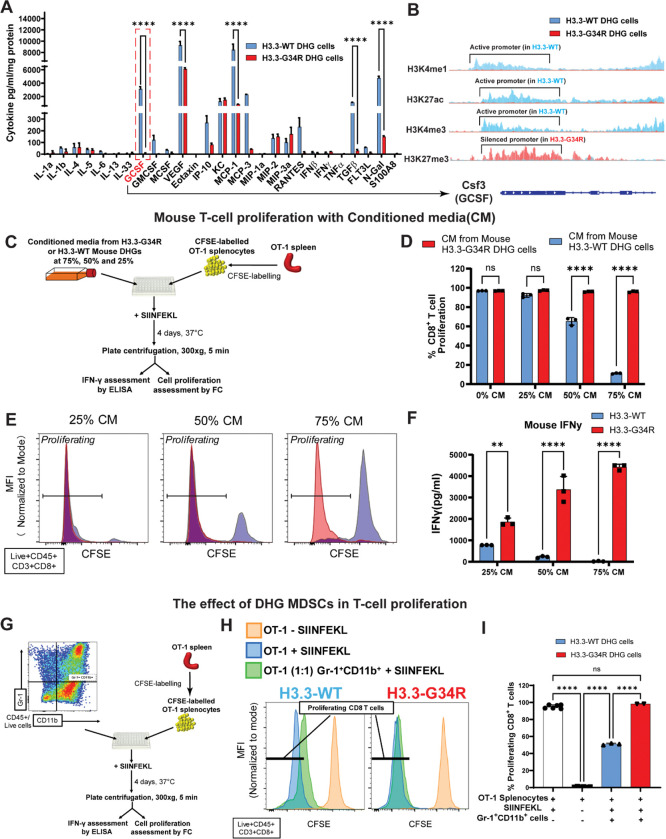
Diffuse hemispheric glioma (DHG), H3 G34-mutant, representing 9-15% of cases, are aggressive Central Nervous System (CNS) tumors with poor prognosis. This study examines the role of epigenetic reprogramming of the immune microenvironment and the response to immune-mediated therapies in G34-mutant DHG. To this end, we utilized human G34-mutant DHG biopsies, primary G34-mutant DHG cultures, and genetically engineered G34-mutant mouse models (GEMMs). Our findings show that the G34 mutation alters histone marks' deposition at promoter and enhancer regions, leading to the activation of the JAK/STAT pathway, which in turn results in an immune-permissive tumor microenvironment. The implementation of Ad-TK/Ad-Flt3L immunostimulatory gene therapy significantly improved median survival, and lead to over 50% long term survivors. Upon tumor rechallenge in the contralateral hemisphere without any additional treatment, the long-term survivors exhibited robust anti-tumor immunity and immunological memory. These results indicate that immune-mediated therapies hold significant potential for clinical translation in treating patients harboring H3.3-G34 mutant DHGs, offering a promising strategy for improving outcomes in this challenging cancer subtype affecting adolescents and young adults (AYA).

Statement of significance: This study uncovers the role of the H3.3-G34 mutation in reprogramming the tumor immune microenvironment in diffuse hemispheric gliomas. Our findings support the implementation of precision medicine informed immunotherapies, aiming at improving enhanced therapeutic outcomes in adolescents and young adults harboring H3.3-G34 mutant DHGs.


Conflict of interest statement

Declaration of Interests The authors declare no potential conflicts of interest.

Figures

Figure 1.
Figure 1.. Transcriptomics analysis of mouse and human DHG.
(A) Volcano plot depicting the transcriptional differences between mouse H3.3-G34R and H3.3-WT DHG tumor cells. (B) Gene set enrichment analysis (GSEA) showing the upregulation of interferon-gamma and adaptive immune pathways in mouse H3.3-G34R versus H3.3-WT DHG tumor cells. (C) Volcano plot depicting the transcriptional differences between H3.3 G34R/V tumors compared to H3.3 WT HGG tumors. (D) Gene set enrichment analysis (GSEA) showing the upregulation of interferon-gamma and immune pathways in H3.3 G34R/V versus H3.3 WT DHG tumors. (E) UMAP embedding of H3.3 G34R/V and WT DHG scRNA-seq. (F) Immune cell percentages from H3.3 G34R/V and WT samples. (G) Immune cell percentages from each individual patient sample.
Figure 2.
Figure 2.. Characterization of the G34R DHG epigenome by ChIP-seq.
(A) Experimental outline for the ChIP-Sequencing analysis. Three biological replicates of H3.3-WT and H3.3-G34R neurospheres (NS) were used to perform the ChIP-Seq. Five marks were analyzed: H3K27ac, H3K27me3, H3K4me1, H3K4me3 and H3K36me3. (B-C) Analysis of differentially enriched peaks for H3K27me3 (B) (transcriptional repression) or H3K36me3 (C) (transcriptional activation) histone marks revealed genes that are linked to distinct functional GO terms. GO enriched in the marks in H3.3-G34R versus H3.3-WT DHG are indicated with red bars and GO enriched in the marks in H3.3-WT versus H3.3-G34R DHG are indicated with black bars. The JAK/STAT related GO epigenetically active in H3.3-G34R cells (as indicated by enrichment of K36me3) are highlighted in red, and the same GO epigenetically downregulated in H3.3-WT cells are highlighted in blue. (D-H) Heat maps showing H3K27me3, H3K36me3, H3K4me1, H3K27ac and H3K4me3 differential peaks ± 2 kilo–base (Kb) pair from the gene center. Each row represents a distinct gene. The blue-to-yellow color gradient indicates high-to-low counts in the corresponding regions.
Figure 3.
Figure 3.. Epigenetic activation of the STAT pathway in G34R DHG.
(A) Diagram depicting IFNγ inducing STAT1 pathway activation. GAS: interferon-gamma activated site; ISRE: interferon-stimulated response element; SXY reg: SXY regulatory module of MHC promoters; RFX: DNA-binding complex. (B) The combination of different histone mark deposition enabled the definition and the identification of chromatin states (CS). The table shows CS changes at specific genomic regions for STAT1 pathway related genes, based on the combination of different histone mark enrichments, considering a fold-change enrichment cut-off > 2 (n=3 biological replicates). TSS=transcription start site. (C) Heatmap illustrates RNA-Seq data of H3.3-WT (n=4) and H3.3-G34R (n=3) tumor cells from SB tumors. (D-E) Occupancy of H3K27Ac and H3K4me3 on the Stat1 gene. (F) Western blot of phospho-STAT1 and STAT1 at different time points after stimulation with IFN-γ, in H3.3-WT and H3.3-G34R mouse DHG cells. (G) Western blot of phospho-STAT5a and STAT5a at basal levels and upon stimulation with IFN-γ in H3.3-WT and H3.3-G34R mouse DHG cells. (H) Occupancy of H3K27Ac on the Stat5a and Stat5b genes. (I) Western blot of phospho-JAK2 and JAK2 at basal levels and upon stimulation with IFN-γ in H3.3-WT and H3.3-G34R mouse DHG cells. (J) Heatmap of a protein array showing the relative normalized PTM levels of JAK/STAT related proteins in G34R mouse DHG cells versus H3.3-WT cells, highlighting the main upregulated and downregulated proteins and PTMs. (K) H3.3-G34R or H3.3–WT neurospheres were incubated with IFNγ (200 UI) or diluent (control) and apoptosis was measured at 48 hours by Annexin V and DAPI staining. *P < 0.05, **P < 0.01, ***P < 0.005, and ****P < 0.001, unpaired t test.
Figure 4.
Figure 4.. Expression of MHC-I in H3.3-G34R vs H3.3-WT DHG.
(A) Occupancy of H3K4me1 on the Ciita gene. The y axis of each profile represents the estimated number of immunoprecipitated fragments at each position normalized to the total number of reads in each dataset. (B) Western blot for CIITA at basal levels and upon treatment with IFN-γ in H3.3-WT and H3.3-G34R mouse DHG cells. Mouse splenocytes were included as positive control. (C) Occupancy of H3K4me3 on the MHC-I genes H2-D1 and H2-K1. (D) Western blot for MHC-I at basal levels and upon treatment with IFN-γ in H3.3-WT and H3.3-G34R mouse DHG cells. (E) Expression of MHC-I in mouse DHG cells by flow cytometry. (F-G) Quantitative analysis of the experiment shown in (E). (H) Expression of MHC-I in mouse DHG cells by flow cytometry and quantification of the experiment. ****P < 0.001, unpaired t test.
Figure 5.
Figure 5.. Analysis of H3.3-G34R DHG TME immune cells.
(A) Volcano plot shows differentially expressed genes (−Log(p-value), y axis) versus the magnitude of change or fold change (Log2(Fold Change), x axis) when comparing gene expression in CD45 positive cells derived from H3.3-G34R versus CD45 from H3.3-WT SB-generated tumors. (B) Heatmap shows the expression level of genes related to immunosuppression in CD45+ cells obtained from H3.3-G34R and H3.3-WT SB-derived tumors. (C) Differentially expressed genes related to T-cell activation (CD3g, CD3e, CD8a and CD8b1), immunosuppression (Arg1) and stemness (CD34) were identified, between H3.3-WT (n=4) and H3.3-G34R (n=3) CD45+ cells. Expression levels are shown as Fragments Per Kilobase of transcript per Million mapped reads (FPKMs, y axis) ± SD. (D) The proportion of cells in human samples identified as DC (SOX2 CD45+ CD3e CD15 Iba1+ Tmem119 CD14 HLA-DRhi / CD45+) and M-MDSC (SOX2 CD45+ CD3e CD15 Iba1+ CD14+ HLA-DR / CD45+). (E) Neighborhood analysis identifying immunosuppressive neighborhoods as those enriched in M-MDSC, PMN-MDSC or M2 macrophages. Plots illustrate representative samples from each experimental group with cell color corresponding to their neighborhood type. The bar graph displays the average prevalence (%) of each neighborhood for each experimental group.
Figure 6.
Figure 6.. Spectral flow cytometry Analysis of the tumor immune microenvironment (TIME) of H3.3-WT and H3.3-G34R DHG at end stage.
(A) Illustration of experimental procedure followed for the characterization of immune cells in H3.3-WT and H3.3-G34R mouse DHG TIME. (B) UMAP embedding of H3.3 G34R and WT DHG immune cell SFC analysis. (C-D) The proportion of cells with Monocytic (CD45+/CD11b+/Ly6G-Ly6Chi) or Polymorphonuclear (CD45+/CD11b+/Ly6G+Ly6Clo) myeloid derived suppressor cell. (E-F) Total pan T cells were identified as CD45+/CD3+ cells and further classified by the expression of CD8 or CD4 (CD45+/CD3+/CD8+ or CD45+/CD3+/CD4+, respectively). (G) The total proportion of macrophages is shown as the percentage of CD45+/CD11b+/F4/80+ cells. (H) The total proportion of microglia is shown as the percentage of CD45 low/CD11b+/TMEM119+ P2Y12+ cells. Data are represented as mean±SD. Statistical differences determined with one-way ANOVA Tukey’s post hoc test. **** p<0.0001; ***p<0.001, **p<0.01, * p<0.05, ns, not significant.
Figure 7.
Figure 7.. Cytokines profile of G34R DHG cells and immune properties of the conditioned media.
(A) The concentration of different cytokines in the conditioned media from three different clones of H3.3-WT and H3.3-G34R neurospheres was analyzed by ELISA. ****p<0.0001, 2-way ANOVA and Sidak's multiple comparisons test. (B) The plots show the occupancy of H3K27me3 (transcriptional repressing), H3K27ac, H3K4me3 and H3K4me1 (transcriptional activating) histone marks on the G-CSF (Csf3) promoter region (light blue dashed box). (C) Experimental layout of the T cell proliferation assay to test the immunosuppressive capacity of conditioned media (CM) from H3.3-G34R or H3.3-WT neurospheres. (D) The percentage of proliferating CD8+ T cells in the presence of CM from H3.3-WT or H3.3-G34R neurospheres, with respect to the positive control (0% CM). (E) Representative histograms show the CD8+ T cell proliferation in the presence of 25%, 50% or 75% CM from H3.3-WT and H3.3-G34R neurospheres. (F) IFNγ concentration was measured in the supernatant of the cultures by ELISA. Bars represent cytokine concentration in absolute numbers. (G) Experimental layout of the T cell proliferation assay to test the immunosuppressive capacity of Gr-1+ CD11b+ cells isolated from H3.3-WT and H3.3-G34R DHG. (H) T cell proliferation was measured as the reduction of CFSE staining in the CD45+/CD3+/CD8+ population with respect to the positive control (OT-1 splenocytes + SIINFEKL). Representative histograms showing the CD8+ T cell proliferation in the presence of Gr-1+ CD11b+ cells from H3.3-WT and H3.3-G34R TMEs. (I) Bars represent the percentage of proliferating CD8+ T cells in each treatment. **** p<0.0001, *** p<0.001; ns=non-significant; ANOVA and Tukey test. **** p<0.0001; ns=non-significant; ANOVA and Tukey test; mean ± SEM.
Figure 8.
Figure 8.. Evaluation of a GCV-inducible gene therapy for H3.3-G34R DHG.
(A) Diagram depicting the experimental outline for the treatment of H3.3-WT and H3.3-G34R tumor bearing mice with Ad-Flt3L + Ad-TK gene therapy (GT). (B) IVIS scan of animals bearing H3.3-G34R tumors 14 days after being treated with Saline or GT. (C) Kaplan-Meier survival curve for the GT experiment. Median survival (MS) and number of animals used are detailed in the plot legend. **** p<0.0001, Mantel-Cox test (D) Long-term survivors were implanted in the contralateral hemisphere with 50.000 H3.3-G34R cells and animals were euthanized at symptomatic stage. (E) Percentage of CD45 infiltration in the TME of H3.3-G34R tumor bearing mice treated with Saline or GT. (F) Number of T cells (CD45+ CD3+) in the TME of H3.3-G34R tumor bearing mice treated with Saline or GT. (G) Number of tumor-specific CD8 T cells (CD45+ CD3+ CD8+ Tet+) in the TME of H3.3-G34R tumor bearing mice treated with Saline or GT. (H) Percentage of double positive T cells for TGIT and TIM-3, two T cell exhaustion markers. * p<0.05; **p<0.01 Student T test.

References

    1. Ostrom QT, Cioffi G, Gittleman H, Patil N, Waite K, Kruchko C, et al. CBTRUS Statistical Report: Primary Brain and Other Central Nervous System Tumors Diagnosed in the United States in 2012–2016. Neuro Oncol 2019;21(Suppl 5):v1–v100 doi 10.1093/neuonc/noz150. - DOI - PMC - PubMed
    1. Miklja Z, Pasternak A, Stallard S, Nicolaides T, Kline-Nunnally C, Cole B, et al. Molecular profiling and targeted therapy in pediatric gliomas: review and consensus recommendations. Neuro Oncol 2019;21(8):968–80 doi 10.1093/neuonc/noz022. - DOI - PMC - PubMed
    1. Jones C, Karajannis MA, Jones DTW, Kieran MW, Monje M, Baker SJ, et al. Pediatric high-grade glioma: biologically and clinically in need of new thinking. Neuro Oncol 2017;19(2):153–61 doi 10.1093/neuonc/now101. - DOI - PMC - PubMed
    1. Lin GL, Wilson KM, Ceribelli M, Stanton BZ, Woo PJ, Kreimer S, et al. Therapeutic strategies for diffuse midline glioma from high-throughput combination drug screening. Sci Transl Med 2019;11(519) doi 10.1126/scitranslmed.aaw0064. - DOI - PMC - PubMed
    1. Mackay A, Burford A, Carvalho D, Izquierdo E, Fazal-Salom J, Taylor KR, et al. Integrated Molecular Meta-Analysis of 1,000 Pediatric High-Grade and Diffuse Intrinsic Pontine Glioma. Cancer Cell 2017;32(4):520–37 e5 doi 10.1016/j.ccell.2017.08.017. - DOI - PMC - PubMed

Publication types