[Preprint]. 2023 Aug 7:2023.06.03.543570.
doi: 10.1101/2023.06.03.543570.

Evaluating the Performance of the Astral Mass Analyzer for Quantitative Proteomics Using Data Independent Acquisition

Affiliations

Evaluating the Performance of the Astral Mass Analyzer for Quantitative Proteomics Using Data Independent Acquisition

Lilian R Heil et al. bioRxiv. .

Update in

Abstract

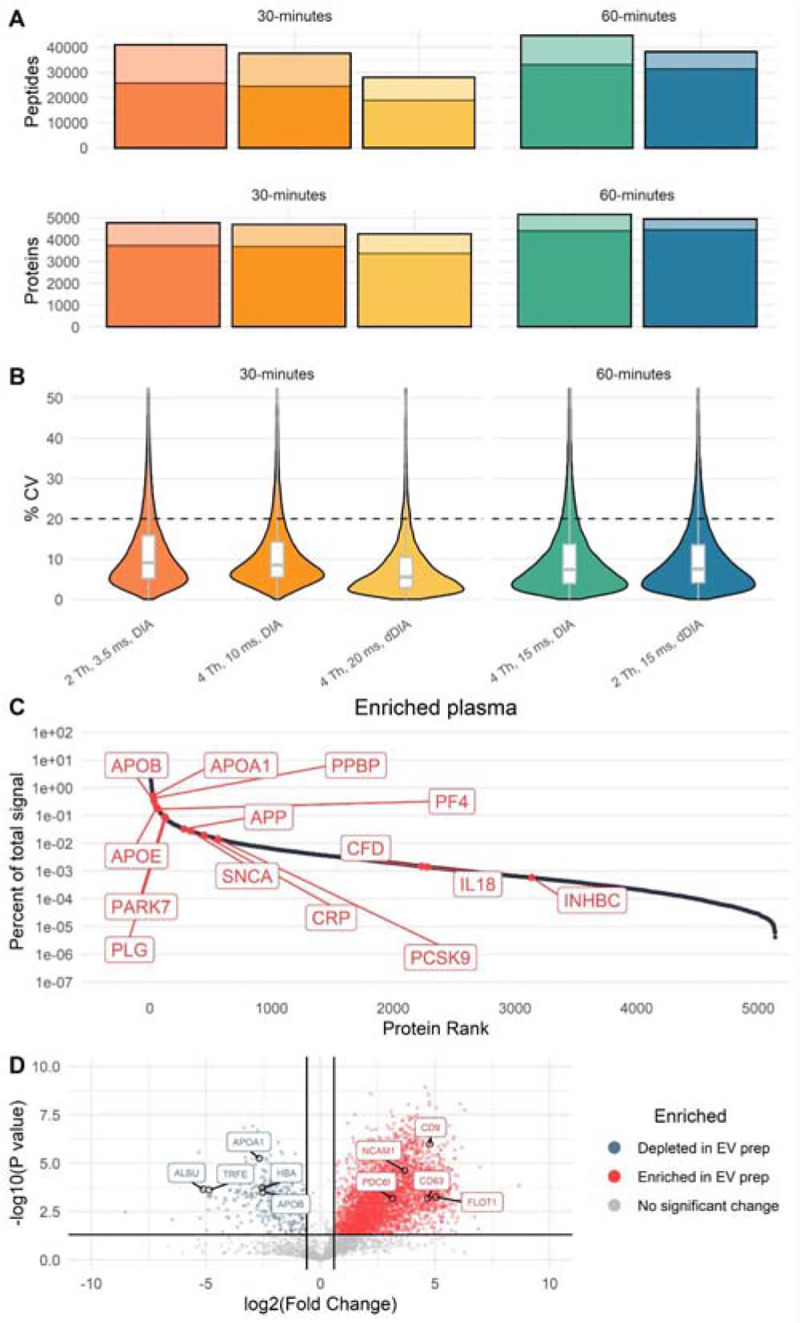
We evaluate the quantitative performance of the newly released Asymmetric Track Lossless (Astral) analyzer. Using data independent acquisition, the Thermo Scientific™ Orbitrap™ Astral™ mass spectrometer quantifies 5 times more peptides per unit time than state-of-the-art Thermo Scientific™ Orbitrap™ mass spectrometers, which have long been the gold standard for high resolution quantitative proteomics. Our results demonstrate that the Orbitrap Astral mass spectrometer can produce high quality quantitative measurements across a wide dynamic range. We also use a newly developed extra-cellular vesicle enrichment protocol to reach new depths of coverage in the plasma proteome, quantifying over 5,000 plasma proteins in a 60-minute gradient with the Orbitrap Astral mass spectrometer.


Conflict of interest statement

Notes

The authors declare the following competing financial interest(s): The MacCoss Lab at the University of Washington has a sponsored research agreement with Thermo Fisher Scientific, the manufacturer of the instrumentation used in this research. However, analytical techniques were selected and performed independent of Thermo Fisher Scientific. M.J.M. is a paid consultant for Thermo Fisher Scientific. E.D.,T.N.A., A.C.P., E.D., J.P., A.P., P.M.R., M.W.S., H.I.S., C.H., A.A.M., D.H., and V.Z. are employees of Thermo Fisher Scientific, the manufacturer of the instrumentation used in this research.

Figures

Figure 1.
Figure 1.. Quantitative comparison of the Orbitrap Astral MS and Orbitrap Fusion Lumos performance on a bulk cell digest.
Schematic of the Orbitrap Astral mass spectrometer (A) and of isolation windows used for each method, with a limited mass range displayed (B). A dynamic DIA method was created based on peptide feature density with systematic isolation windows moving across the mass range between the two dark colored lines (C). The overlap of protein identifications between each method shows a high level of agreement between different Astral methods, with a subset of these proteins being detectable in the Orbitrap (D). Data were acquired on the Orbitrap Astral MS with a 24-minute gradient compared to a 90-minute gradient on the Orbitrap Fusion Lumos MS.
Figure 2.
Figure 2.. Evaluation of the technical precision of the data obtained with the Astral analyzer.
Peptide (A) and protein (B) level coefficients of variation across 4 different acquisition methods. CVs are plotted for the same set of peptides with different amounts of HeLa injected with SILAC HeLa added as a background to keep total protein loading level constant (1000 ng). Dashed horizontal line represents the median CV, which is also indicated on the plot.
Figure 3.
Figure 3.. Evaluation of the quantitative performance of the Orbitrap Astral MS.
Summary of peptides detected in a matrix-matched calibration curve of HeLa into SILAC labeled HeLa, with 1 μg of total protein load (A). Results of A are summarized in Supplemental Table 2. Peptides are considered detectable if they were detected at 1% FDR, quantitative if they could be assigned a lower limit of quantification less than 100%, quantitative over a 10x dynamic range if that LLOQ was less than 10%, and quantitative over a 50x dynamic range if the LLOQ was less than 2%. Transitions were refined in Skyline to optimize LLOQ and metrics were recalculated with this refined transition set. Pairwise comparison of LLOQs for peptides quantified in the Astral and the Orbitrap, black dashed line represents the median LLOQ (B). Histogram of LLOQs for all quantifiable peptides before and after transition refinement, black dashed lines represent the median LLOQ (C). Signal ratio between 2 points on the dilution curve (100% and 10%) with expected ratio shown as dashed black line, signal from the blank was subtracted from each signal to account for carryover and non-zero background (D). Orbitrap data were acquired with a 90-minute gradient, compared to a 24-minute gradient for the Astral data.
Figure 4.
Figure 4.. Plasma protein quantification.
Peptide and protein-level detections from plasma samples (A). Lighter bars represent peptides/ proteins that were detected at 1% FDR but did not have a chromatographic peak with at least 3 co-eluting transitions. Summary of all proteins measured with selected biologically relevant proteins highlighted (B). Coefficient of variation of all peptides detected in EV-enriched plasma with each method (C). The black dashed line is at 20% CV; in all cases more than 83% of all peptides had CVs less than 20%. Volcano plot of proteins enriched and depleted in the EV-enrichment method relative to a total plasma preparation, results are shown for the 60-minute, 4 Th, 15 ms DIA method, and are representative for the results from all five methods (D). Vertical black lines indicate a fold change of +/− 1.5, horizontal black line indicates a significance threshold of 0.95.

References

    1. Zubarev R. A. The Challenge of the Proteome Dynamic Range and Its Implications for In-Depth Proteomics. PROTEOMICS 2013, 13 (5), 723–726. 10.1002/pmic.201200451. - DOI - PubMed
    1. Anderson N. L.; Anderson N. G. The Human Plasma Proteome: History, Character, and Diagnostic Prospects. Mol. Cell. Proteomics 2002, 1 (11), 845–867. 10.1074/mcp.R200007-MCP200. - DOI - PubMed
    1. Slavov N. Single-Cell Protein Analysis by Mass-Spectrometry. Curr. Opin. Chem. Biol. 2021, 60, 1–9. 10.1016/j.cbpa.2020.04.018. - DOI - PMC - PubMed
    1. Brunner A.-D.; Thielert M.; Vasilopoulou C. G.; Ammar C.; Coscia F.; Mund A.; Hoerning O. B.; Bache N.; Apalategui A.; Lubeck M.; Richter S.; Fischer D. S.; Raether O.; Park M. A.; Meier F.; Theis F. J.; Mann M. Ultra-High Sensitivity Mass Spectrometry Quantifies Single-Cell Proteome Changes upon Perturbation; preprint; Systems Biology, 2020. 10.1101/2020.12.22.423933. - DOI - PMC - PubMed
    1. Schoof E. M.; Furtwängler B.; Üresin N.; Rapin N.; Savickas S.; Gentil C.; Lechman E.; Keller U. auf dem; Dick J. E.; Porse B. T. Quantitative Single-Cell Proteomics as a Tool to Characterize Cellular Hierarchies. Nat. Commun. 2021, 12 (1), 3341. 10.1038/s41467-021-23667-y. - DOI - PMC - PubMed

Publication types