[Preprint]. 2024 Jun 24:2023.05.29.542742.
doi: 10.1101/2023.05.29.542742.

Study design features increase replicability in cross-sectional and longitudinal brain-wide association studies

Affiliations

Study design features increase replicability in cross-sectional and longitudinal brain-wide association studies

Kaidi Kang et al. bioRxiv. .

Update in

  • Study design features increase replicability in brain-wide association studies.
    Kang K, Seidlitz J, Bethlehem RAI, Xiong J, Jones MT, Mehta K, Keller AS, Tao R, Randolph A, Larsen B, Tervo-Clemmens B, Feczko E, Dominguez OM, Nelson SM; Lifespan Brain Chart Consortium; Schildcrout J, Fair DA, Satterthwaite TD, Alexander-Bloch A, Vandekar S. Kang K, et al. Nature. 2024 Dec;636(8043):719-727. doi: 10.1038/s41586-024-08260-9. Epub 2024 Nov 27. Nature. 2024. PMID: 39604734 Free PMC article.

Abstract

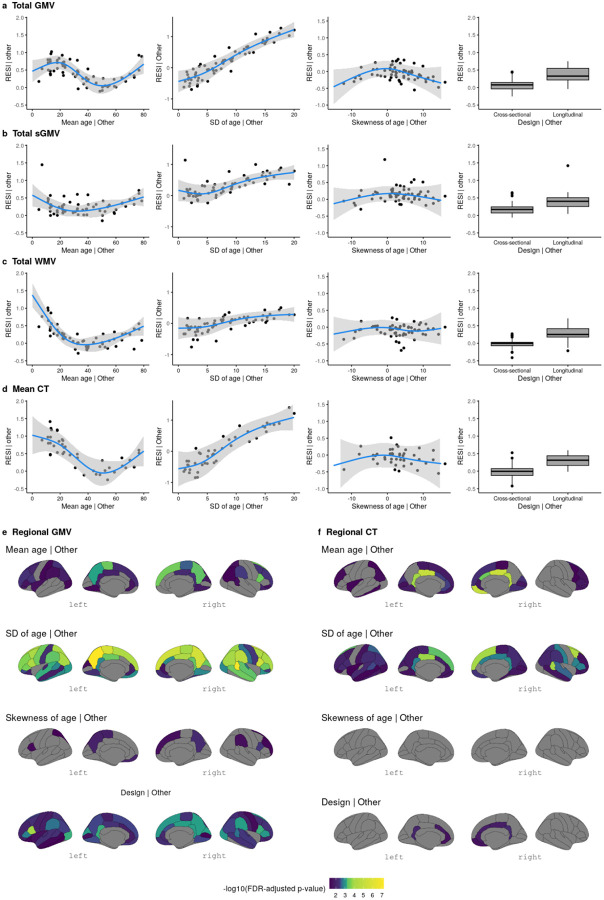
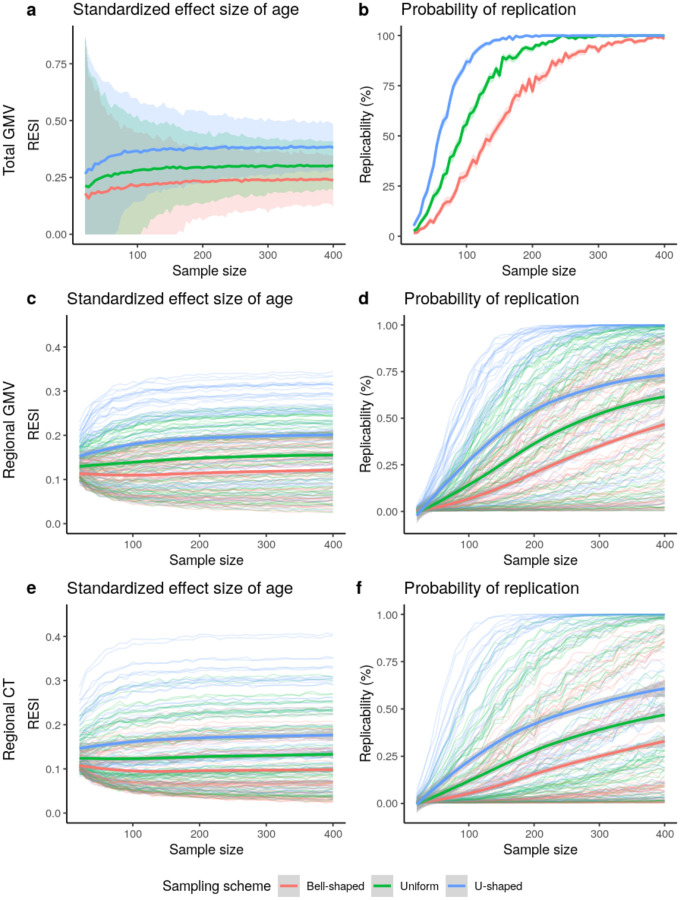
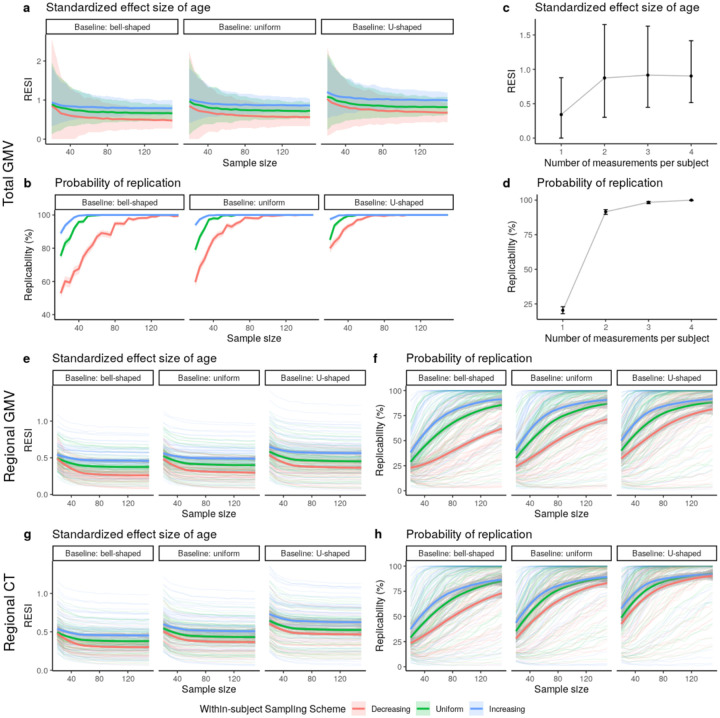
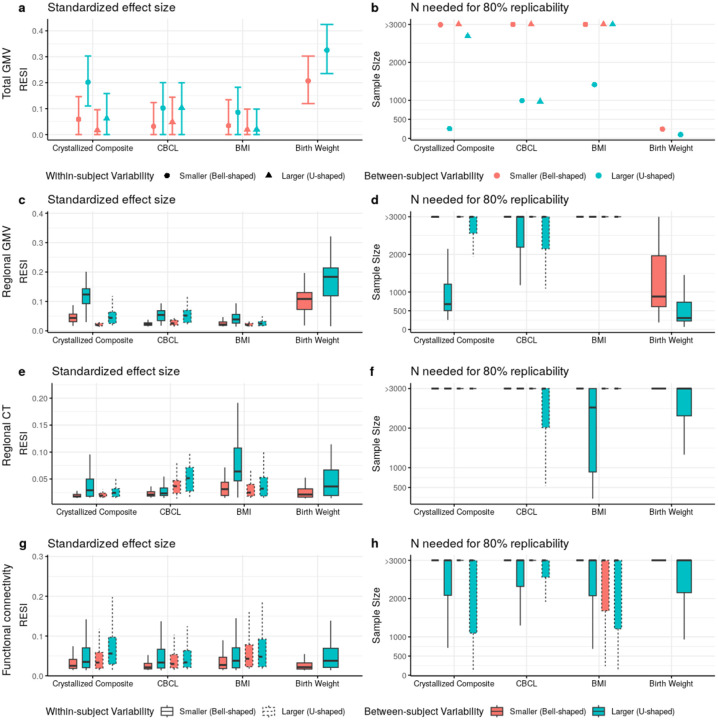
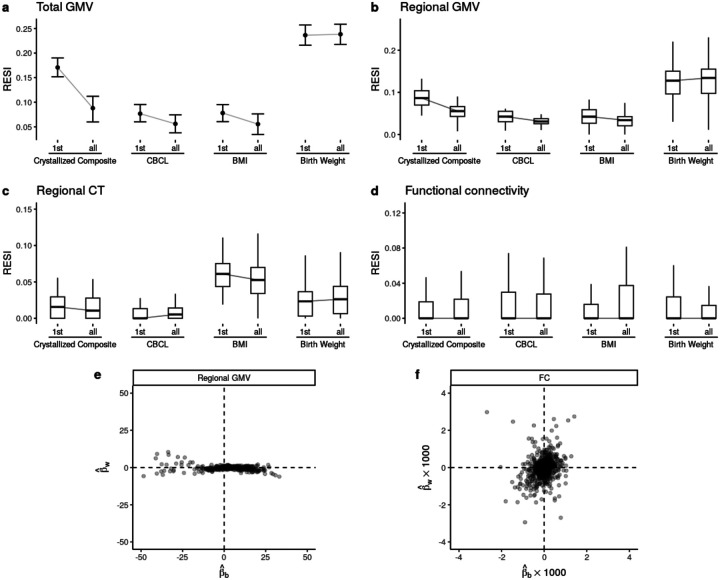
Brain-wide association studies (BWAS) are a fundamental tool in discovering brain-behavior associations. Several recent studies showed that thousands of study participants are required for good replicability of BWAS because the standardized effect sizes (ESs) are much smaller than the reported standardized ESs in smaller studies. Here, we perform analyses and meta-analyses of a robust effect size index using 63 longitudinal and cross-sectional magnetic resonance imaging studies from the Lifespan Brain Chart Consortium (77,695 total scans) to demonstrate that optimizing study design is critical for increasing standardized ESs and replicability in BWAS. A meta-analysis of brain volume associations with age indicates that BWAS with larger variability in covariate have larger reported standardized ES. In addition, the longitudinal studies we examined reported systematically larger standardized ES than cross-sectional studies. Analyzing age effects on global and regional brain measures from the United Kingdom Biobank and the Alzheimer's Disease Neuroimaging Initiative, we show that modifying longitudinal study design through sampling schemes improves the standardized ESs and replicability. Sampling schemes that improve standardized ESs and replicability include increasing between-subject age variability in the sample and adding a single additional longitudinal measurement per subject. To ensure that our results are generalizable, we further evaluate these longitudinal sampling schemes on cognitive, psychopathology, and demographic associations with structural and functional brain outcome measures in the Adolescent Brain and Cognitive Development dataset. We demonstrate that commonly used longitudinal models can, counterintuitively, reduce standardized ESs and replicability. The benefit of conducting longitudinal studies depends on the strengths of the between- versus within-subject associations of the brain and non-brain measures. Explicitly modeling between- versus within-subject effects avoids averaging the effects and allows optimizing the standardized ESs for each separately. Together, these results provide guidance for study designs that improve the replicability of BWAS.


Figures

Fig. 1.
Fig. 1.. Meta-analyses reveal study design features that are associated with larger standardized effect sizes (ESs) of age on different brain measures.
(a-d) Partial regression plots of the meta-analyses of standardized ESs (RESI) for the association between age and global brain measures (a) total gray matter volume (GMV), (b) total subcortical gray matter volume (sGMV), (c) total white matter volume (WMV), and (d) mean cortical thickness (CT) (“| Other” means after fixing the other features at constant levels: design = cross-sectional, mean age = 45 years, sample age SD = 7 and/or skewness of age = 0 (symmetric)) show that standardized ESs vary with respect to the mean and SD of age in each study. The blue curves are the expected standardized ESs for age from the locally estimated scatterplot smoothing (LOESS) curves. The gray areas are the 95% confidence bands from the LOESS curves. (e-f) The effects of study design features on the standardized ESs for the associations between age and regional brain measures (regional GMV and CT). Regions with Benjamini-Hochberg adjusted p-values<0.05 are shown in color.
Fig. 2.
Fig. 2.. Increased standardized effect sizes (ESs) and replicability for age associations with different brain measures: (a-b) total gray matter volume (GMV), (c-d) regional GMV, and (e-f) regional cortical thickness (CT), under three sampling schemes in the UKB study
(N = 29,031 for total GMV and N = 29,030 for regional GMV and CT). The sampling schemes target different age distributions to increase the variability of age: Bell-shaped<Uniform<U-shaped (Fig. S3). Using the resampling schemes that increase age variability increases (a) the standardized ESs and (b) replicability (at significance level of 0.05) for total GMV-age association. The same result holds for (c-d) regional GMV and (e-f) regional CT. The curves represent the average standardized ES or estimated replicability at a given sample size and sampling scheme. The shaded areas represent the corresponding 95% confidence bands. (c-f) The bold curves are the average standardized ES or replicability across all regions with significant uncorrected effects using the full UKB data.
Fig. 3.
Fig. 3.. Increased standardized effect sizes (ESs) and replicability for age associations with structural brain measures under different longitudinal sampling schemes in the ADNI data.
Three different sampling schemes (Fig. S5) are implemented in bootstrap analyses to modify the between- and within-subject variability of age, respectively. (a-b) Implementing the sampling schemes results in higher (between- and/or within-subject) variability and increases the (a) standardized ES and (b) replicability (at significance level of 0.05) for the total gray matter volume (GMV)-age association. The curves represent the average standardized ES or estimated replicability and the gray areas are the 95% confidence bands across the 1,000 bootstraps. (c-d) Increasing the number of measurements from one to two per subject provides the most benefit on (c) standardized ES and (d) replicability for the total GMV-age association when using uniform between- and within-subject sampling schemes and N = 30. The points represent the mean standardized ESs or estimated replicability and the whiskers are the 95% confidence intervals. (e-h) Increased standardized ESs and replicability for the associations of age with regional (e-f) GMV and (g-h) cortical thickness (CT), across all brain regions under different sampling schemes. The bold curves are the average standardized ES or estimated replicability across all regions with significant uncorrected effects using the full ADNI data. The gray areas are the corresponding 95% confidence bands. Increasing the between- and within-subject variability of age by implementing different sampling schemes can increase the standardized ESs of age, and the associated replicability, on regional GMV and regional CT.
Fig. 4.
Fig. 4.. Heterogeneous improvement of standardized effect sizes (ESs) for select cognitive, mental health, and demographic associations with structural and functional brain measures in the ABCD study with bootstrapped samples of N = 500.
(a) U-shaped between-subject sampling scheme (blue) that increases between-subject variability of the non-brain covariate produces larger standardized ESs and (b) reduces the number of participants scanned to obtain 80% replicability in total gray matter volume (GMV). The points and triangles are the average standardized ESs across bootstraps and the whiskers are the 95% confidence intervals. Increasing within-subject sampling (triangles) can reduce standardized ESs. A similar pattern holds in (c-d) regional GMV and (e-f) regional cortical thickness (CT); boxplots show the distributions of the standardized ESs across regions (or region pairs for functional connectivity (FC)). In contrast, (g) regional pairwise FC standardized ESs improve by increasing between- (blue) and within-subject variability (dashed borders) with a corresponding reduction in the (h) number of participants scanned for 80% replicability. See Fig. S6 for the results for all non-brain covariates examined.
Fig. 5.
Fig. 5.. Longitudinal study designs can reduce standardized effect sizes (ESs) and replicability due to differences in between- versus within-subject associations of brain and behavior measures.
Boxplots show the distributions of the standardized ESs across regions. (a-c) Cross-sectional analyses (using only the baseline measures; indicated by “1st”s on the x-axes) can have larger standardized ESs than the same longitudinal analyses (using the full longitudinal data; indicated by “all”s on the x-axes) for structural brain measures in ABCD. (d) The functional connectivity (FC) measures do not show such a reduction of standardized ESs in longitudinal modeling. See Fig. S8 for the results for all non-brain covariates examined. (e) Most regional gray matter volume (GMV) associations (Fig. 5c) have larger between-subject parameter estimates (βb, x-axis) than within-subject parameter estimates (βw, y-axis; see Supplementary Information: Eqn (13)), whereas (f) FC associations (Fig. 5g) show less heterogeneous relationships between the two parameters.

References

    1. Marek S. et al. Reproducible brain-wide association studies require thousands of individuals. Nature 603, 654–660 (2022). - PMC - PubMed
    1. Owens M. M. et al. Recalibrating expectations about effect size: A multi-method survey of effect sizes in the ABCD study. PLOS ONE 16, e0257535 (2021). - PMC - PubMed
    1. Spisak T., Bingel U. & Wager T. D. Multivariate BWAS can be replicable with moderate sample sizes. Nature 615, E4–E7 (2023). - PMC - PubMed
    1. Nosek B. A. et al. Replicability, Robustness, and Reproducibility in Psychological Science. Annu. Rev. Psychol. 73, 719–748 (2022). - PubMed
    1. Patil P., Peng R. D. & Leek J. T. What should we expect when we replicate? A statistical view of replicability in psychological science. Perspect. Psychol. Sci. J. Assoc. Psychol. Sci. 11, 539–544 (2016). - PMC - PubMed

Publication types