[Preprint]. 2023 Jun 2:rs.3.rs-2953760.
doi: 10.21203/rs.3.rs-2953760/v1.

The patient-specific mouse model with Foxg1 frameshift mutation uncovers the pathophysiology of FOXG1 syndrome

Affiliations

The patient-specific mouse model with Foxg1 frameshift mutation uncovers the pathophysiology of FOXG1 syndrome

Jaein Park et al. Res Sq. .

Update in

Abstract

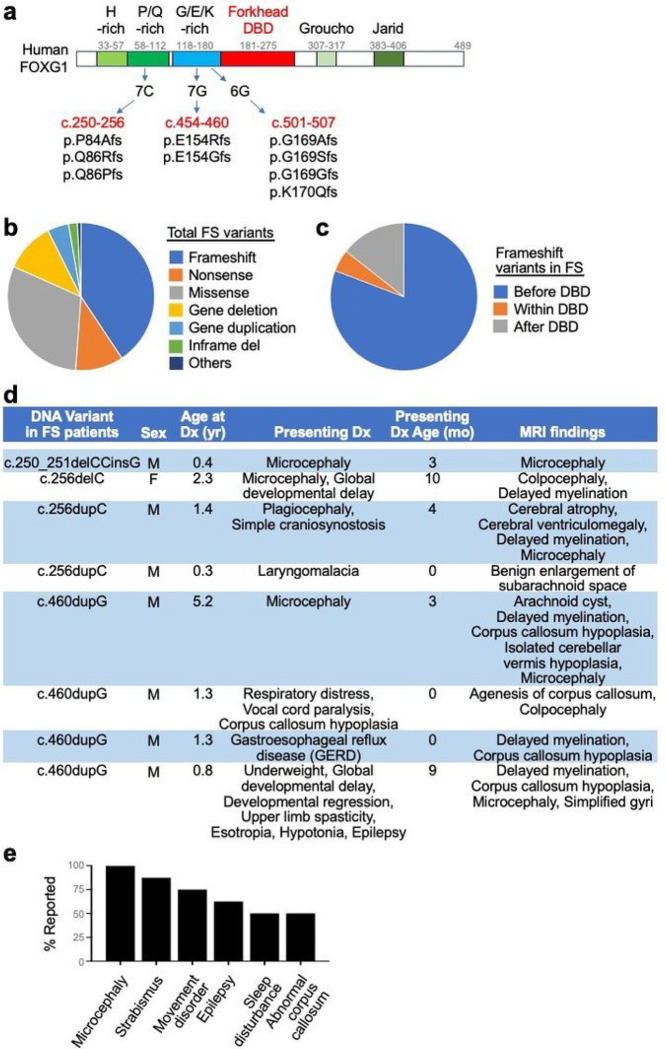
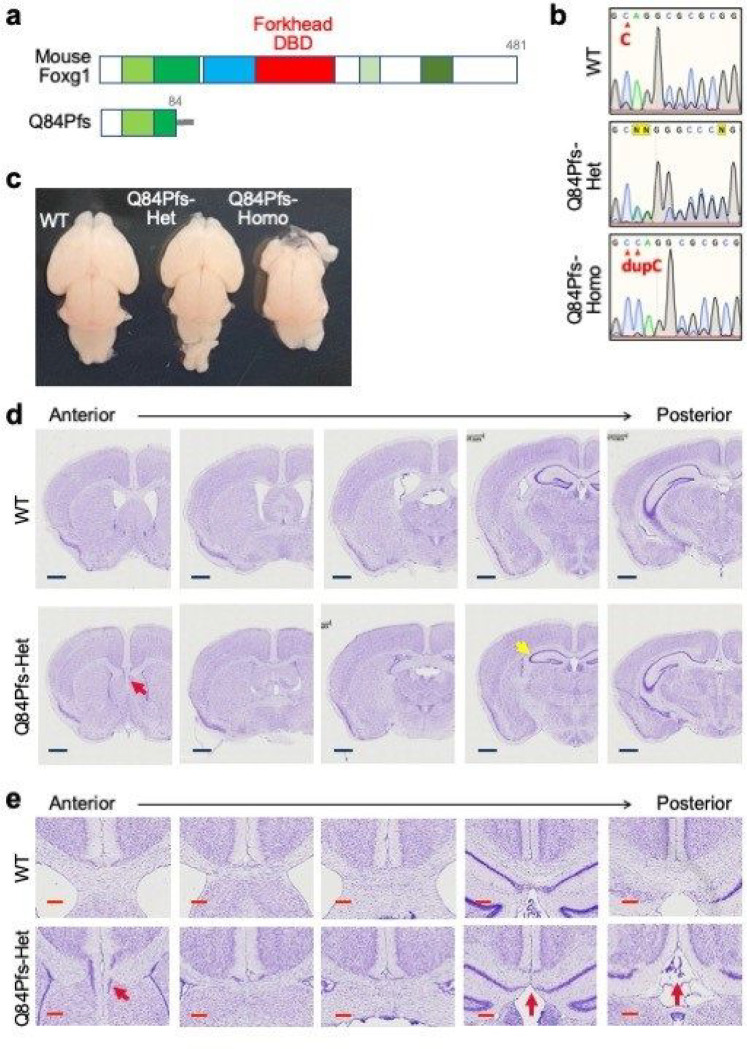
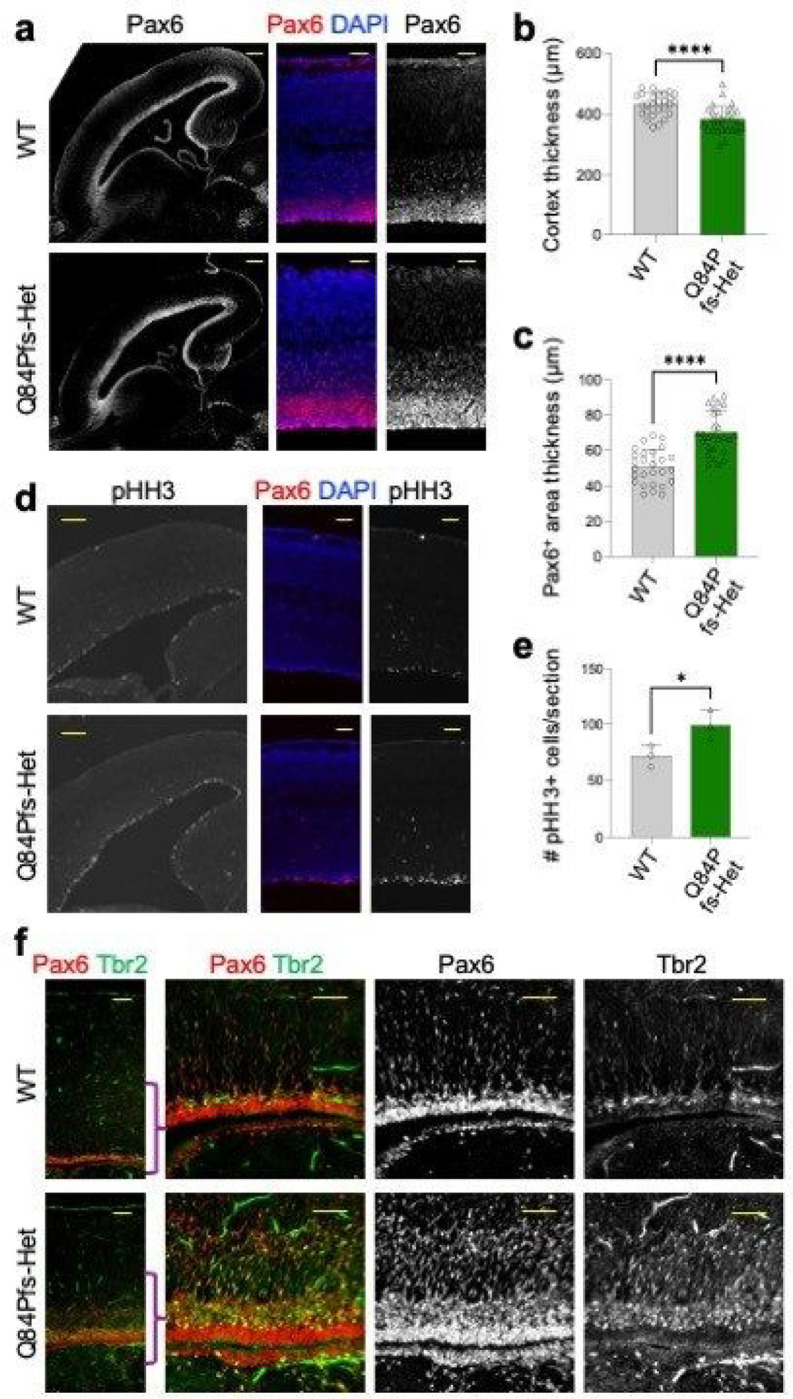
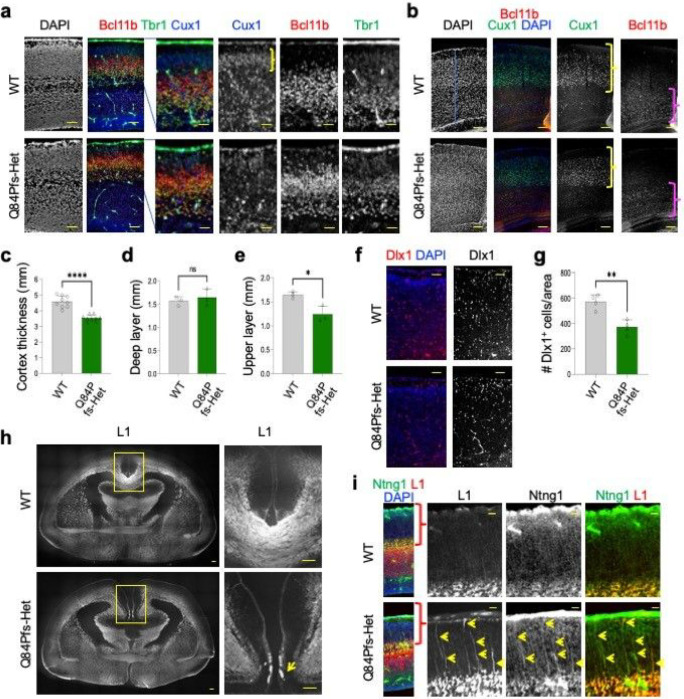
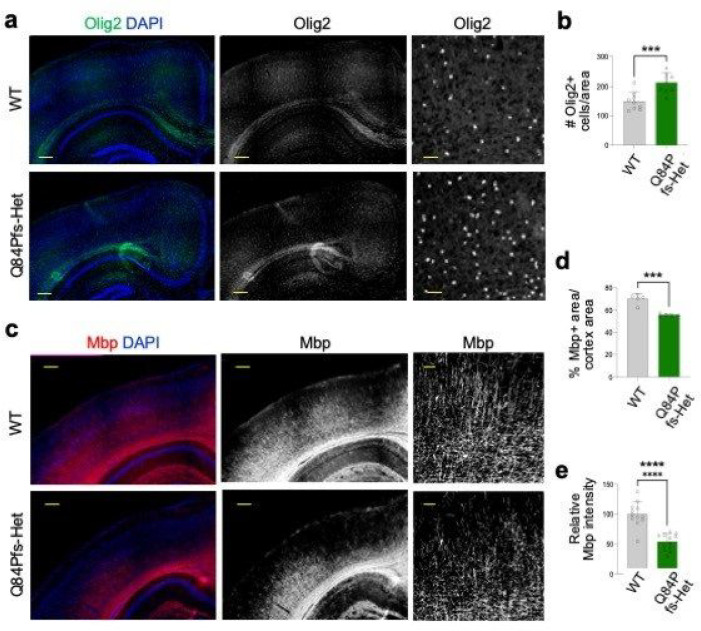
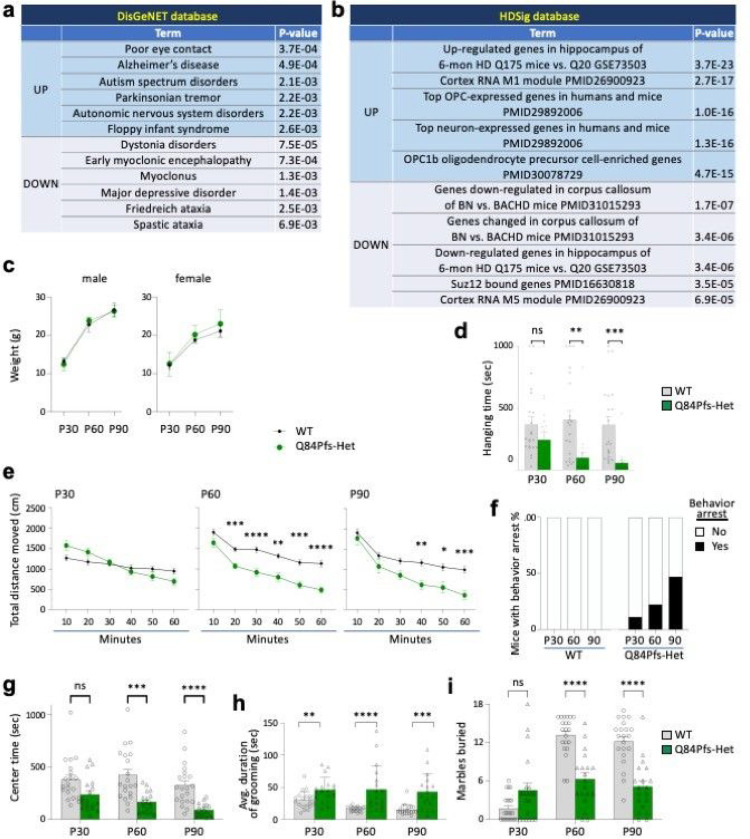
Single allelic mutations in the gene encoding the forebrain-specific transcription factor FOXG1 lead to FOXG1 syndrome (FS). Patient-specific animal models are needed to understand the etiology of FS, as FS patients show a wide spectrum of symptoms correlated with location and mutation type in the FOXG1 gene. Here we report the first patient-specific FS mouse model, Q84Pfs heterozygous (Q84Pfs-Het) mice, mimicking one of the most predominant single nucleotide variants in FS. Intriguingly, we found that Q84Pfs-Het mice faithfully recapitulate human FS phenotypes at the cellular, brain structural, and behavioral levels. Importantly, Q84Pfs-Het mice exhibited myelination deficits like FS patients. Further, our transcriptome analysis of Q84Pfs-Het cortex revealed a new role for FOXG1 in synapse and oligodendrocyte development. The dysregulated genes in Q84Pfs-Het brains also predicted motor dysfunction and autism-like phenotypes. Correspondingly, Q84Pfs-Het mice showed movement deficits, repetitive behaviors, increased anxiety, and prolonged behavior arrest. Together, our study revealed the crucial postnatal role of FOXG1 in neuronal maturation and myelination and elucidated the essential pathophysiology mechanisms of FS.


Figures

Figure 1
Figure 1. Frameshift mutations in the three mutation hot spots in the FOXG1 gene.
a, Schematics of human FOXG1 protein and the three G (guanine) or C (cytosine)-repeat regions in the FOXG1 coding sequences. The three regions are mutation hot spots leading to FS. The frameshift type FOXG1 gene variants in these three hot spots were shown. These frameshift mutations occur in the N-terminal region of FOXG1. b,c, Pie charts showing the fraction of each mutation type that results in FS (b) and the fraction of frameshift mutations occurring before, within, or after the DNA-binding domain (DBD) in the FOXG1 protein (c). d, Clinical findings of eight FS patients with FOXG1 mutations at c.250–256 and c.454–460 positions. e, Frequency of different phenotypes among the eight FS patients in (d).
Figure 2
Figure 2. Anatomical deficits of the forebrains of Q84Pfs mice.
a, Schematics of mouse Foxg1 full-length protein and Q84Pfs, a truncated form of Foxg1. b, Sanger sequencing results of the Foxg1 gene of wild-type (WT), Q84Pfs-Het, and Q84Pfs-Homo mice. c, The morphology of E18.5 WT, Q84Pfs-Het, and Q84Pfs-Homo brains. d, The representative images for Nissl stain of the serial coronal sections of WT and Q84Pfs-Het brains at P60. The anterior to posterior sections were as shown. e, The magnified views of the midline areas in (d). Scale bars, 1mm (d) or 200mm (e). The red and yellow arrows mark midline deficits and underdeveloped hippocampus, respectively, in Q84Pfs-Het brains.
Figure 3
Figure 3. The dysregulated genes and pathways in Q84Pfs-Het cortex at P1.
a, The differentially expressed genes (DEGs) in P1 cortices of Q84Pfs-Het mice as shown by the volcano plot. b, Cortical upper layer and interneuron genes were downregulated, whereas the deep layer genes were upregulated. c, The integration of DEGs of Q84Pfs-Het cortex and Foxg1 ChIP-seq data revealed the fraction of the DEGs that directly recruits Foxg1, as marked by orange. d, The motif analysis of Foxg1 ChIP-seq peaks associated with up- or down-regulated genes in Q84Pfs-Het cortex. TF, transcription factor. e-h, Gene set enrichment analysis (GSEA) of DEGs.
Figure 4
Figure 4. Q84Pfs-Het cortex showed increased Pax6+ and Tbr2+ neural progenitors.
a-f, The immunostaining analyses of the sagittal sections of Q84Pfs-Het and WT cortices at E16 (a-e) and P1 (f). The quantification of cortex thickness (b), the thickness of Pax6+ progenitor areas (c), and the number of phosphorylated histone H3+ cells (e) of E16 cortices. Scale bars, 200mm (lower magnification images in a, d), 50mm (higher magnification images in a, d), or 100mm (f). Thickness in (b,c) was measured in three independent areas per section and three sections were analyzed in each mouse (n = 3 mice per group). The error bars (b,c,e) represent the standard deviation of the mean. *, p<0.05, ****, p<0.0001 in unpaired two-tailed test.
Figure 5
Figure 5. Q84Pfs-Het mice showed a reduction of cortical thickness, upper cortical layer, and cortical interneurons, and axon misprojections in the cortex.
a-i, The immunostaining analyses of Q84Pfs-Het and WT brains at E16 (a,i), P30 (b-e), P1 (f, g), and P0 (h). The Cux1+ upper layer was marked by yellow brackets (a,b), and the deep layer was marked by magenta brackets (b). c-e, The quantification of cortex thickness (c), the thickness of the deep layers 5/6 (d) and the thickness of the Cux1+ upper layer (e) in three independent areas per mouse (n = 3 mice per group). g, The number of Dlx1+ cortical interneurons in two independent sections per mouse (n = 2 mice per group). h, The immunostaining with L1 axonal marker revealed the corpus callosum agenesis in Q84Pfs-Het brains. The yellow arrow indicates the Probst bundle at the midline. i, The misprojection of the bundle of L1/Ntng1 (NetrinG1)-double positive axons (yellow arrows) in Q84Pfs-Het cortex. Scale bars, 200mm (lower magnification images in a), 100mm (higher magnification images in a), 500mm (b,f), 1mm (h), and 200mm (i). c-e, g, The error bars represent the standard deviation of the mean. *, p<0.05, **, p<0.01, ***, p<0.001, ****, p<0.0001; ns, non-significant in unpaired two-tailed test.
Figure 6
Figure 6. Q84Pfs-Het mice showed myelination deficits.
a-f, The immunostaining analyses of Q84Pfs-Het and WT brains at P30. The quantification of the number of Olig2+ oligodendrocyte lineage cells (b; in three independent areas per mouse, n = 3 mice per group), the percentage of strong Mbp+ myelinated axon areas per the total cortex area (d; in two independent areas per mouse, n = 3 mice per group), and the relative Mbp intensity in the cortex (e; in three independent areas per mouse, n = 3 mice per group). Scale bars, 1mm (lower magnification images in a,c), 100mm (higher magnification images in a), and 200mm (higher magnification images in c). b,d,e, The error bars represent the standard deviation of the mean. **, p<0.01, ***, p<0.001, ****, p<0.0001 in unpaired two-tailed test.
Figure 7
Figure 7. Q84Pfs-Het mice showed movement deficits, autism-like repetitive behaviors, and prolonged behavior arrest.
a,b, Gene set enrichment analysis (GSEA) revealed the significant association between the DEGs in Q84Pfs-Het cortex and human disorders, such as autism (a), and dysregulated genes in Huntington’s disease mouse models and OPC genes (b). c, WT and Q84Pfs-Het mice showed no significant difference in body weights (WT 12 male, 9 female; Q84Pfs-Het 9 male, 10 female). d,Q84Pfs-Het mice showed a reduced hanging time. e, Q84Pfs-Het mice showed reduced travel distance at P60 and P90. f, Some Q84Pfs-Het mice exhibited prolonged behavior arrest, which is defined by paused locomotion for longer than 3 min at one episode during the open field test. In contrast, no WT mice showed prolonged behavior arrest. The black bars indicate % of mice showing behavior arrest among all tested mice. g, Q84Pfs-Het mice showed a reduced center time. h, Q84Pfs-Het mice exhibited significantly increased self-grooming behavior relative to WT, as measured by the average duration of an individual grooming event. i, Q84Pfs-Het mice buried significantly fewer marbles than WT mice at P60 and P90 but showed a tendency of burying more marbles at P30. c-i, Error bars, SEM. *, p< 0.05; **, p<0.01; ***, p<0.001; ****, p<0.0001; ns, not significant in the two-way ANOVA test (c,d,e,g,i) or the Mann-Whitney Test (h). Each circle and triangle correspond to one animal. d,i, For P30, WT n = 22 (12 male, 10 female), Q84Pfs-Het n= 20 (10 male, 10 female); for P60 and P90, WT n = 21 (12 male, 9 female), Q84Pfs-Het n = 19 (9 male, 10 female). e-h, For P30 and P60, WT n = 20 (12 male, 8 female), Q84Pfs-Het n = 18 (8 male, 10 female); for P90 in e,g, WT n = 21 (12 male, 9 female), Q84Pfs-Het n =18 (8 male, 10 female) and for P90 in f,h, WT n = 21 (12 male, 9 female), Q84Pfs-Het n = 17 (7 male, 10 female).

References

    1. Tao W. & Lai E. Telencephalon-restricted expression of BF-1, a new member of the HNF-3/fork head gene family, in the developing rat brain. Neuron 8, 957–966 (1992). 10.1016/0896-6273(92)90210-5 - DOI - PubMed
    1. Xuan S. et al. Winged helix transcription factor BF-1 is essential for the development of the cerebral hemispheres. Neuron 14, 1141–1152 (1995). - PubMed
    1. Cadwell C. R., Bhaduri A., Mostajo-Radji M. A., Keefe M. G. & Nowakowski T. J. Development and Arealization of the Cerebral Cortex. Neuron 103, 980–1004 (2019). 10.1016/j.neuron.2019.07.009 - DOI - PMC - PubMed
    1. Lim L., Mi D., Llorca A. & Marín O. Development and Functional Diversification of Cortical Interneurons. Neuron 100, 294–313 (2018). 10.1016/j.neuron.2018.10.009 - DOI - PMC - PubMed
    1. Martynoga B., Morrison H., Price D. J. & Mason J. O. Foxg1 is required for specification of ventral telencephalon and region-specific regulation of dorsal telencephalic precursor proliferation and apoptosis. Developmental biology 283, 113–127 (2005). 10.1016/j.ydbio.2005.04.005 - DOI - PubMed

Publication types

LinkOut - more resources