[Preprint]. 2023 Jun 17:2023.06.16.544770.
doi: 10.1101/2023.06.16.544770.

GENE EXPRESSION WITHIN A HUMAN CHOROIDAL NEOVASCULAR MEMBRANE USING SPATIAL TRANSCRIPTOMICS

Affiliations

GENE EXPRESSION WITHIN A HUMAN CHOROIDAL NEOVASCULAR MEMBRANE USING SPATIAL TRANSCRIPTOMICS

Andrew P Voigt et al. bioRxiv. .

Update in

Abstract

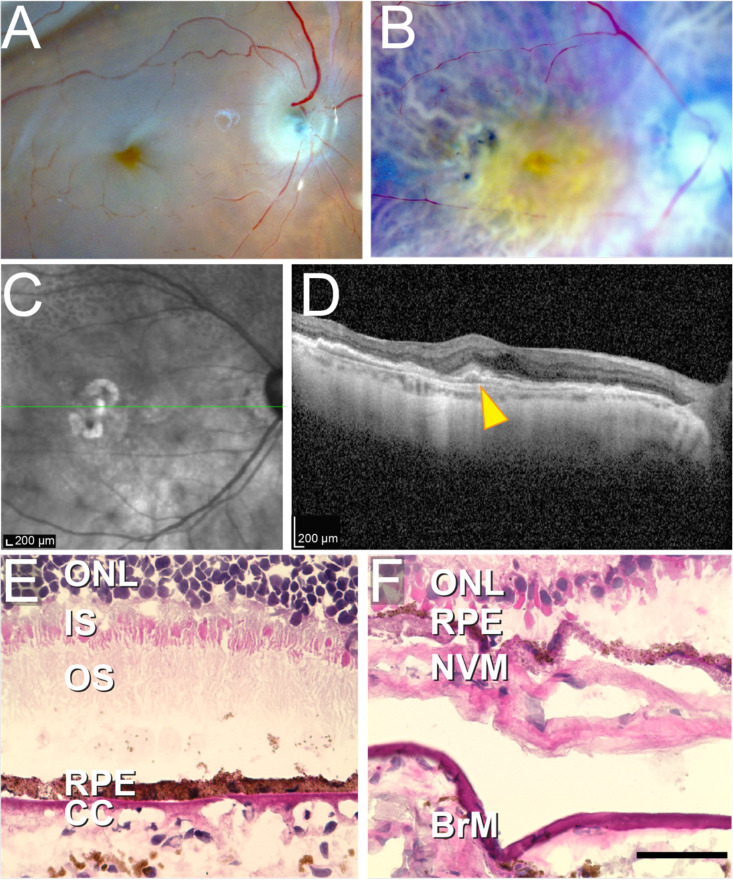
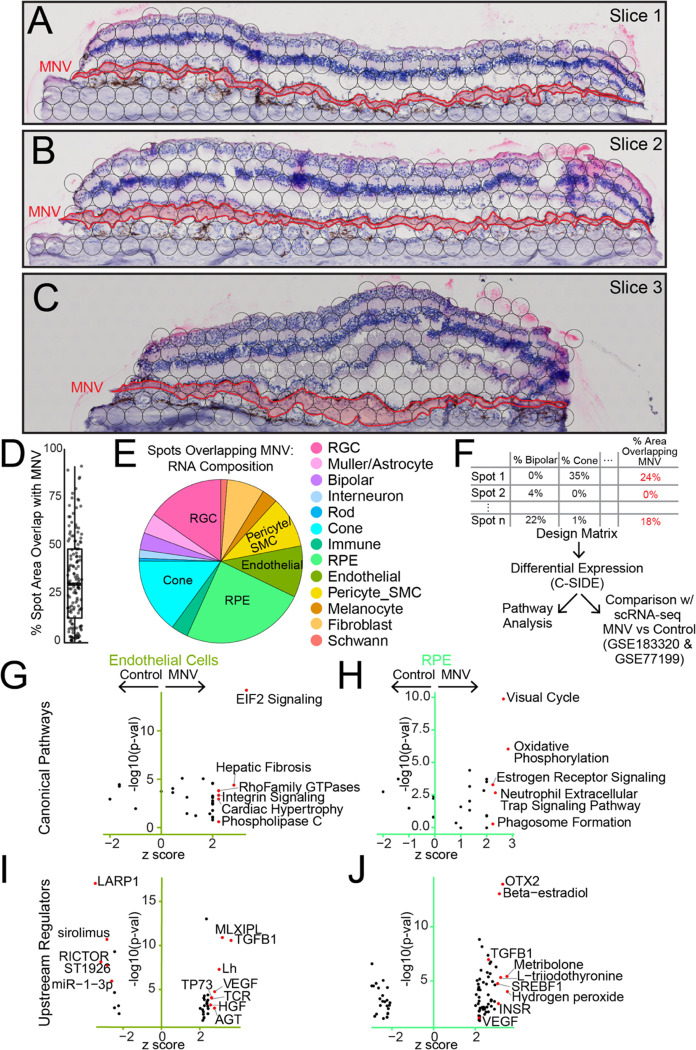
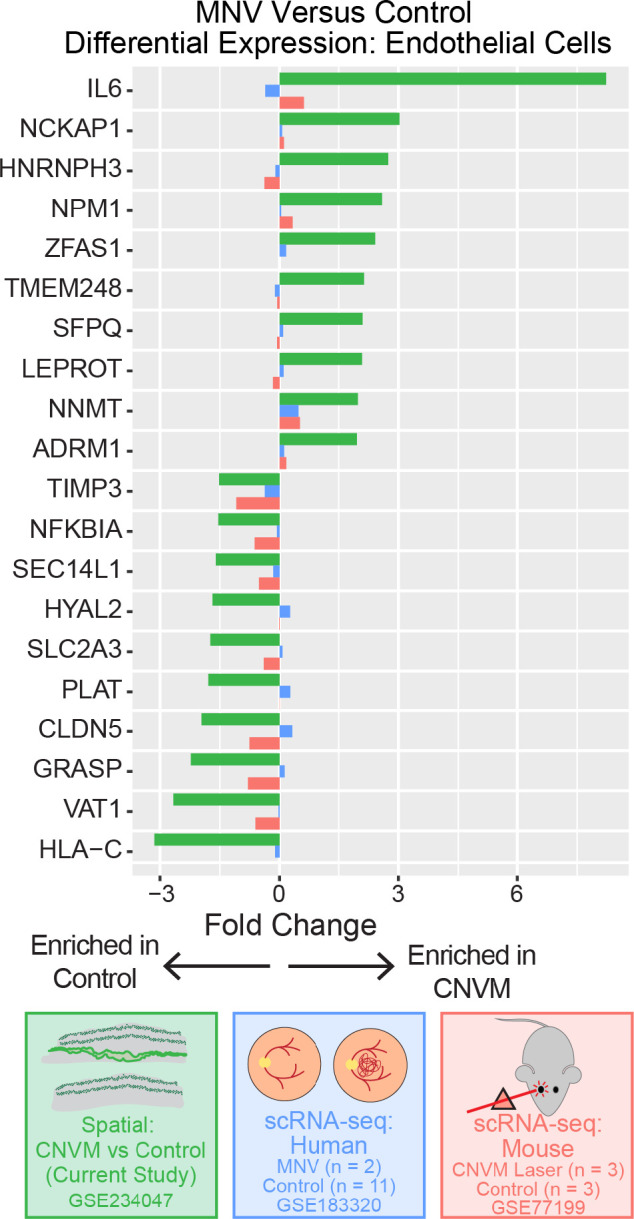
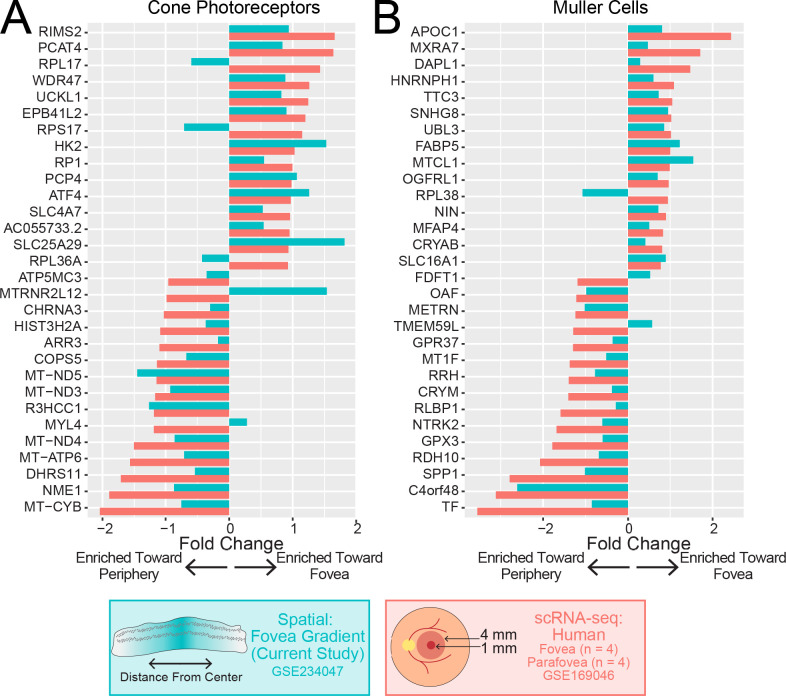
Macular neovascularization is a relatively common and potentially visually devastating complication of age-related macular degeneration. In macular neovascularization, pathologic angiogenesis can originate from either the choroid or the retina, but we have limited understanding of how different cell types become dysregulated in this dynamic process. In this study, we performed spatial RNA sequencing on a human donor eye with macular neovascularization as well as a healthy control donor. We identified genes enriched within the area of macular neovascularization and used deconvolution algorithms to predict the originating cell type of these dysregulated genes. Within the area of neovascularization, endothelial cells were predicted to increase expression of genes related to Rho family GTPase signaling and integrin signaling. Likewise, VEGF and TGFB1 were identified as potential upstream regulators that could drive the observed gene expression changes produced by endothelial and retinal pigment epithelium cells in the macular neovascularization donor. These spatial gene expression profiles were compared to previous single-cell gene expression experiments in human age-related macular degeneration as well as a model of laser-induced neovascularization in mice. As a secondary aim, we also investigated spatial gene expression patterns within the macular neural retina and between the macular and peripheral choroid. We recapitulated previously described regional-specific gene expression patterns across both tissues. Overall, this study spatially analyzes gene expression across the retina, retinal pigment epithelium, and choroid in health and describes a set of candidate molecules that become dysregulated in macular neovascularization.

Keywords: AMD; choroid; gene expression; neovascularization; spatial RNA sequencing.


Conflict of interest statement

CONFLICT OF INTEREST: No authors declare competing interests.

Figures

Figure 1:
Figure 1:. Gross, clinical and histological characterization of eyes used for spatial transcriptomic experiments.
Gross photos from the control (A) and MNV (B) donor after dissection. A. 4-mm punch was acquired centered on the fovea and approximately 12 mm superotemporal to the macula. While the macula of the healthy control donor appeared grossly normal (A), the MNV donor macula (B) demonstrated a disc-diameter area of elevated yellow material and atrophy. Near infrared scan (C) and optimal coherence tomography scan (D) of the right eye from the patient with macular neovascularization showing a broad, low-lying fibrovascular pigment epithelial detachment with “double-layer sign” (arrowhead). Reticular pseudodrusen (dark rounded profiles on near infrared scan) were noted superior to the lesion along the arcade vessels. Histological macular tissue sections from the control (E) and MNV (F) donor stained with hematoxylin-eosin. Note the thinning of the outer nuclear layer and fibrovascular membrane in the MNV eye. ONL = outer nuclear layer; IS, inner segments; OS, outer segments; NVM, neovascular membrane; BrM, Bruch’s membrane, CHO = choroid.
Figure 2:
Figure 2:. Spatial RNA sequencing of a control and MNV human donor macula.
A. Experimental overview: tissue sections from a control donor (n = 2 sections) and an MNV donor (n = 3 sections) were prepared for spatial RNA sequencing. After fixation and imaging, sections were permeabilized and cDNA libraries were prepared. Hematoxylin and eosin staining of one section of the control donor (B). The RNA contribution from retinal, RPE, and choroidal cell types was estimated in each spatially barcoded spot (C) and displayed as a pie-chart. (D) and (E) show a magnified view of the spot area in the macular (top) and peripheral (bottom) sections. Spots overlying the sclera were excluded from this visualization. F. Uniform manifold approximation and projection (UMAP) dimensionality reduction was applied to visualize clusters of spots with similar gene expression profiles. Each point represents the multidimensional transcriptomic profile from one spot, and points are colored according to the maximally predicted RNA contribution in each spatially barcoded spot. Clustering was visualized according to region (G), tissue (H), and percentage of the spot area that overlaps with the MNV membrane (I).
Figure 3:
Figure 3:. Gene expression in a human macular neovascular membrane.
A-C. The three macular sections from the MNV donor. The neovascular membrane (red outline) is traced in each tissue section and overlapping spot areas (black circles) are visualized. Note that the neovascular membrane spanned the entire section in each case. D. The percent area that each spot overlapped the MNV membrane was calculated. A total of 144 spots overlapped the lesion, ranging from <1% to 91% overlap. E. For all spots overlapping the MNV, the relative cell type composition was calculated. F. Design of differential expression analysis. Cell type deconvolution and percent area overlap with the MNV were used as covariates for differential expression analysis. G-J. After identifying genes enriched in MNV spots, ingenuity pathway analysis was used to identify canonical pathways (G, H) and upstream regulators (I, J) of genes predicted to originate from endothelial cells and RPE cells.
Figure 4:
Figure 4:. Comparison of MNV-enriched genes in endothelial cells with previous single-cell RNA sequencing studies.
Genes upregulated and downregulated in MNV-associated spots according to spatial RNA sequencing (green, current study) were compared to a previous single-cell RNA sequencing study of two human donors with MNV (blue) and a mouse model of choroidal neovascularization (red). Positive log2 fold-changes are associated with increased expression in the neovascular endothelial cells.
Figure 5:
Figure 5:. Comparison of regional retinal gene expression differences between spatial and single-cell RNA sequencing studies.
Differential expression was completed to compare genes enriched toward the center and towards the periphery of each section. For macular sections, the distance between each spot and the center of the slide was calculated and scaled from 0 to 1. Cell type deconvolution and distance from the center were used as covariates for differential expression analysis. For cone photoreceptor cells (A) and Muller cells (B), the top differentially expressed genes between the fovea and parafovea were identified from a previous single-cell RNA sequencing study. Differential expression results were compared between this previous study (red) and the current spatial study (blue). Positive log2 fold-changes are associated with increased expression towards the center of the retina.
Figure 6:
Figure 6:. Comparison of macular and peripheral gene expression between spatial and single-cell RNA sequencing studies.
Differential expression was completed to compare macular and peripheral enriched genes in the RPE and choroid. Cell type deconvolution and region were used as covariates for differential expression analysis. For RPE cells (A) and endothelial cells (B), the top differentially expressed genes between the macula and periphery were identified from a previous single-cell RNA sequencing study. Differential expression results were compared between this previous study (red) and the current spatial study (blue). Positive log2 fold-changes are associated with increased expression in the macula.

References

    1. Spaide RF, Jaffe GJ, Sarraf D, Freund KB, Sadda SR, Staurenghi G, Waheed NK, Chakravarthy U, Rosenfeld PJ, Holz FG, Souied EH, Cohen SY, Querques G, Ohno-Matsui K, Boyer D et al., Consensus Nomenclature for Reporting Neovascular Age-Related Macular Degeneration Data: Consensus on Neovascular Age-Related Macular Degeneration Nomenclature Study Group. Ophthalmology 127, 616–636 (2020). - PMC - PubMed
    1. Laiginhas R, Yang J, Rosenfeld PJ, Falcão M, Nonexudative Macular Neovascularization - A Systematic Review of Prevalence, Natural History, and Recent Insights from OCT Angiography. Ophthalmol Retina 4, 651–661 (2020). - PMC - PubMed
    1. Khanna S, Komati R, Eichenbaum DA, Hariprasad I, Ciulla TA, Hariprasad SM, Current and upcoming anti-VEGF therapies and dosing strategies for the treatment of neovascular AMD: a comparative review. BMJ Open Ophthalmol 4, e000398 (2019). - PMC - PubMed
    1. Golbaz I, Ahlers C, Stock G, Schütze C, Schriefl S, Schlanitz F, Simader C, Prünte C, Schmidt-Erfurth UM, Quantification of the therapeutic response of intraretinal, subretinal, and subpigment epithelial compartments in exudative AMD during anti-VEGF therapy. Investigative ophthalmology & visual science 52, 1599–1605 (2011). - PubMed
    1. Keane PA, Liakopoulos S, Ongchin SC, Heussen FM, Msutta S, Chang KT, Walsh AC, Sadda SR, Quantitative subanalysis of optical coherence tomography after treatment with ranibizumab for neovascular age-related macular degeneration. Investigative ophthalmology & visual science 49, 3115–3120 (2008). - PMC - PubMed

Publication types