[Preprint]. 2024 Jun 11:2023.06.08.23291168.
doi: 10.1101/2023.06.08.23291168.

The Genetic Architecture of Biological Age in Nine Human Organ Systems

Affiliations

The Genetic Architecture of Biological Age in Nine Human Organ Systems

Junhao Wen et al. medRxiv. .

Update in

Abstract

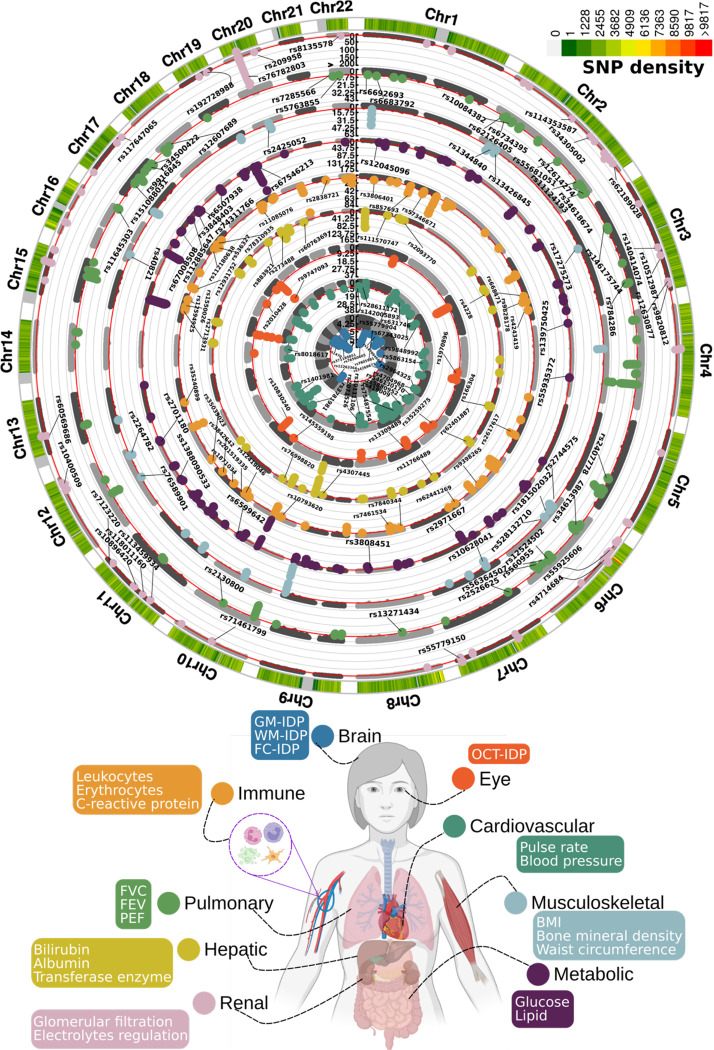
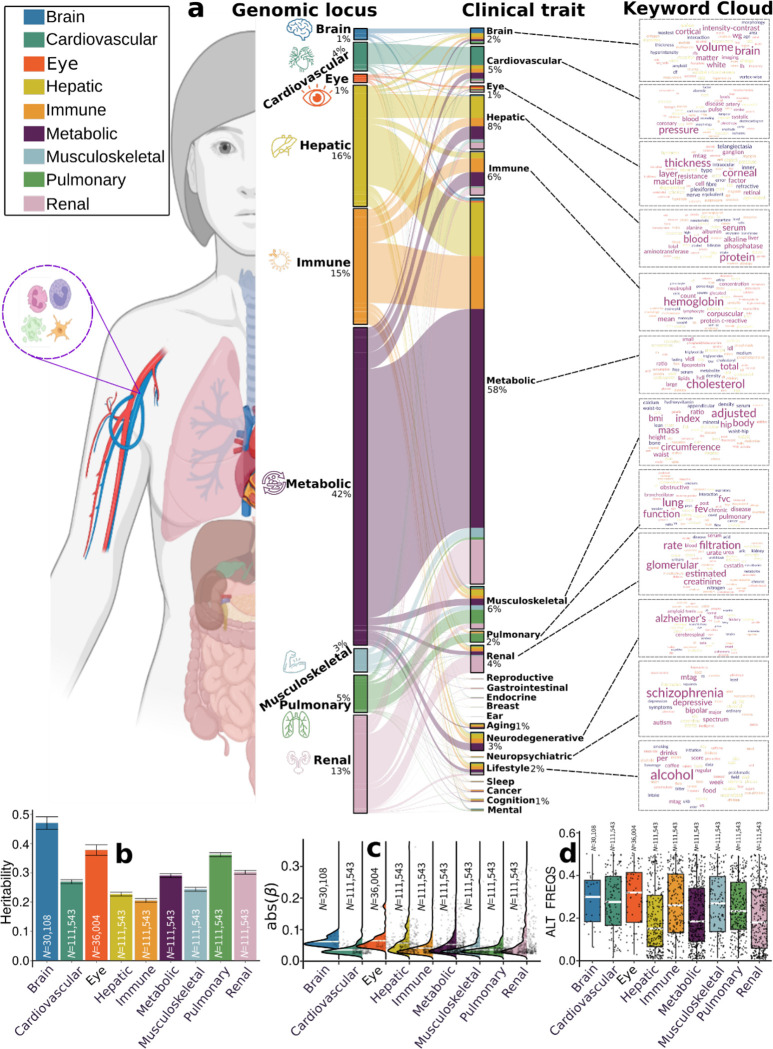
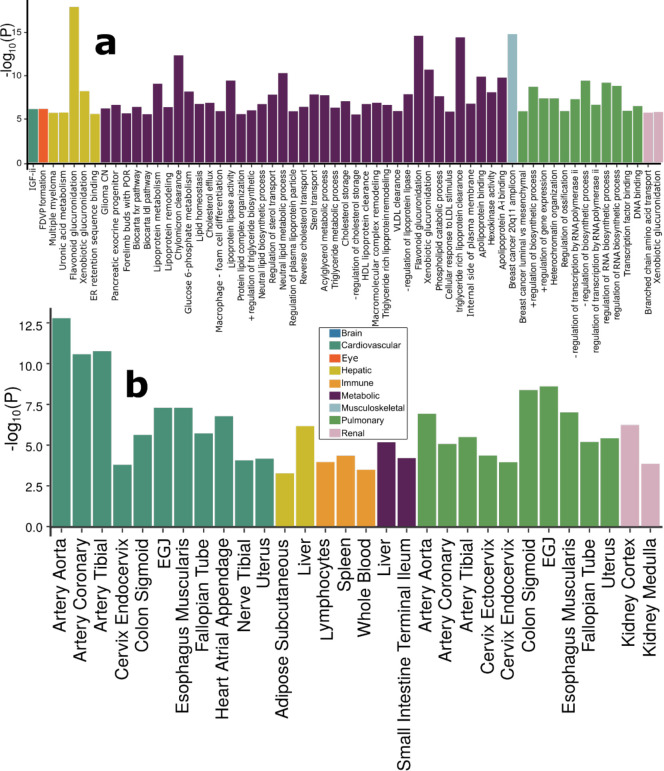
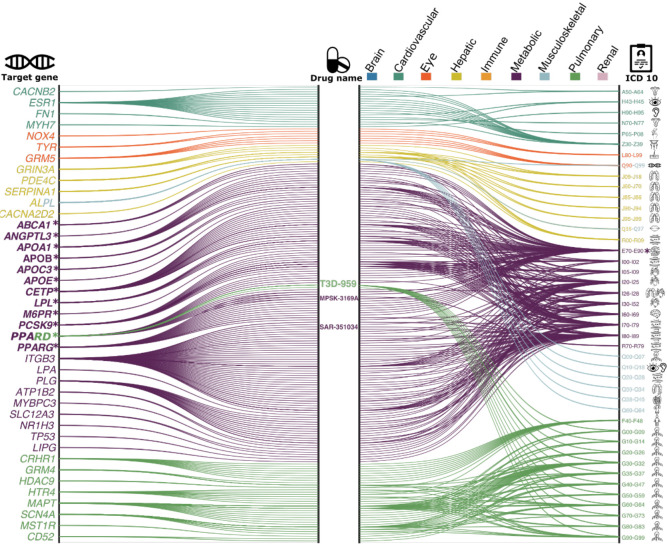
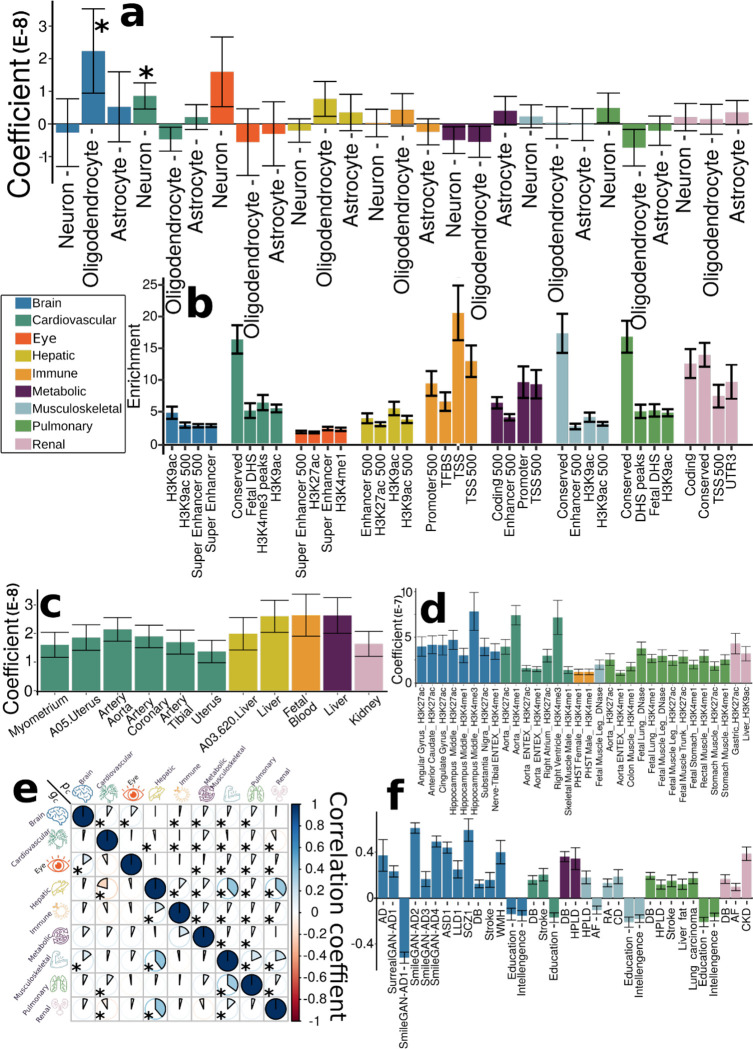
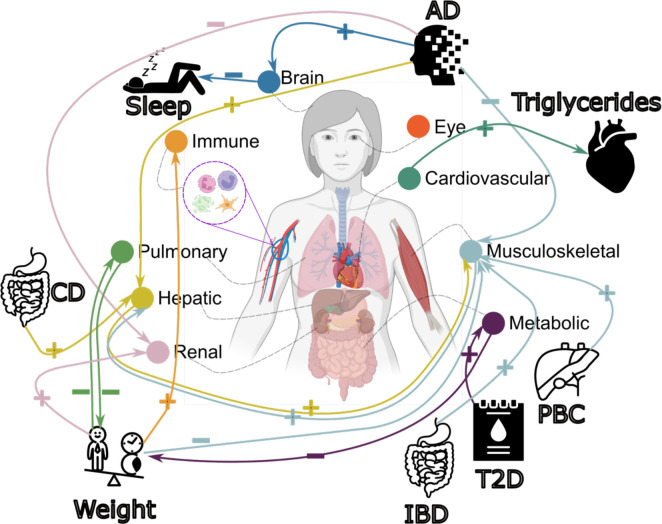
Understanding the genetic basis of biological aging in multi-organ systems is vital for elucidating age-related disease mechanisms and identifying therapeutic interventions. This study characterized the genetic architecture of the biological age gap (BAG) across nine human organ systems in 377,028 individuals of European ancestry from the UK Biobank. We discovered 393 genomic loci-BAG pairs (P-value<5×10⁻⁸) linked to the brain, eye, cardiovascular, hepatic, immune, metabolic, musculoskeletal, pulmonary, and renal systems. We observed BAG-organ specificity and inter-organ connections. Genetic variants associated with the nine BAGs are predominantly specific to the respective organ system while exerting pleiotropic effects on traits linked to multiple organ systems. A gene-drug-disease network confirmed the involvement of the metabolic BAG-associated genes in drugs targeting various metabolic disorders. Genetic correlation analyses supported Cheverud's Conjecture1 - the genetic correlation between BAGs mirrors their phenotypic correlation. A causal network revealed potential causal effects linking chronic diseases (e.g., Alzheimer's disease), body weight, and sleep duration to the BAG of multiple organ systems. Our findings shed light on promising therapeutic interventions to enhance human organ health within a complex multi-organ network, including lifestyle modifications and potential drug repositioning strategies for treating chronic diseases. All results are publicly available at https://labs-laboratory.com/medicine.


Conflict of interest statement

Competing Interests None

Figures

Figure 1:
Figure 1:. Genomic loci associated with the nine biological age gaps
Organ-specific biological age gap (BAG) was derived from a large cohort of 30,108 to 111,543 European ancestry participants from the UK Biobank cohort. The nine organ systems include the brain (N=30,108), cardiovascular (N=111,543), eye (N=36,004), hepatic (N=111,543), immune (N=111,543), metabolic (N=111,543), musculoskeletal (N=111,543), pulmonary (N=111,543), and renal (N=111,543) BAGs. 393 genomic loci-BAG pairs were identified using a genome-wide P-value threshold [–log10(P-value) > 7.30]. For visualization purposes, we denoted the genomic loci using their top lead SNPs that are not associated with any clinical traits in the EMBL-EBI GWAS Catalog. The anatomical illustration of the human body was created using BioRender.com. All analyses used the Genome Reference Consortium Human Build 37 (GRCh37). We present representative features employed in the calculation of each organ organ’s BAG. BMI: body mass index; IDP: imaging-derived phenotype; GM: gray matter; WM: white matter; FC: functional connectivity; OCT: optical coherence tomography; FVC: forced vital capacity; FEV: forced expiratory volume; PEF: peak expiratory flow.
Figure 2:
Figure 2:. Phenome-wide associations of the identified genomic loci and SNP-wide heritability estimates of the nine biological age gap
a) Phenome-wide association query of the identified genomic loci in the EMBL-EBI GWAS Catalog (query date: 24th April 2023, via FUMA version: v1.5.4) showed an organ-specific and inter-organ landscape. By examining the independent significant SNPs considering linkage disequilibrium (Method 3d) within each genomic locus, we linked them to various clinical traits. These traits were categorized into high-level groups encompassing different organ systems, neurodegenerative and neuropsychiatric disorders, and lifestyle factors. To visually represent the findings, we generated keyword cloud plots based on the frequency of these clinical traits within each BAG. The length of each rectangle block indicates the number of associations concerning the genomic loci in our analysis and clinical traits in the literature. The individual disease traits were categorized within their respective organ systems. However, this categorization doesn’t imply that the sum of these diseases exclusively represents the entirety of the organ system or that these diseases are solely associated with one specific organ system. Additional searches on alternative public GWAS platforms, such as the GWAS Atlas, are provided in Supplementary eText 2. b) Brain BAG is more heritable than other organ systems using GCTA. c) Brain BAG showed larger effect sizes of the independent significant SNPs than other organ systems. The kernel density estimate plot shows the distribution of the effect sizes (i.e., the magnitude of the linear regression β coefficients) in the nine GWAS. The white horizontal lines represent the mean effect sizes. d) The distribution of the alternative allele frequency (effect allele) for the nine BAGs. Of note, only independent significant SNPs were shown for each BAG in Figures c-d. All results in Figures b-d used the original full sample sizes of the nine BAGs; the brain, eye, and other body organ BAGs have different sample sizes. Error bars represent the standard error of the estimated parameters. Results for Figure b-d using the down-sampled sample sizes (N=30,108 of the brain BAG) are shown in Supplementary eFigure 12. ALT FREQS: allele frequency of the alternative (effective) allele.
Figure 3:
Figure 3:. Gene-level biological pathway annotation and tissue-specific gene expression
a) Validation of the nine BAGs in gene set enrichment analyses. Gene set enrichment analyses were performed using curated gene sets and GO terms from the MsigDB database. b) Validation of the nine BAGs in gene-property analyses. Gene-property analyses evaluate tissue-specific gene expressions for the nine BAG-related genes using the full SNP P-values distribution. Only significant gene sets are presented after adjusting for multiple comparisons using the Bonferroni correction. Abbreviation: EGJ: esophagus gastroesophageal junction.
Figure 4:
Figure 4:. Gene-drug-disease network of the nine biological age gaps
The gene-drug-disease network reveals a broad spectrum of gene, drug, and disease interactions across the nine BAGs, highlighting the metabolic-related genes. The ICD-10 code icons symbolize disease categories linked to the primary organ systems (e.g., G30 for Alzheimer’s disease in the CNS). All presented genes passed the nominal P-value threshold (<0.05) and were pharmaco-genetically associated with drug categories in the DrugBank database; the symbol * indicates gene-drug-disease interactions that survived the Bonferroni correction. Abbreviation: ICD: International Classification of Diseases; EGJ: esophagus gastroesophageal junction.
Figure 5:
Figure 5:. Partitioned heritability enrichment and genetic correlation of the nine biological age gaps
a) Cell type-specific partitioned heritability estimates for neurons, oligodendrocytes, and astrocytes. b) Partitioned heritability estimates for the general 53 functional categories. For visualization purposes, we only showed the four categories with the highest significant estimates for each BAG. The label for 500 denotes a 500-bp window around each of the 24 main annotations in the full baseline model, which prevents a biased estimate inflated by heritability in flanking regions. c) Tissue-specific partitioned heritability estimates using gene sets from multi-tissue gene expression data. d) Tissue and chromatin-specific partitioned heritability estimates using multi-tissue chromatin data. e) Cheverud’s Conjecture: the genetic correlation between two BAGs (gc, lower triangle) mirrors their phenotypic correlation (pc, upper triangle). f) Genetic correlations between the nine BAGs and 41 clinical traits, including chronic diseases and their subtypes involving multiple human organ systems, education, intelligence, and reaction time. The symbol * denotes Bonferroni-corrected significance; the absence of * indicates all results remain significant after correction. The standard error of the estimated parameters is presented using error bars. Abbreviation: AD: Alzheimer’s disease; ASD: autism spectrum disorder; LLD: late-life depression; SCZ: schizophrenia; DB: type 2 diabetes; WMH: white matter hyperintensity; HPLD: hyperlipidemia; AF: atrial fibrillation; RA: rheumatoid arthritis; CD: Crohn’s disease; CKD: chronic kidney disease.
Figure 6:
Figure 6:. Causal multi-organ network between the 9 biological age gaps and 17 clinical traits of chronic diseases, lifestyle factors, and cognition
We conducted two sets of Mendelian randomization analyses. Firstly, we examined the causal relationships between each pair of BAGs, excluding overlapping populations. Secondly, we investigated the causal associations between the 9 BAGs and the 17 unbiasedly selected clinical traits. Bi-directional analyses, including forward and inverse analyses on the exposure and outcome variables, were performed in all experiments. Significant tests were adjusted for multiple comparisons using the Bonferroni correction. Each colored arrow represents a potential causal effect connecting the exposure variable to the outcome variable. The symbol “+” denotes an OR larger than 1, while “−” represents an OR smaller than 1. Detailed OR and 95%CI information can be found in Supplementary eFigure 38 and eFile 19–20. It’s crucial to approach the interpretation of these potential causal relationships with caution despite our thorough efforts in conducting multiple sensitivity checks to assess any potential violations of underlying assumptions. Abbreviation: AD: Alzheimer’s disease; T2D: type 2 diabetes; PBC: primary biliary cholangitis; CD: Crohn’s disease; IBD: inflammatory bowel disease; CI: confidence interval; OR: odds ratio.

References

    1. Cheverud J. M. A COMPARISON OF GENETIC AND PHENOTYPIC CORRELATIONS. Evolution 42, 958–968 (1988). - PubMed
    1. Melzer D., Pilling L. C. & Ferrucci L. The genetics of human ageing. Nat Rev Genet 21, 88–101 (2020). - PMC - PubMed
    1. Tian Y. E. et al. Heterogeneous aging across multiple organ systems and prediction of chronic disease and mortality. Nat Med 1–11 (2023) doi:10.1038/s41591-023-02296-6. - DOI - PubMed
    1. Cohen A. A. et al. A complex systems approach to aging biology. Nat Aging 2, 580–591 (2022). - PMC - PubMed
    1. Hodson R. Precision medicine. Nature 537, S49–S49 (2016). - PubMed

Publication types