[Preprint]. 2023 Jun 15:2023.06.14.23291402.
doi: 10.1101/2023.06.14.23291402.

Rapid measurement and machine learning classification of color vision deficiency

Affiliations

Rapid measurement and machine learning classification of color vision deficiency

Jingyi He et al. medRxiv. .

Update in

Abstract

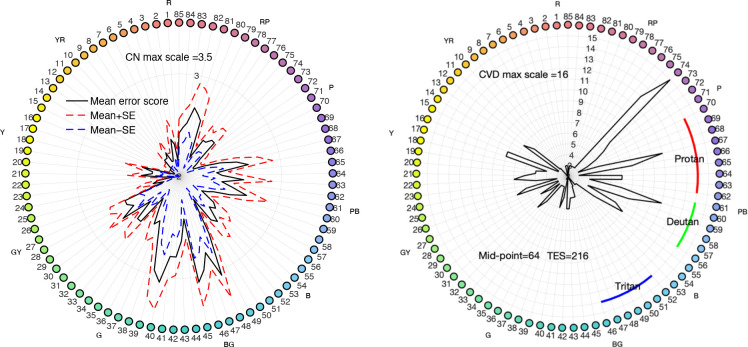
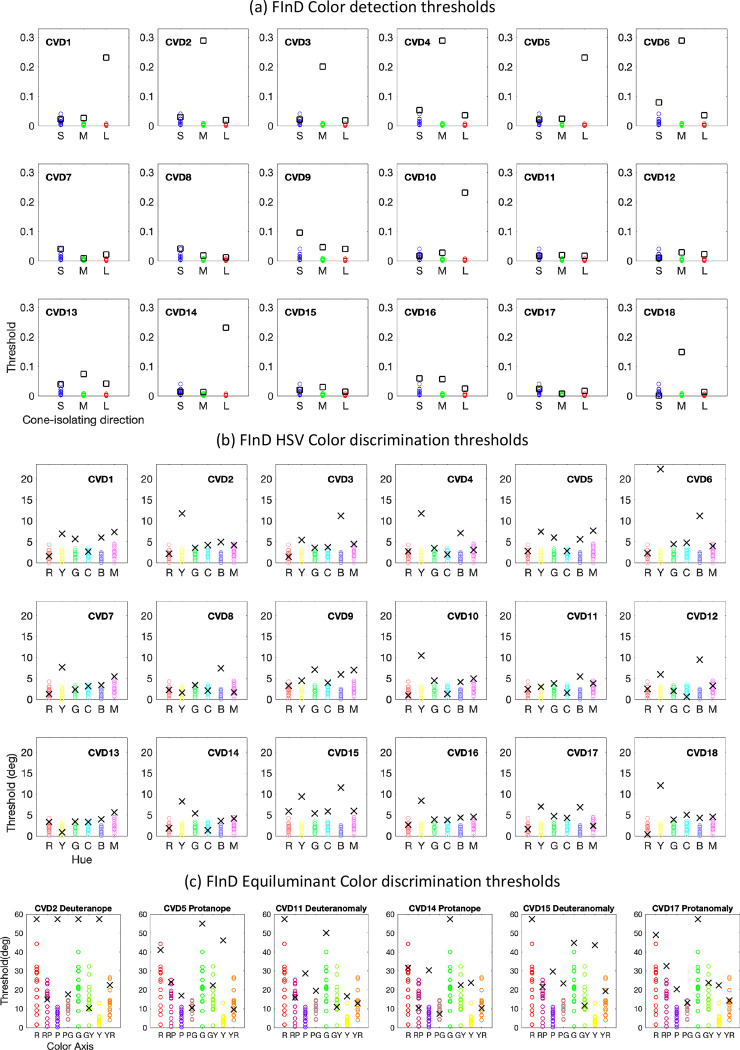
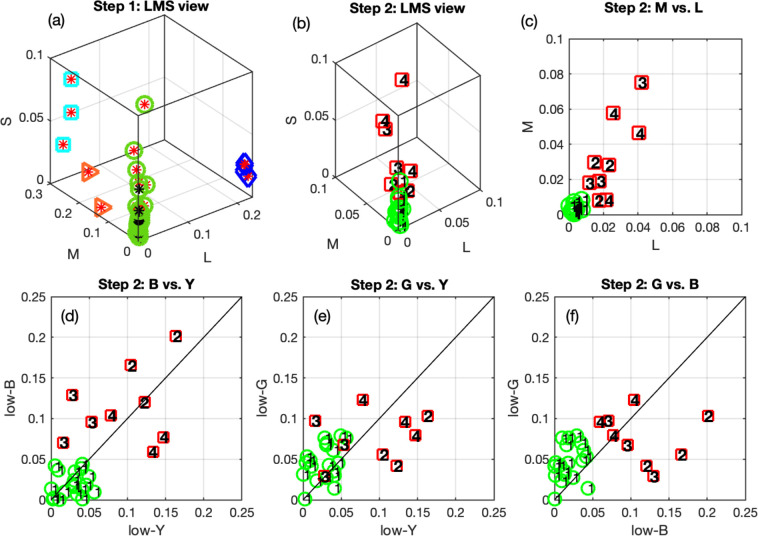
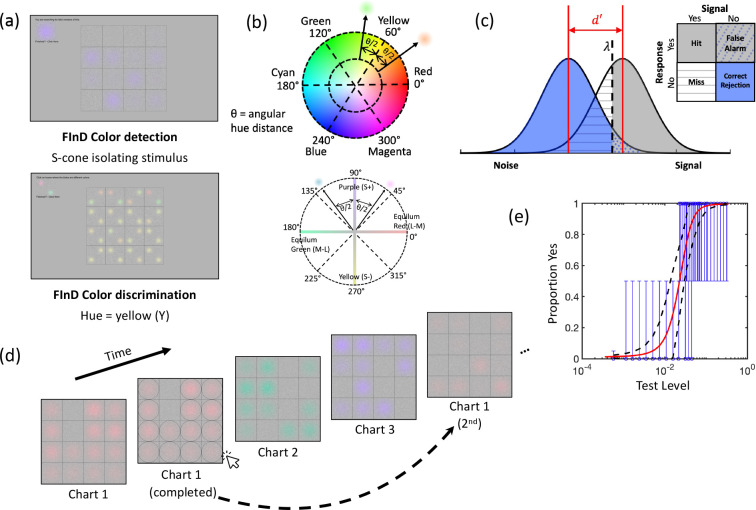
Color vision deficiencies (CVDs) indicate potential genetic variations and can be important biomarkers of acquired impairment in many neuro-ophthalmic diseases. However, CVDs are typically measured with insensitive or inefficient tools that are designed to classify dichromacy subtypes rather than track changes in sensitivity. We introduce FInD (Foraging Interactive D-prime), a novel computer-based, generalizable, rapid, self-administered vision assessment tool and applied it to color vision testing. This signal detection theory-based adaptive paradigm computes test stimulus intensity from d-prime analysis. Stimuli were chromatic gaussian blobs in dynamic luminance noise, and participants clicked on cells that contain chromatic blobs (detection) or blob pairs of differing colors (discrimination). Sensitivity and repeatability of FInD Color tasks were compared against HRR, FM100 hue tests in 19 color-normal and 18 color-atypical, age-matched observers. Rayleigh color match was completed as well. Detection and Discrimination thresholds were higher for atypical observers than for typical observers, with selective threshold elevations corresponding to unique CVD types. Classifications of CVD type and severity via unsupervised machine learning confirmed functional subtypes. FInD tasks reliably detect CVD and may serve as valuable tools in basic and clinical color vision science.


Conflict of interest statement

Competing interests

FInD is patented & owned by Northeastern University, USA. JS & PJB are founders of PerZeption Inc., to which the FInD method is exclusively licensed. JH declares that no competing interests exist.

Figures

Figure 1:
Figure 1:
FM100 hue test results. Left: average error score pattern of 19 CNs. Hues of colored caps are numbered from 1 to 85 with the corresponding mean error score (black line) and standard error range indicated along radial coordinates for each hue. Upper and lower standard error ranges are depicted by the red and blue dashed lines, respectively. The outermost circle where the color dots reside represents an error score of 3.5, and the center error score is 2, indicating the lowest possible error score. Right: error score pattern (black line) of an example CVD observer (CVD#5). Note that the largest radial scale is 16. Mid-point and TES of this observer as well as diagnostic curves (color arcs) are also shown. Mid-point of this observer falls in the protan range.
Figure 2:
Figure 2:
FInD Color detection and discrimination thresholds. Thresholds of all CN participants are plotted as colored circles in all panels as references, and thresholds of each CVD observer are denoted by black squares (detection) or crosses (discrimination) in separate panels. (a) FInD Color detection thresholds (upper panels) are plotted as cone contrast vector length and (b) low-saturation discrimination (lower panels) thresholds are plotted in degrees of HSV color space angle. (c) shows results of 6 CVD participants for the FInD Color discrimination task with equiluminant, colored stimuli.
Figure 3.
Figure 3.
Classification of CN and CVD results. (a) Step one clustering results illustrated in LMS detection threshold space. All 37 individual data points are shown. CVD and CN individuals are represented by red and black asterisks, respectively. Four clusters, denoted in differently shaped and colored symbols (green circles, blue diamonds, cyan squares, and orange triangles) around the asterisks, are identified. (b)-(f) show step two clustering results. Only individual points surrounded by green circles (n=28) in (a) are taken and plotted. These thresholds were clustered as four groups denoted by numbers. Red squares and green circles represent CVD and CN, respectively.
Figures 4.
Figures 4.
Illustration of FInD stimuli and experimental procedures. (a) FInD detection (top) and discrimination (bottom) task interfaces. (b) The top color wheel shows a cross-section of the HSV space for V=1, from which six hues (0° to 300° in 60° steps) and two saturation levels (0.5 and 1) were chosen and used in the discrimination task. If, for instance, yellow (60°) discrimination were tested, two colors are symmetrically selected the same angular hue distance (θ/2) away from yellow with a fixed saturation level. The bottom color wheel shows the equiluminance plane with four primary axes representing the red-green and blue-yellow postreceptoral mechanisms (c) Illustration of signal detection theory. The noise distribution (blue) and signal distribution (grey) bell curves lie on the normalized Z-score abscissa. Detectability or discriminability (d’) and criterion (λ) are depicted. The areas under the curves correspond to “hit”, “miss”, “false alarm”, and “correct rejection”, respectively, according to stimulus presentation and response. (d) FInD experimental procedures with cone isolating direction detection stimuli as an example. The dashed arrow represents the adaptive procedure that selects a range of stimulus intensities on the 2nd chart based on analysis of the responses to stimuli on the 1st chart. (e) An example of a typical psychometric function: blue data show the probability that the observer reported the presence of a stimulus as a function of intensity, vertical lines show binomial standard deviation, red curve shows the best fitting function for Eq.1, and black dashed lines represent upper and lower 95% confidence intervals. The separate data point on the left of other data points indicates the false alarm rate.

References

    1. Sharpe LT, Stockman A, Jägle H, Nathans J. Opsin genes, cone photopigments, color vision, and color blindness. Color vision: From genes to perception. 1999;351:3–52.
    1. Simunovic MP. Acquired color vision deficiency. Survey of Ophthalmology. 2016;61(2):132–55. - PubMed
    1. Zabel J, Przekoracka-Krawczyk A, Olszewski J, Michalak KP. Variability of Rayleigh and Moreland test results using anomaloscope in young adults without color vision disorders. Plos one. 2021;16(5):1–15. - PMC - PubMed
    1. Bailey JE, Neitz M, Tait DM, Neitz J. Evaluation of an updated HRR color vision test. Visual Neuroscience. 2004;21(3):431–6. - PubMed
    1. Cole BL, Lian Ky, Lakkis C. The new Richmond HRR pseudoisochromatic test for colour vision is better than the Ishihara test. Clinical and Experimental Optometry. 2006;89(2):73–80. - PubMed

Publication types