. 2023 Aug 7;222(8):e202208137.
doi: 10.1083/jcb.202208137. Epub 2023 Jul 3.

SUMOylation at the inner nuclear membrane facilitates nuclear envelope biogenesis during mitosis

Affiliations

SUMOylation at the inner nuclear membrane facilitates nuclear envelope biogenesis during mitosis

Natasha O Saik et al. J Cell Biol. .

Abstract

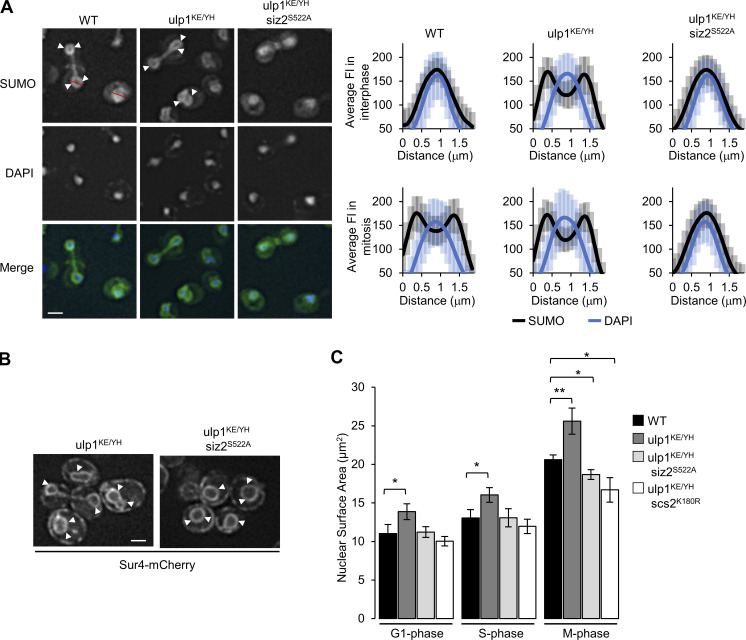
As eukaryotic cells progress through cell division, the nuclear envelope (NE) membrane must expand to accommodate the formation of progeny nuclei. In Saccharomyces cerevisiae, closed mitosis allows visualization of NE biogenesis during mitosis. During this period, the SUMO E3 ligase Siz2 binds the inner nuclear membrane (INM) and initiates a wave of INM protein SUMOylation. Here, we show these events increase INM levels of phosphatidic acid (PA), an intermediate of phospholipid biogenesis, and are necessary for normal mitotic NE membrane expansion. The increase in INM PA is driven by the Siz2-mediated inhibition of the PA phosphatase Pah1. During mitosis, this results from the binding of Siz2 to the INM and dissociation of Spo7 and Nem1, a complex required for the activation of Pah1. As cells enter interphase, the process is then reversed by the deSUMOylase Ulp1. This work further establishes a central role for temporally controlled INM SUMOylation in coordinating processes, including membrane expansion, that regulate NE biogenesis during mitosis.


Conflict of interest statement

Disclosures: The authors declare no competing interests exist.

Figures

Figure S1.
Figure S1.
Siz2 localization and Siz2-mediated SUMOylation events at the NE during mitosis. (A) WT and siz2S522A cells were arrested in G1-phase (0 min) using α-factor, released from arrest, and then analyzed every 20 min by Western blotting to detect SUMO conjugates, Clb2, and the Gsp1 load control. Clb2 levels peak in metaphase. Arrowheads point to prominent SUMOylated species between 40 and 55 kD in WT cells, which increase in mitosis (peak at 60 min) and decay in G1-phase. (B) Representative epifluorescence images are shown for metaphase-arrested MET3pr-HA3-CDC20 cells (2 h after methionine addition) producing either GFP-Siz2 or GFP-siz2S522A. Sur4-mCherry is an NE/ER marker. Arrowheads highlight GFP-Siz2 at the NE. The nuclear distribution of GFP-Siz2 or GFP-siz2S522A relative to Sur4-mCherry was determined using line scan intensities of equatorial optical sections through nuclei. Plots show average fluorescence intensity (FI) for GFP and mCherry at multiple points along a 1.85-µm line for n = 25 nuclei. Size bar, 2 µm. Error bars are SD. (C) Cell lysates derived from asynchronous (0) or metaphase-arrested (2 h) cultures of indicated strains were analyzed by Western blotting to assess SUMO conjugate profiles and levels of the indicated proteins. Gsp1 is a loading control. Mass markers are shown in kilodaltons. Source data are available for this figure: SourceData FS1.
Figure 1.
Figure 1.
NE association of Siz2 during mitosis supports NE expansion. (A and B) Graphs display the average nuclear surface area across cell cycle stages determined from epifluorescence z-stack images of WT and siz2S522A cells producing nuclear Pus1-GFP. Nuclear surface areas (µm2) were measured using Imaris-based surface analysis. For A, asynchronously grown cells were binned into the indicated cell cycle phase based on bud size and nuclear morphology. For B, WT and siz2S522A cells were arrested in G1-phase (0 min) using α-factor, released into the cell cycle, and then collected and imaged at the indicated times to determine nuclear surface areas. (C) Representative epifluorescence images are shown for WT and siz2S522A mutant cells containing integrated MET3pr-HA3-CDC20 and producing the NE/ER membrane protein marker Sur4-mCherry following metaphase arrest induced by methionine addition for 2 h. Arrowheads point to the NE. Size bar, 2 µm. (D) Measured nuclear surface areas of metaphase-arrested cells from the indicated strains as determined in A. Graphs in A, B, and D show data from three biological replicates and 50 cells/replicate/cell cycle stage or time point. Error bars are SD. Asterisks denote a significant change in siz2S522A and scs2K180R containing cells relative to the WT counterpart as determined using a two-tailed Student’s t test. *p ≤ 0.05, **p ≤ 0.01.
Figure 2.
Figure 2.
Constitutive association of Siz2 with the NE induces SUMOylation and increases nuclear surface area. (A) WT cells producing Siz2-GFP1-10 and a plasmid-encoded GFP11-mCherry-TM (GFP11(nucleo/cyto)) or mCherry-TM-GFP11 (GFP11(NE/ER lumen)) fusion protein were examined by epifluorescence microscopy. The membrane-integrated GFP11 fusion proteins allow for the visualization of NE/ER morphology by mCherry fluorescence. Formation of GFP1-10-GFP11 dimers was visualized by GFP fluorescence. Arrowheads point to GFP fluorescence at the NE in several cells. Size bar, 2 µm. (B) WT cells or cells producing Siz2-GFP1-10 and GFP11-mCherry-TM (GFP11(nucleo/cyto)) were arrested in G1-phase using α-factor, released from arrest, and then analyzed every 10 min by Western blotting to detect SUMO conjugates, Clb2, and the Gsp1 load control. Clb2 levels peak in mitosis. Note, Western blot images of samples from the Siz2-GFP1-10/GFP11 strain were derived from the same blot. (C and H) SUMO conjugate profiles of the indicated strains were assessed by Western blotting of cell lysates derived from asynchronous cultures. Images shown were derived from the same Western blot. (D) siz2Δ mutant cells containing plasmid-encoded GFP11-mCherry-TM (GFP11(nucleo/cyto)) and a plasmid expressing the siz2RING-GFP1-10 mutant from a copper-inducible promoter were examined by epifluorescence microscopy 4 h after 0.5 mM Cu2+ addition. GFP and mCherry fluorescence was visualized as described in A. Arrowheads point to GFP fluorescence at the NE in several cells. Size bars, 2 µm. (E) Cultures of cells producing Siz2-GFP1-10 and plasmid-encoded GFP11-mCherry-TM (GFP11(nucleo/cyto)) and siz2Δ mutant cells producing plasmid-encoded siz2RING-GFP1-10 and GFP11-mCherry-TM (GFP11(nucleo/cyto)) (described in D) were incubated in the presence or absence of 0.5 mM Cu2+ for 4 h. SUMO conjugates and the GFP1-10 fusions were detected by Western blotting. Note, following induction, the CUP1pr-siz2RING-GFP1-10 gene produced levels of siz2RING-GFP1-10 similar to Siz2-GFP1-10. (F and I) Nuclear surface areas of WT (F) and scs2K180R mutant (I) cells expressing the specified constructs at the indicated cell cycle stage were determined using Pus1-GFP as described in Fig. 1 A. (G) Pus1-GFP was introduced into the two strains described in E and nuclear surface areas of cells were examined after Cu2+ induction. Note, arrowheads on Western blots in B, C, E, and H point to SUMOylated Scs2 (red) and/or three prominent Siz2-dependent INM SUMO conjugates (blue; Ptak et al., 2021). Mass markers are shown in kilodaltons. Error bars for all graphs shown are SD, and p values were determined using a two-tailed Student’s t test for the indicated sample pairs. *p ≤ 0.05, **p ≤ 0.01. Source data are available for this figure: SourceData F2.
Figure 3.
Figure 3.
Ulp1 restricts nuclear membrane expansion. (A) Anti-SUMO immunofluorescence analysis of WT, ulp1K352E/Y583H-V53 (termed ulp1KE/YH), and ulp1KE/YH siz2S522A mutant cells. Arrowheads highlight SUMO along the NE, with nuclear position determined by DAPI staining. Nuclear distribution of anti-SUMO immunofluorescence relative to a DAPI signal was determined using line scan intensities of equatorial optical sections through the nuclei (see red line for example) of interphase (unbudded or small budded) and mitotic (large budded) cells. Each plot shows average fluorescence intensity (FI) for anti-SUMO immunofluorescence signal and DAPI at multiple points along a 1.85-µm line for n = 25 nuclei. Size bar, 2 µm. Error bars are SD. (B) Representative epifluorescence images of ulp1KE/YH and ulp1KE/YH siz2S522A mutant cells producing the NE/ER marker Sur4-mCherry. Size bar, 2 µm. Arrowheads point to the NE. (C) Nuclear surface area of the indicated strains was determined using Pus1-GFP as described in Fig. 1 A at the indicated cell cycle stage. Note, the results shown here and in Fig. 1 A were obtained at the same time, and the data from the WT strain are reproduced here. The data represent three biological replicates and n = 50 cells/replicate/cell cycle stage. Error bars are SD. P values were determined using a two-tailed Student’s t test for the indicated sample pairs. *p ≤ 0.05, **p ≤ 0.01.
Figure S2.
Figure S2.
Siz2 localization to the NE in ulp1KE/YH mutant cells. (A) Representative epifluorescence images for the indicated strains producing either GFP-Siz2 or GFP-siz2S522A. Sur4-mCherry is an NE/ER marker. Size bar, 2 µm. (B) The nuclear distribution of GFP-Siz2 or GFP-siz2S522A relative to Sur4-mCherry was determined using line scan intensities as described for Fig. S1 B. Error bars are SD.
Figure 4.
Figure 4.
The NE association of Siz2 during mitosis is required for enrichment of PA at the INM. WT and siz2S522A mutant cells producing Pus1-GFP and a nuclear NLS-PA sensor protein (NLS-Opi1(Q2)-mCherry) were examined by epifluorescence microscopy. (A and B) Representative images of interphase (A) and mitotic (B) cells in actively growing cultures are shown. (C) A MET3pr-HA3-CDC20 cassette was integrated into WT, siz2S522A, and scs2K180R strain backgrounds. These cells were arrested in metaphase by methionine addition for 2 h and the localization of the NLS-PA sensor and Pus1-GFP was examined. In each panel, nuclear distribution of the NLS-PA sensor protein (mCherry) and Pus1-GFP was determined using line scan intensities as described in the Fig. 3 A legend. Arrowheads highlight the NLS-PA sensor along the INM. Error bars are SD. Size bar, 2 µm.
Figure S3.
Figure S3.
Cellular distribution of PA and DAG in WT and siz2S522A mutant cells. (A) Asynchronous cultures of WT cells producing Pus1-GFP and the cytoplasmic (cyto)-PA sensor protein (Opi1(Q2)-mCherry; Romanauska and Köhler, 2018) were examined by epifluorescence microscopy. Representative images of interphase and mitotic cells from actively growing cultures are shown. Size bar, 2 µm. (B) WT and siz2S522A mutant cells containing MET3pr-HA3-CDC20 and producing Pus1-GFP and the cyto-PA sensor were arrested in metaphase, and the distribution of the cyto-PA sensor was examined. Representative images are shown. Size bar, 2 µm. (C–E) WT (C) and siz2S522A mutant (D) cells producing Pus1-GFP and the NLS-DAG-sensor protein (PKCβ(C1a+C1B)-mCherry; Romanauska and Köhler, 2018) were examined by epifluorescence microscopy. Representative images of interphase and mitotic cells from actively growing cultures are shown. In E, WT and siz2S522A mutant cells containing MET3pr-HA3-CDC20 and producing Pus1-GFP and the NLS-DAG-sensor protein were arrested in metaphase by methionine addition. Images show the distribution of the NLS-DAG sensor protein and nuclear Pus1-GFP at 2 h after methionine addition. In C–E, the line scan intensities of the NLS-DAG sensor protein (mCherry) and Pus1-GFP were obtained as described in the Fig. 3 A legend for the indicated strains. Error bars are SD. Arrowheads highlight the NLS-DAG sensor protein along the INM. Size bar, 2 µm. (F) Cell lysates derived from asynchronous (0 h) or metaphase-arrested (2 h after methionine addition) cultures of indicated strains were analyzed by Western blotting to assess SUMO conjugate profiles. (G) Cell lysates derived from asynchronous cultures of the indicated strains were assessed by Western blotting using an anti-SUMO antibody to visualize SUMO conjugate profiles. Gsp1 is a loading control. (H) Asynchronous (0 h) or metaphase-arrested (2 h) cultures of WT and siz2S522A mutant cells containing the MET3pr-HA3-CDC20 cassette and expressing PAH1-PrA were prepared as described in the Fig. S1 legend. Cell lysates were analyzed by Western blotting to detect Pah1-PrA. The position of phosphorylated forms of Pah1-PrA is indicated by a dot. Mass markers are shown in kilodaltons. Source data are available for this figure: SourceData FS3.
Figure 5.
Figure 5.
INM enrichment of PA is induced by Siz2-mediated NE SUMOylation. (A) WT cells producing nucleoplasmic Pus1-GFP, the NLS-PA sensor (mCherry), and Siz2-GFP1-10 along with either the plasmid-encoded GFP11-TM (GFP11(nucleo/cyto)) or TM-GFP11 (GFP11(NE/ER lumen)) reporter were examined by epifluorescence microscopy. Images show the localization of Pus1-GFP and the NLS-PA sensor (mCherry) in representative interphase and mitotic cells from actively growing cultures. Arrowheads point to the NLS-PA sensor enriched at the NE. Note, the NE signal of the Siz2-GFP1-10-GFP11(nucleo/cyto) dimer is not visible due to the abundance of nucleoplasmic Pus1-GFP. (B and C) The nuclear distribution of the NLS-PA sensor protein (mCherry) and Pus1-GFP was similarly examined in interphase and mitotic cells present in asynchronous cultures of ulp1KE/YH (B) and ulp1KE/YH siz2S522A (C) mutant strains. Arrowheads highlight the NLS-PA sensor protein along the INM. The nuclear distributions of the NLS-PA sensor protein (mCherry) and Pus1-GFP were determined using line scan intensities (n = 25 nuclei) as described in the Fig. 3 A legend. Error bars are SD. Size bar, 2 µm.
Figure 6.
Figure 6.
Pah1 activity antagonizes Siz2-mediated increases in nuclear surface area. (A) WT cells producing Pus1-GFP, the nuclear NLS-PA sensor protein, and containing integrated MET3pr-HA3-CDC20 were transformed with plasmids containing PAH1-PrA or the pah17A-PrA mutant gene. Note that these protein A (PrA) fusions are designated simply as Pah1 and pah17A throughout the figure. Cells were arrested in metaphase by methionine addition for 2 h, and the localization of the NLS-PA sensor and Pus1-GFP were examined by epifluorescence microscopy. A representative image of a metaphase-arrested cell is shown for each strain (left; Size bar, 2 µm). Arrowheads highlight the NLS-PA sensor protein along the INM. The nuclear distributions of the NLS-PA sensor protein (mCherry) and Pus1-GFP were determined using line scan intensities (right, n = 25 nuclei) as described in the Fig. 3 A. Error bars are SD. (B) These same strains were arrested in metaphase and the nuclear surface area of individual cells was determined using Pus1-GFP as described for Fig. 1 A. The data represent three biological replicates and n = 50 cells/replicate/cell cycle stage. Error bars are SD, and p values were determined using a two-tailed Student’s t test for the indicated sample pairs. ***p ≤ 0.001. (C) WT cells producing Pus1-GFP, and a nuclear NLS-PA sensor protein, were transformed with plasmids containing PAH1-PrA or the pah17A-PrA mutant. Cells from asynchronously growing cultures were examined by epifluorescence microscopy and representative images of interphase and mitotic cells are shown (left, size bar, 2 µm). Arrowheads highlight the NLS-PA sensor protein at the INM. Nuclear distributions of the NLS-PA sensor protein and Pus1-GFP were quantified as in A. (D) Nuclear surface areas of WT or the ulp1KE/YH mutant cells expressing exogenous PAH1-PrA or the pah17A-PrA mutant were determined at the indicated cell cycle stage using Pus1-GFP as described in Fig. 1 A. The data represent three biological replicates and n = 50 cells/replicate/cell cycle stage. Error bars are SD. Asterisks indicate a significant difference relative to WT cells expressing exogenous PAH1 as determined using a two-tailed Student’s t test. *p ≤ 0.05.
Figure 7.
Figure 7.
Phenotypes associated with altered INM SUMOylation are functionally linked to Pah1 activity. (A) Indicated strains containing MET3pr-HA3-CDC20 and producing Pus1-GFP were arrested in metaphase by the depletion of Cdc20. Nuclear surface areas of metaphase-arrested cells were determined as described for Fig. 1 A. (B) ulp1KE/YH mutant cells producing Pus1-GFP, and the NLS-PA sensor protein, were transformed with plasmids containing PAH1-PrA or the pah17A-PrA mutant. Note, these protein A (PrA) fusions are designated simply as Pah1 and pah17A. Representative images of interphase and mitotic cells in actively growing cultures are shown. Arrowheads highlight the NLS-PA sensor protein along the INM. The nuclear distributions of the NLS-PA sensor and Pus1-GFP (n = 25 nuclei) were determined using line scan intensities as described in the Fig. 3 A legend. Error bars are SD. Size bar, 2 µm. (C–E) Nuclear surface areas of the indicated strains from asynchronous cultures were determined using Pus1-GFP as described for Fig. 1 A. Data in D and E were obtained at the same time and data for WT and ulp1KE/YH samples are reproduced in both panels for comparison. Data in A and C–E are from three biological replicates per strain, with 50 cells/replicate/cell cycle stage. Error bars are SD. Asterisks denote significant change in nuclear surface area relative to the indicated counterpart as determined using a two-tailed Student’s t test. *p ≤ 0.05, **p≤ 0.01, ***p ≤ 0.001.
Figure S4.
Figure S4.
Localization, levels, and interactions of the Spo7/Nem1 complex. (A) Spo7 and Nem1 localization was assessed using the split-superfolder GFP system. WT cells producing GFP1-10-Spo7 or GFP1-10-Nem1, as well as plasmid-encoded GFP11-mCherry-Pus1 (GFP11(nucleo)) or mCherry-TM-GFP11 (GFP11(NE/ER lumen)), were examined by epifluorescence microscopy. Localization of the GFP11 reporter was visualized by mCherry fluorescence. Formation of GFP1-10-GFP11 dimers was visualized by GFP fluorescence. Arrowheads point to GFP fluorescence at the NE. Size bar, 2 µm. (B) WT cells producing Spo7-TAP (SPO7-TAP NEM1-V53) were arrested with α-factor and then released into the cell cycle for 0 min (G1-phase) and 60 min (mitosis). Whole-cell lysates (WCL) and loads (soluble extracts of WCL used for the affinity-purification of Spo7-TAP) were analyzed by Western blotting (WB) to detect Spo7-TAP. Load fractions are also shown from SIZ2 and siz2S522A cells at the indicated cell cycle stages. In each case, samples compared are derived from equal amounts of total cells. Note, levels of Spo7-TAP in the load fractions are similar in each of the conditions examined. (C) Purification and analysis procedures outlined in Fig. 8 were used to analyze Spo7-TAP-bound Ice2-V53 in WT (SIZ2) and siz2S522A cells (each containing the MET3pr-HA3-CDC20 cassette) and arrested in G1-phase with α-factor or in metaphase by the depletion of Cdc20 (2 h after methionine addition). Shown are levels of Ice2-V53 present in the load and elution fractions, and Spo7-TAP bound beads. Note that images shown in each panel were derived from the same Western blot. Black lines indicate that intervening lanes have been spliced out in the top two panels. Adjacent bar graphs in each panel show quantification of the ratio Ice2-V53 bound (Eluate) to purified Spo7-TAP (Bound) in 3 affinity purification experiments (see Fig. 8 legend and Materials and methods). Mass markers are shown in kilodaltons. Error bars are SD. Source data are available for this figure: SourceData FS4.
Figure 8.
Figure 8.
Binding of Siz2 to the INM during mitosis inhibits the interaction of Pah1 with the Spo7/Nem1 complex. (A and C) WT (SIZ2) and siz2S522A mutant cells, each expressing SPO7-TAP and PAH1-MYC13, were arrested in G1-phase with α-factor (0 min) and then released from arrest and allowed to proceed into mitosis (60 min after release). At 0 and 60 min after release, equal amounts of cells were lysed and Spo7-Tap was affinity-purified from lysate fractions (Load). Pah1-Myc13 was released from purified Spo7-Tap using sequential MgCl2 elution steps, which were then pooled into a single fraction (Eluate). Bead-bound Spo7-Tap was finally released with 0.5 M acetic acid (Bound; see Materials and methods for details). Equivalent percentages of the load, eluate, and bound fractions were examined by Western blotting (WB) to detect the TAP and Myc13 tag. (B and D) The same purification and analysis procedures described above were used to analyze Spo7-TAP-bound Pah1-V53 in WT (SIZ2) and siz2S522A cells (each containing the MET3pr-HA3-CDC20 cassette) and arrested in G1-phase with α-factor or in metaphase by the depletion of Cdc20 (2 h after methionine addition). Mass markers are shown in kilodaltons. Adjacent bar graphs in each panel show the average relative ratio of Pah1 bound (Eluate) to purified Spo7-TAP (Bound) from three affinity purification experiments, with the ratio of Pah1 to Spo7-TAP in G1 cells (0 min and G-1 arrested) assigned a value of 1 (see Materials and methods). Error bars are SD, and p values were determined using a Student’s paired t test. **p ≤ 0.01. Source data are available for this figure: SourceData F8.
Figure 9.
Figure 9.
Mitotic SUMOylation events reduce interactions between Spo7 and Nem1. (A and C) WT (SIZ2) and siz2S522A mutant cells, each expressing SPO7-TAP and NEM1-V53, were arrested in G1-phase with α-factor (0 min) and then released from arrest and allowed to proceed into mitosis (60 min after release). Spo7-Tap was affinity-purified and bound Nem1-V53 was examined at both time points as described in the Fig. 8 legend. (B and D) Results of the same purification and analysis procedures used to analyze Spo7-TAP-bound Nem1-V53 in WT (SIZ2) and siz2S522A cells (each containing the MET3pr-HA3-CDC20 cassette) and arrested in G1-phase with α-factor or in metaphase by the depletion of Cdc20 (2 h after methionine addition). Adjacent bar graphs in each panel show quantification of the average relative ratio of Nem1-V53 bound (Eluate) to purified Spo7-TAP (Bound) from three affinity purification experiments (see Fig. 8 legend and Materials and methods). Mass markers are shown in kilodaltons. Error bars are SD, and p values were determined using a Student’s paired t test. *p ≤ 0.05, **p ≤ 0.01. Source data are available for this figure: SourceData F9.
Figure 10.
Figure 10.
Siz2-mediated SUMOylation events reduce Spo7 interactions with Pah1 and Nem1. (A and B) WT, ulp1KE/YH, and ulp1KE/YH siz2S522A mutant cells producing Spo7-TAP and either Pah1-Myc13 (A) or Nem1-V53 (B) were harvested from asynchronous cultures and lysed. Spo7-Tap affinity purification and analysis of bound Pah1-Myc13 or Nem1-V53 were performed as outlined the Fig. 8 legend. Mass markers are shown in kilodaltons. All ulp1KE/YH mutant genes also encode a C-terminal GFP tag. Note that images shown in B, middle row, were derived from the same Western blot. Black lines indicate that intervening lanes have been spliced out. Quantification of affinity purification experiments is shown in the adjacent bar graphs and was performed as described in Fig. 8 with data representing three separate affinity purification experiments. Error bars are SD. Asterisks indicate a significant difference relative to WT as determined using a Student’s paired t test. *p ≤ 0.05. Source data are available for this figure: SourceData F10.
Figure S5.
Figure S5.
Nuclear surface area of mutant cells that disrupt chromatin anchoring. Nuclear surface areas of metaphase-arrested cells from the indicated strains were determined as described in Fig. 1 A. Graphs show data from three biological replicates and 50 cells/replicate/cell cycle stage. Error bars are SD. Asterisks indicate a significant difference relative to WT as determined using a two-tailed Student’s t test. **p ≤ 0.01. No significant change (N.S.) between WT and the sir4K1037R mutant cells was observed.

Comment in

References

    1. Alber, F., Dokudovskaya S., Veenhoff L.M., Zhang W., Kipper J., Devos D., Suprapto A., Karni-Schmidt O., Williams R., Chait B.T., et al. . 2007. The molecular architecture of the nuclear pore complex. Nature. 450:695–701. 10.1038/nature06405 - DOI - PubMed
    1. Barbosa, A.D., Lim K., Mari M., Edgar J.R., Gal L., Sterk P., Jenkins B.J., Koulman A., Savage D.B., Schuldiner M., et al. . 2019. Compartmentalized synthesis of triacylglycerol at the inner nuclear membrane regulates nuclear organization. Dev. Cell. 50:755–766.e6. 10.1016/j.devcel.2019.07.009 - DOI - PMC - PubMed
    1. Brachmann, C.B., Davies A., Cost G.J., Caputo E., Li J., Hieter P., and Boeke J.D.. 1998. Designer deletion strains derived from Saccharomyces cerevisiae S288C: a useful set of strains and plasmids for PCR-mediated gene disruption and other applications. Yeast. 14(2):115–132. 10.1002/(SICI)1097-0061(19980130)14:2<115::AID-YEA204>3.0.CO;2-2 - DOI - PubMed
    1. Brickner, J.H., and Walter P.. 2004. Gene recruitment of the activated INO1 locus to the nuclear membrane. PLoS Biol. 2:e342. 10.1371/journal.pbio.0020342 - DOI - PMC - PubMed
    1. Campbell, J.L., Lorenz A., Witkin K.L., Hays T., Loidl J., and Cohen-Fix O.. 2006. Yeast nuclear envelope subdomains with distinct abilities to resist membrane expansion. Mol. Biol. Cell. 17:1768–1778. 10.1091/mbc.e05-09-0839 - DOI - PMC - PubMed

Publication types

MeSH terms

Substances