

Trends in Mortality From Poisonings, Firearms, and All Other Injuries by Intent in the US, 1999-2020
- PMID: 37399025
- PMCID: PMC10318548
- DOI: 10.1001/jamainternmed.2023.2509
Trends in Mortality From Poisonings, Firearms, and All Other Injuries by Intent in the US, 1999-2020
Abstract
Importance: Although deaths due to external causes are a leading cause of mortality in the US, trends over time by intent and demographic characteristics remain poorly understood.
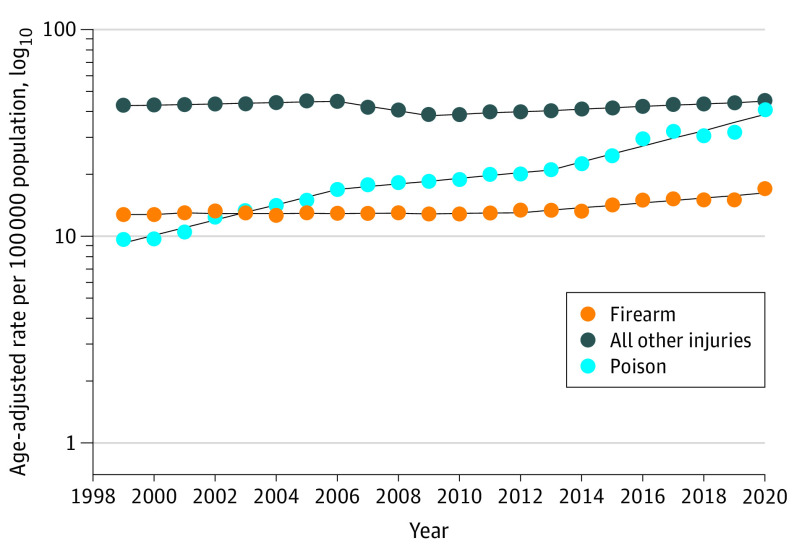
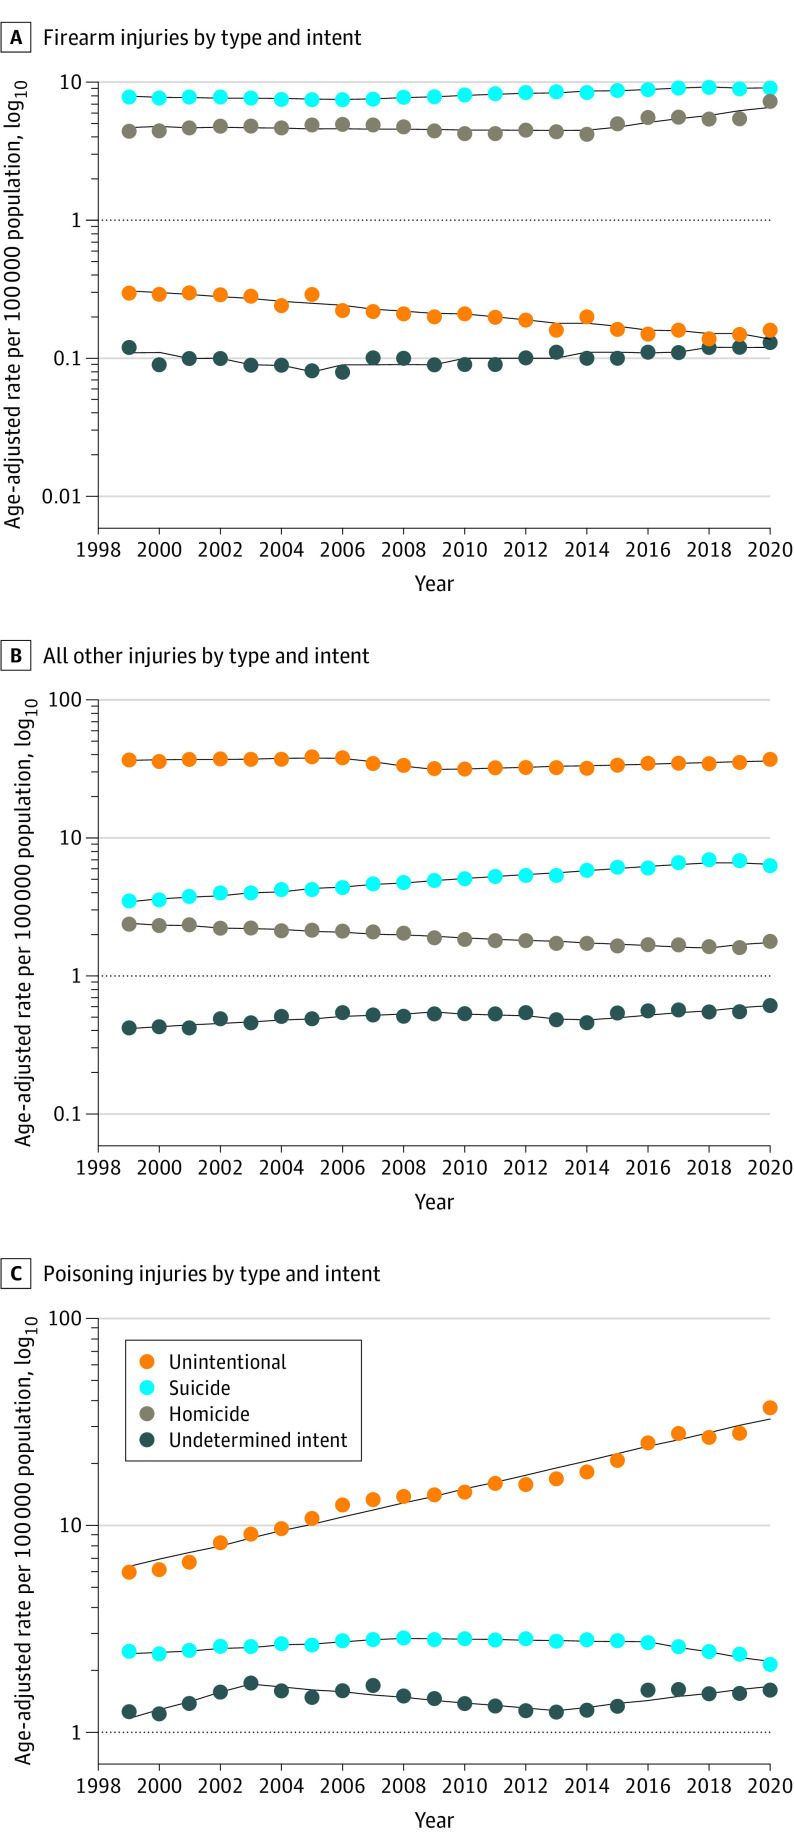
Objective: To examine national trends in mortality rates due to external causes from 1999 to 2020 by intent (homicide, suicide, unintentional, and undetermined) and demographic characteristics. External causes were defined as poisonings (eg, drug overdose), firearms, and all other injuries, including motor vehicle injuries and falls. Given the repercussions of the COVID-19 pandemic, US death rates for 2019 and 2020 were also compared.
Design, setting, and participants: Serial cross-sectional study using national death certificate data obtained from the National Center for Health Statistics and including all external causes of 3 813 894 deaths among individuals aged 20 years or older from January 1, 1999, to December 31, 2020. Data analysis was conducted from January 20, 2022, to February 5, 2023.
Exposures: Age, sex, and race and ethnicity.
Main outcomes and measures: Trends in age-standardized mortality rates and average annual percentage change (AAPC) in rates calculated by intent (suicide, homicide, unintentional, and undetermined), age, sex, and race and ethnicity for each external cause.
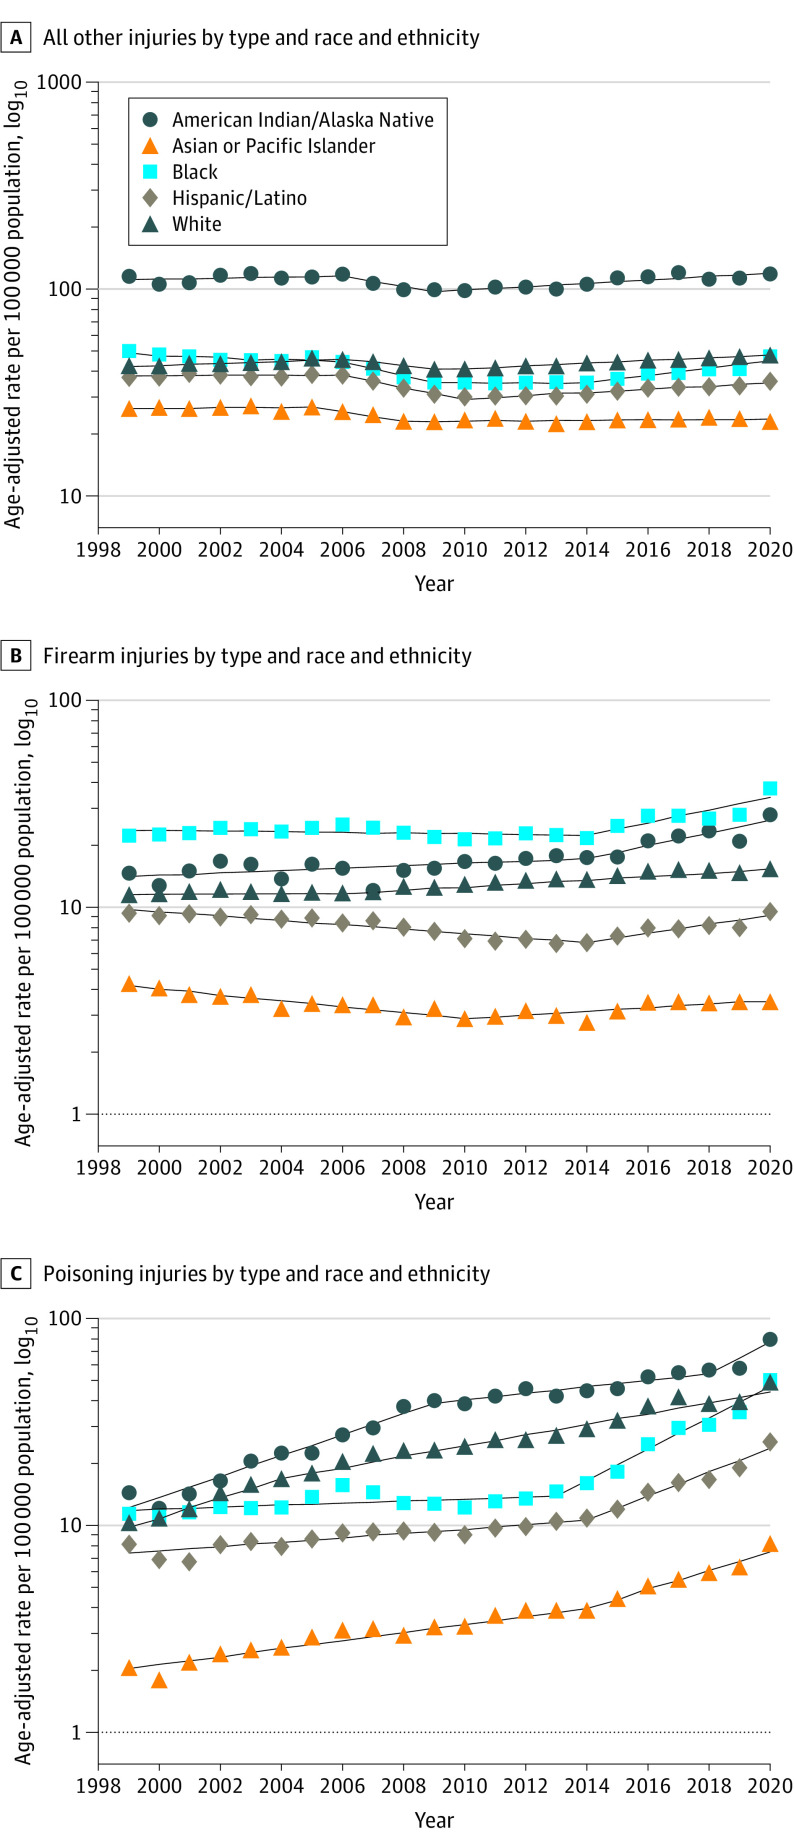
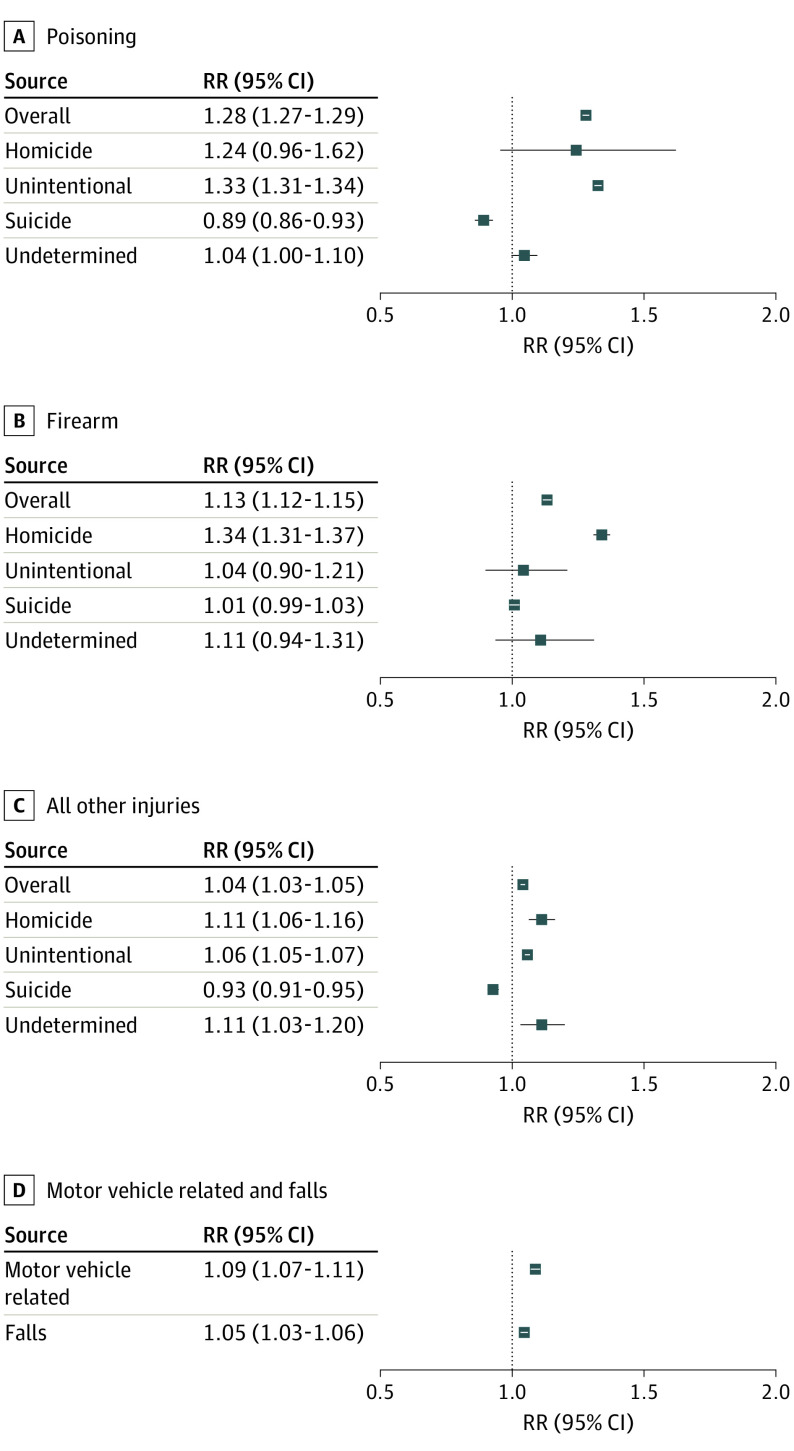
Results: Between 1999 and 2020, there were 3 813 894 deaths due to external causes in the US. From 1999 to 2020, poisoning death rates increased annually (AAPC, 7.0%; 95% CI, 5.4%-8.7%). From 2014 to 2020, poisoning death rates increased the most among men (APC, 10.8%; 95% CI, 7.7%-14.0%). During the study period, poisoning death rates increased in all the racial and ethnic groups examined; the most rapid increase was among American Indian and Alaska Native individuals (AAPC, 9.2%; 95% CI, 7.4%-10.9%). During the study period, death rates for unintentional poisoning had the most rapid rate of increase (AAPC, 8.1%; 95% CI, 7.4%-8.9%). From 1999 to 2020, firearm death rates increased (AAPC, 1.1%; 95% CI, 0.7%-1.5%). From 2013 to 2020, firearm mortality increased by an average of 4.7% annually (95% CI, 2.9%-6.5%) among individuals aged 20 to 39 years. From 2014 to 2020, mortality from firearm homicides increased by an average of 6.9% annually (95% CI, 3.5%-10.4%). From 2019 to 2020, mortality rates from external causes accelerated further, largely from increases in unintentional poisoning, and homicide due to firearms and all other injuries.
Conclusions and relevance: Results of this cross-sectional study suggest that from 1999 to 2020, death rates due to poisonings, firearms, and all other injuries increased substantially in the US. The rapid increase in deaths due to unintentional poisonings and firearm homicides is a national emergency that requires urgent public health interventions at the local and national levels.
Conflict of interest statement
Figures
Comment in
-
The Persistent Challenge of Preventable Death in the US.JAMA Intern Med. 2023 Aug 1;183(8):856-857. doi: 10.1001/jamainternmed.2023.2518. JAMA Intern Med. 2023. PMID: 37399034 No abstract available.
Comment on
-
The Persistent Challenge of Preventable Death in the US.JAMA Intern Med. 2023 Aug 1;183(8):856-857. doi: 10.1001/jamainternmed.2023.2518. JAMA Intern Med. 2023. PMID: 37399034 No abstract available.
References
-
- Arias E, Tejada-Vera B, Kochanek K, Ahmad F. Provisional life expectancy estimates for 2021. NVSS Vital Statistics Rapid Release. Centers for Disease Control and Prevention. August 31, 2022. Accessed October 3, 2022. https://stacks.cdc.gov/view/cdc/118999
-
- Shiels MS, Berrington de González A, Best AF, et al. . Premature mortality from all causes and drug poisonings in the USA according to socioeconomic status and rurality: an analysis of death certificate data by county from 2000-15. Lancet Public Health. 2019;4(2):e97-e106. doi:10.1016/S2468-2667(18)30208-1 - DOI - PMC - PubMed
Publication types
MeSH terms
LinkOut - more resources
Full Text Sources
Medical
