. 2023 Jul 25;17(14):13811-13825.
doi: 10.1021/acsnano.3c03523. Epub 2023 Jul 3.

A Comparative Study of Ultrasmall Calcium Carbonate Nanoparticles for Targeting and Imaging Atherosclerotic Plaque

Affiliations

A Comparative Study of Ultrasmall Calcium Carbonate Nanoparticles for Targeting and Imaging Atherosclerotic Plaque

Lydia Martínez-Parra et al. ACS Nano. .

Abstract

Atherosclerosis is a complex disease that can lead to life-threatening events, such as myocardial infarction and ischemic stroke. Despite the severity of this disease, diagnosing plaque vulnerability remains challenging due to the lack of effective diagnostic tools. Conventional diagnostic protocols lack specificity and fail to predict the type of atherosclerotic lesion and the risk of plaque rupture. To address this issue, technologies are emerging, such as noninvasive medical imaging of atherosclerotic plaque with customized nanotechnological solutions. Modulating the biological interactions and contrast of nanoparticles in various imaging techniques, including magnetic resonance imaging, is possible through the careful design of their physicochemical properties. However, few examples of comparative studies between nanoparticles targeting different hallmarks of atherosclerosis exist to provide information about the plaque development stage. Our work demonstrates that Gd (III)-doped amorphous calcium carbonate nanoparticles are an effective tool for these comparative studies due to their high magnetic resonance contrast and physicochemical properties. In an animal model of atherosclerosis, we compare the imaging performance of three types of nanoparticles: bare amorphous calcium carbonate and those functionalized with the ligands alendronate (for microcalcification targeting) and trimannose (for inflammation targeting). Our study provides useful insights into ligand-mediated targeted imaging of atherosclerosis through a combination of in vivo imaging, ex vivo tissue analysis, and in vitro targeting experiments.

Keywords: amorphous calcium carbonate nanoparticles; atherosclerosis; ligand-mediated targeted imaging; magnetic resonance imaging; synchrotron X-ray fluorescence tissue analysis.


Conflict of interest statement

The authors declare no competing financial interest.

Figures
Scheme 1
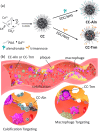
Scheme 1. (a) Schematic Illustration of the Synthesis Protocol of CC-Aln and CC-Trm. (b) Illustration of the Ligand-Mediated Accumulation of CC-Aln and CC-Trm in Atherosclerotic Plaques via High Affinity Binding to Calcifications and Macrophages, Respectively
Figure 1
Figure 1
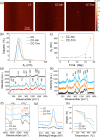
Characterization of targeted CC nanoprobes. (a) AFM images of Gd-doped amorphous CC NPs before and after Aln and Trm functionalization. The scale color corresponds to the NP height measured in tapping mode. (b) Hydrodynamic diameter (dh) measurements of the three NPs. (c) Time-dependent dh of CC-Aln and CC-Trm NPs at physiological pH 7.4 in PBS buffer. (d) μ-Raman spectra recorded at a 532 nm excitation wavelength of calcite (gray), PAA (red), undoped CC NPs (green), and Gd-doped CC NPs (black). (e) μ-Raman spectra of Gd-doped CC NPs (black), CC-Aln NPs (blue), and CC-Trm NPs (orange) (f) FT-IR spectra of CC, CC-Aln and CC-Trm NPs. (g) Core-level XPS spectra of N 1s. (h) TGA of sample powders with a heating rate of 10 °C min–1.
Figure 2
Figure 2
MR contrast of targeted CC NPs. (a) Plot of 1/T1 versus Gd concentration for CC, CC-Aln and CC-Trm NPs at 1.5 T (n = 3). (b) Concentration dependence of the T1 contrast obtained in an MRI scanner at 7 T. (c) Table of longitudinal relaxivity (r1) data and ratio r2/r1 of the different nanoprobes at 1.5 and 7 T. Longitudinal stability of the relaxometric properties in different water and blood plasma (d).
Figure 3
Figure 3
Biosafety and biodistribution. (a) Investigation of the Gd leakage from CC-NPs in different media with and without 2.5 mM Zn2+. (b) Stability of Gd (III) entrapped within CC, CC-Aln, and CC-Trm NPs at different acidic pH values. (c) Cell viability of HepG2 treated with the three NPs at different concentrations (n = 3). (d) Cell viability of EA.hy926 treated with the three NPs at different concentrations (n = 3). (e) Decrease of positive MRI contrast in the organs where NPs accumulated after 1 h of the NP i.v. administration. (f) Quantitative analysis of Gd mass in liver, spleen, kidneys, and urine per weight of dried tissue (black, light gray, and dark gray bars correspond to liver, spleen, and kidneys) after MRI analysis (∼2 h after NP i.v. administration).
Figure 4
Figure 4
Targeted imaging of atherosclerosis with NPs in vivo. (a) Schematic of targeted MRI of atherosclerosis in LDLr–/– mice (4 months old) with amorphous CC NPs functionalized with different ligands (Aln and Trm). (b) Comparison of CNR enhancement of the aortic arch tissue with targeted CC NPs (CC vs CC-Aln and CC-Trm NPs). (c) T1-weighted MRI before (precontrast) and after 1 h (postcontrast) of the i.v. administration of bare CC (gray), CC-Aln (blue), and CC-Trm (orange) NPs. The arrows indicate the position of the aorta, and the insets are magnified images of the aorta. Multiple t test statistical analysis. *P < 0.05, n.s. not significant *P > 0.05.
Figure 5
Figure 5
SXRF imaging of NPs in atherosclerotic aortas ex vivo. (a) Representative SXRF Ca, Zn and Gd elemental and composite maps of 50 μm thick longitudinal sections of aortas from LDLr–/– mice model of atherosclerosis untreated or treated with a single i.v. administration of Gd-doped CC, CC-Trm or CC-Aln NPs (0.05 mmol/kg) for 15 or 60 min, obtained using incident energy 11 keV at 5 × 5 μm2 step size; scale bar 500 μm. Images were generated in FIJI ImageJ package. (b) Comparison of average Gd accumulation/area unit (as ppm Gd/μm2) in the aortic tissue analyzed with SXRF in (a). (c) Ca–Gd correlation (shown as r-Pearson correlation coefficient) in the aortic tissue analyzed with SXRF in (a). Multiple t test statistical analysis. *P < 0.05, n.s. not significant *P > 0.05.
Figure 6
Figure 6
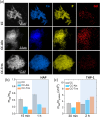
Targeting in vitro. EDX analysis of adsorption of CC-Aln for HAP compared to CC-Trm. STEM images of HAP and corresponding element mapping of HAP components (Ca and P) and Gd present in CC-Aln and CC-Trm (a). ICP-MS measurements of Gd adsorbed on the HAP samples after 5 and 15 min of incubation (b). NP uptake studies with THP-1 derived macrophages determining the amount of Gd by ICP-MS per cellular protein.

References

    1. Libby P. The changing landscape of atherosclerosis. Nature 2021, 592, 524–533. 10.1038/s41586-021-03392-8. - DOI - PubMed
    1. Libby P.; Buring J. E.; Badimon L.; Hansson G. K.; Deanfield J.; Bittencourt M. S.; Tokgözoğlu L.; Lewis E. F. Atherosclerosis. Nat. Rev. Dis. Primers 2019, 5, 56.10.1038/s41572-019-0106-z. - DOI - PubMed
    1. Lusis A. J. Atherosclerosis. Nature 2000, 407, 233–241. 10.1038/35025203. - DOI - PMC - PubMed
    1. Mulder W. J.; Jaffer F. A.; Fayad Z. A.; Nahrendorf M. Imaging and Nanomedicine in Inflammatory Atherosclerosis. Sci. Transl. Med. 2014, 6, 239sr1.10.1126/scitranslmed.3005101. - DOI - PMC - PubMed
    1. Vigne J.; Thackeray J.; Essers J.; Makowski M.; Varasteh Z.; Curaj A.; Karlas A.; Canet-Soulas E.; Mulder W.; Kiessling F.; Schäfers M.; Botnar R.; Wildgruber M.; Hyafil F. Cardiovascular study group of the European Society of Molecular, Current and Emerging Preclinical Approaches for Imaging-Based Characterization of Atherosclerosis. Mol. Imaging Biol. 2018, 20, 869–887. 10.1007/s11307-018-1264-1. - DOI - PubMed

Publication types

MeSH terms