. 2023 Dec 30;194(1):243-257.
doi: 10.1093/plphys/kiad377.

Overexpression of REDUCED WALL ACETYLATION C increases xylan acetylation and biomass recalcitrance in Populus

Affiliations

Overexpression of REDUCED WALL ACETYLATION C increases xylan acetylation and biomass recalcitrance in Populus

Jin Zhang et al. Plant Physiol. .

Abstract

Plant lignocellulosic biomass, i.e. secondary cell walls of plants, is a vital alternative source for bioenergy. However, the acetylation of xylan in secondary cell walls impedes the conversion of biomass to biofuels. Previous studies have shown that REDUCED WALL ACETYLATION (RWA) proteins are directly involved in the acetylation of xylan but the regulatory mechanism of RWAs is not fully understood. In this study, we demonstrate that overexpression of a Populus trichocarpa PtRWA-C gene increases the level of xylan acetylation and increases the lignin content and S/G ratio, ultimately yielding poplar woody biomass with reduced saccharification efficiency. Furthermore, through gene coexpression network and expression quantitative trait loci (eQTL) analysis, we found that PtRWA-C was regulated not only by the secondary cell wall hierarchical regulatory network but also by an AP2 family transcription factor HARDY (HRD). Specifically, HRD activates PtRWA-C expression by directly binding to the PtRWA-C promoter, which is also the cis-eQTL for PtRWA-C. Taken together, our findings provide insights into the functional roles of PtRWA-C in xylan acetylation and consequently saccharification and shed light on synthetic biology approaches to manipulate this gene and alter cell wall properties. These findings have substantial implications for genetic engineering of woody species, which could be used as a sustainable source of biofuels, valuable biochemicals, and biomaterials.


Conflict of interest statement

Conflict of interest statement. None declared.

Figures

Figure 1.
Figure 1.
Wood properties of activation-tagged poplar population and the identification of the activation-tagged T-DNA insertion site in the rwa-c-D mutant. The distribution of wood properties of the A) syringyl/guaiacyl (S/G) lignin ratio, B) lignin content, C) C5 sugar, and D) C6 sugar of the poplar activation-tagged population consisting of 463 independent transgenic lines. The dash lines labelled “Ctrl3” and “rwa-c-D3” represent the values of wild type (WT) and “E8-33” (also labelled as “rwa-c-D”), respectively. E) The T-DNA insertion site in the rwa-c-D mutant. The orientation of the 4×35S enhancer repeats in the T-DNA situated 1261 bp upstream of the start codon of the RWA-C gene is indicated by arrowheads. F) Transcript levels of Potri.010G148400 and Potri.010G148500 in wild-type control (Ctrl) and rwa-c-D mutant. Error bars represent means ± Se (n = 3).
Figure 2.
Figure 2.
Characterization of the PtRWA genes. A) Normalized expression of the PtRWA genes in different organs and cell types. ST, shoot tips; L, leaves; PR, primary roots; Ph, phloem; SDX, stem differentiating xylem; XF, xylem fiber cells; XV, xylem vessel cells; TC, a combination of fiber, vessel, and ray cells; TPM, transcript per million. The bold line in the center of the boxplots represents the median, the box edges represent the 25th (lower) and 75th (upper) percentiles, and the whiskers extend to the most extreme data points that are no more than 1.5× the length of the upper or lower segment. B) Expression of the PtRWA genes in poplar SDX protoplasts at 7, 12, and 25 h transfected by overexpressing PtrSND1-B1-sGFP and sGFP (as control). *P < 0.05. C) Expression of the PtRWA genes during wood formation. The data were retrieved from the AspWood database (https://plantgenie.org/), where relative expression is shown for aspen stem samples, which consist primarily of phloem and cambium zone (I, in the bottom), expanding xylem (II), secondary cell wall forming xylem (III), and programmed cell death zone (IV). D) Coexpression network of PtRWA-C. Red and purple diamonds represent cell wall-related TFs and other TFs, respectively. Yellow, green, and gray nodes represent target gene (PtRWA-C), cell wall-related genes, and other genes, respectively. Large, medium, and small nodes represent the target gene, the 1st (direct) coexpressed genes, and the 2nd (indirect) coexpressed genes, respectively. Yellow and gray edges represent the 1st and the 2nd coexpression relationships, respectively. E) Protein structure of PtRWA-C. Purple and green regions represent the TM domain and Pfam:Cas1_AcylT domain, respectively. F) Subcellular localization of PtRWA-C in Populus protoplast (green). The Golgi marker Golgi-mCherry is shown in purple. Bar = 5 μm.
Figure 3.
Figure 3.
Growth status and cell wall characteristics of Populus overexpressing PtRWA-C. The diameter of basal stem A) and height B) were compared between transgenic lines, #1 and #2, and the control line (Ctrl). Lignin content C) and syringyl/guaiacyl (S/G) lignin ratio D) in PtRWA-C overexpression lines were compared to those in the Ctrl plants. Glucose E) and xylose F) release assay and the combined sugar release with glucose and xylose G) of PtRWA-C overexpression lines were compared with Ctrl plants. H) Acetyl contents in DMSO-extracted xylans of the transgenic and Ctrl plants. Error bars represent means ± SE (n = 3). Asterisks indicate significant differences between transgenic and Ctrl plants based on Student's t-test (*P < 0.05 and **P < 0.01).
Figure 4.
Figure 4.
Expression quantitative trait loci (eQTL) mapping of PtRWA-C in Populus xylem. A) eQTL associated with the expression of PtRWA-C in xylem. Shadow background and arrows indicate highly associated cis-eQTL and trans-eQTL, respectively. The right panel represents Quantile-Quantile plot evaluating P-value deviation from expectation. B) Box plots showing genotypic effects of PtRWA-C expression at cis-eQTL (shadow background) and 9 trans-eQTL (trans-eQTL peaks #1-9). Numerical annotations on the X axes denote whether the SNP site is homozygous and consistent (0/0) with the reference genome (P. trichocarpa “Nisqually-1”), heterozygous (0/1), or homozygous and inconsistent (1/1) with the reference genome (n = 444). The bold line in the center of the boxplots represents the median, the box edges represent the 25th (lower) and 75th (upper) percentiles, and the whiskers extend to the most extreme data points that are no more than 1.5× the length of the upper or lower segment. Asterisks indicate significant differences based on Student's t-test (*P < 0.05, **P < 0.01, and ***P < 0.001).
Figure 5.
Figure 5.
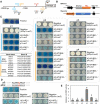
PtRWA-C is the direct target gene of secondary cell wall TFs and the trans-eQTL TF HRD. A) Simplified schematic of the promoter structure indicating the locations of the cis-acting elements (SNBE, secondary wall NAC binding elements; SMRE, MYB binding site; XYLAT, core xylem cis-element) and amplified promoter fragments (p1-p4). B) Schematic diagram of the effector and reporter structures. C) Yeast 1-hybrid (Y1H) assay showing the activity of LacZ reporters driven by the promoter fragments and activated by activation domain (AD) fusion effectors. D) Binding of the trans-eQTL (#3) TF HRD to the PtRWA-C promoter fragment p3 and its mutant p3m (C to G). E) Binding of HRD to the PtRWA-C promoter fragments using the dual-luciferase system. Expression values were determined by calculating the ratio of LUX activity to REN activity. Error bars represent means ± SE (n = 4). Statistical analysis was carried out with 1-way ANOVA followed by Tukey's post hoc test. Statistical significance is indicated by different letters (P < 0.05).
Figure 6.
Figure 6.
Transcriptomic changes in Populus transgenic plants overexpressing PtRWA-C. A) DEGs overlapped in leaf and stem of the 2 PtRWA-C overexpression lines (#1 and #2) compared to control plant (Ctrl). A total of 481 DEGs (286 upregulated and 194 downregulated) overlapped in stem of the 2 transgenic lines were identified as core-DEGs. B) Enriched biological process (BP) terms of GO enrichment analysis of the core-DEGs. C) Transcription factor binding site (TFBS) enrichment analysis of 2-kb promoter regions of the core-DEGs. D) Expression patterns of genes in the 7 coexpression modules. Numbers in parentheses indicate the number of genes (n) in each module. The bold line in the center of the boxplots represents the median, the box edges represent the 25th (lower) and 75th (upper) percentiles, and the whiskers extend to the most extreme data points that are no more than 1.5× the length of the upper or lower segment.

References

    1. Busov V, Yordanov Y, Gou J, Meilan R, Ma C, Regan S, Strauss S. Activation tagging is an effective gene tagging system in Populus. Tree Genet Genomes. 2011:7:91–101. 10.1007/s11295-010-0317-7 - DOI
    1. Carroll A, Somerville C. Cellulosic biofuels. Ann Rev Plant Biol. 2009:60:165–182. 10.1146/annurev.arplant.043008.092125 - DOI - PubMed
    1. Chen YK, Lin CH, Wang WC. The conversion of biomass into renewable jet fuel. Energy. 2020:201:117655. 10.1016/j.energy.2020.117655 - DOI
    1. Chow CN, Zheng HQ, Wu NY, Chien CH, Huang HD, Lee TY, Chiang-Hsieh YF, Hou PF, Yang TY, Chang WC. PlantPAN 2.0: an update of plant promoter analysis navigator for reconstructing transcriptional regulatory networks in plants. Nucleic Acids Res. 2016:44(D1):D1154–D1160. 10.1093/nar/gkv1035 - DOI - PMC - PubMed
    1. Ebringerová A. Structural diversity and application potential of hemicelluloses. Macromol Symp. 2005:232(1):1–12.