. 2023 Jul 11;120(28):e2301394120.
doi: 10.1073/pnas.2301394120. Epub 2023 Jul 3.

Phase variation as a major mechanism of adaptation in Mycobacterium tuberculosis complex

Affiliations

Phase variation as a major mechanism of adaptation in Mycobacterium tuberculosis complex

Roger Vargas Jr et al. Proc Natl Acad Sci U S A. .

Abstract

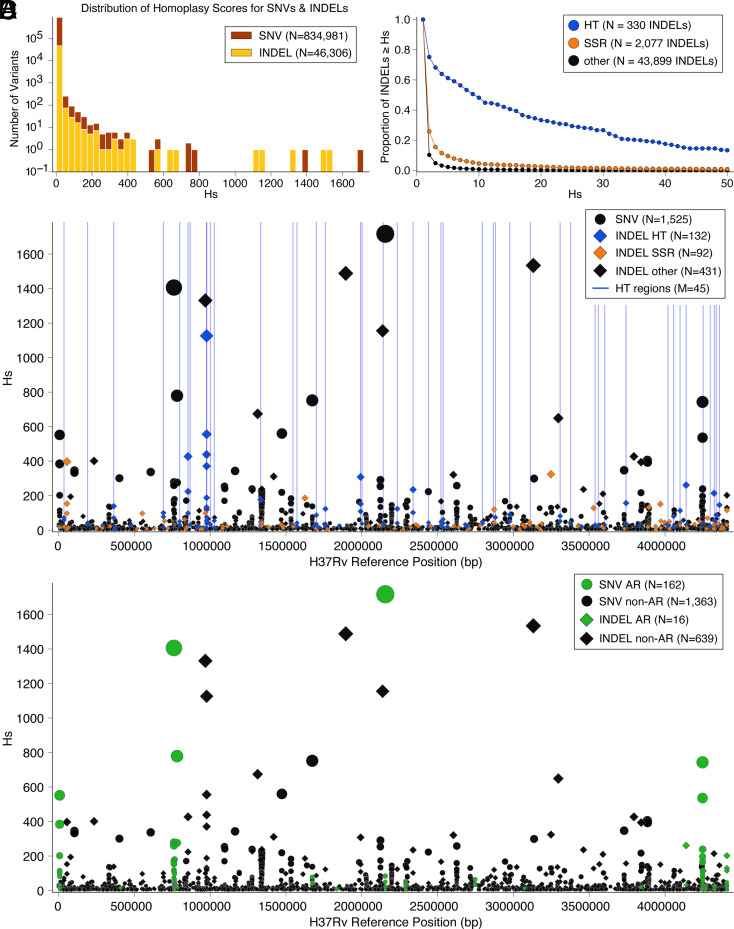
Phase variation induced by insertions and deletions (INDELs) in genomic homopolymeric tracts (HT) can silence and regulate genes in pathogenic bacteria, but this process is not characterized in MTBC (Mycobacterium tuberculosis complex) adaptation. We leverage 31,428 diverse clinical isolates to identify genomic regions including phase-variants under positive selection. Of 87,651 INDEL events that emerge repeatedly across the phylogeny, 12.4% are phase-variants within HTs (0.02% of the genome by length). We estimated the in-vitro frameshift rate in a neutral HT at 100× the neutral substitution rate at [Formula: see text] frameshifts/HT/year. Using neutral evolution simulations, we identified 4,098 substitutions and 45 phase-variants to be putatively adaptive to MTBC (P < 0.002). We experimentally confirm that a putatively adaptive phase-variant alters the expression of espA, a critical mediator of ESX-1-dependent virulence. Our evidence supports the hypothesis that phase variation in the ESX-1 system of MTBC can act as a toggle between antigenicity and survival in the host.

Keywords: genomics; microbiology; phase variation; tuberculosis.


Conflict of interest statement

The authors declare no competing interest.

Figures

Fig. 1.
Fig. 1.
Parallel evolution of SNVs and INDELs. (A) The distribution of homoplasy scores for 834,981 SNVs and 46,306 INDELs. 0.49% of SNVs have a homoplasy score 5 (P<0.002) and 3.01% of INDELs have a homoplasy score 5 . (B) Proportion of INDELs with Hs x for varying values of x, split into sets according to whether INDEL occurs within HT, SSR, or other region of the genome. (C and D) Homoplasy score (Hs) for 1,525 SNVs and 655 INDELs with homoplasy score 5 and minor (SNVs)/alternate (INDELs) allele frequency >0.1% among 31,428 isolates, plotted against position on the genome. Bubble size corresponds to Hs. (C) INDELs broken down by whether they occur within an HT, SSR, or other region of the genome. HTs with a cumulative Hs score >45 (across INDELs occurring within HT) are indicted by blue bars. (D) Variants colored in green occur within genes that have been associated with antibiotic resistance.
Fig. 2.
Fig. 2.
Recency ratio for SNVs and HT INDELs. (A and B) The distribution of the ratio of (homoplasy score) to (# of isolates harboring the minor allele) for 1,208/1,525 SNVs (Fig. 1C) that occur in coding regions. (C) Breaking these SNV recency ratios down by gene category reveals higher ratios overall for antibiotic resistance genes when compared to other gene categories. (D and E) The distribution of the ratio of (homoplasy score) to (# of isolates harboring the alternate allele) for 100/655 INDELs (Fig. 1C) that occur in HT and coding regions. (F) Breaking these INDEL ratios down by gene category reveals higher ratios overall for antibiotic resistance genes when compared to other gene categories; however, the only two INDELs in this gene category were found in the HT of glpK. N = number of alleles, M = median RcR.
Fig. 3.
Fig. 3.
Genetic map confirms homoplastic variants. (A) The t-SNE plot serves as a genetic similarity map, isolates are colored according to which group they belong to (L1, L2, L3, L4A, L4B, L4C, L5, L6). (BD) Isolates are labeled if they harbor a given mutant allele (N = # of isolates that harbor the mutant allele). These mutations within HTs (glpK nt565-572insC, delT upstream espA nt−105/−112, insT upstream espA nt−105/−112, espK nt797-803insC and espK nt797-803delC) are detected in isolates belonging to different clusters, confirming that these mutations must have arisen independently in different genetic backgrounds.
Fig. 4.
Fig. 4.
A single basepair deletion within the espA homopolymer results in decreased espA expression. (A) Schematic showing location of 7 basepair homopolymer upstream of Rv3616c. A highly variable, 7 basepair adenine repeat 105 basepairs upstream of the translational start site for Rv3616c (espA), which forms an operon with downstream genes espCD. Upstream of Rv3616c, two transcriptional start sites have been identified. The longer of which sits along the homopolymeric stretch, the other is found another 41 basepairs downstream of the homopolymer. A single basepair deletion in the poly-A tract results in a ~twofold decrease in espACD expression. (B) A volcano plot highlighting the results of an RNAseq experiment comparing a recombineered espA homopolymer mutant to WT H37Rv. Results are pooled from 2 independent experiments consisting of at least 3 biological replicates each. espA (green), espC (red), and espD (blue) are highlighted. Also highlighted Rv3612c (purple) and Rv3613c (pink), two genes immediately downstream of espACD. (C) Relative expression levels of the espACD operon in the mutant espA strain compared to WT H37Rv.
Fig. 5.
Fig. 5.
SNV and INDEL mutational density per gene. (A) The homoplasy scores for all SNVs within each gene were aggregated to approximate all SNV mutation events (independent arisals) that occurred within the gene body then normalized by the gene length (Materials and Methods). Dataset S5 contains the calculations for each gene as well as columns for # SNVssynonymous homoplasy score, and nonsynonymous homoplasy score. (B) A similar computation was carried out for INDELs in which homoplasy scores for all INDELs within each gene were aggregated and normalized by gene length (blue denotes genes containing an HT, orange denotes genes containing an SSR, black denotes genes containing neither an HR or SSR) (Materials and Methods). Dataset S6 contains the calculations for each gene as well as # INDELsinframe homoplasy score, and frameshift homoplasy score. (C) Homoplasy scores for all SNVs were aggregated at the level of pathways then normalized by the gene lengths for each gene set (Dataset S7 and Materials and Methods). (D) Homoplasy scores for all INDELs were aggregated at the level of pathways then normalized by the gene lengths for each gene set (Dataset S8 and Materials and Methods).

References

    1. Shaw G. B., “Practical uses of litmus paper in Möbius strips” (Tech. Rep. CUCS-29-82, Columbia University, NY, 1982).
    1. Gagneux S., Ecology and evolution of Mycobacterium tuberculosis. Nat. Rev. Microbiol. 16, 202–213 (2018). - PubMed
    1. Ngabonziza J. C. S., et al. , A sister lineage of the Mycobacterium tuberculosis complex discovered in the African Great Lakes region. Nat. Commun. 11, 1–11 (2020). - PMC - PubMed
    1. Coscolla M., et al. , Phylogenomics of Mycobacterium africanum reveals a new lineage and a complex evolutionary history. Microb. Genomics 7, 000477 (2021). - PMC - PubMed
    1. Van Der Woude M. W., Bäumler A. J., Phase and antigenic variation in bacteria. Clin. Microbiol. Rev. 17, 581–611 (2004). - PMC - PubMed

Publication types

LinkOut - more resources