. 2023 Jul 11;120(28):e2220523120.
doi: 10.1073/pnas.2220523120. Epub 2023 Jul 3.

Subspace partitioning in the human prefrontal cortex resolves cognitive interference

Affiliations

Subspace partitioning in the human prefrontal cortex resolves cognitive interference

Jan Weber et al. Proc Natl Acad Sci U S A. .

Abstract

The human prefrontal cortex (PFC) constitutes the structural basis underlying flexible cognitive control, where mixed-selective neural populations encode multiple task features to guide subsequent behavior. The mechanisms by which the brain simultaneously encodes multiple task-relevant variables while minimizing interference from task-irrelevant features remain unknown. Leveraging intracranial recordings from the human PFC, we first demonstrate that competition between coexisting representations of past and present task variables incurs a behavioral switch cost. Our results reveal that this interference between past and present states in the PFC is resolved through coding partitioning into distinct low-dimensional neural states; thereby strongly attenuating behavioral switch costs. In sum, these findings uncover a fundamental coding mechanism that constitutes a central building block of flexible cognitive control.

Keywords: cognitive control; intracranial EEG; population geometry; prefrontal cortex.


Conflict of interest statement

The authors declare no competing interest.

Figures
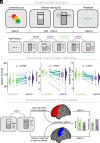
Fig. 1.
Fig. 1.
Experimental design, behavioral performance, and schematic hypotheses. (A, Top) participants performed a predictive motor task where they had to track a vertically moving target and respond as soon as the target reached a predefined lower limit (go-trials; hit-lower limit, HLL; black horizontal line). At the start of every trial, participants received a contextual cue indicating the likelihood (0, 25 and 75% likelihood; green, orange, red circle, respectively) that the moving target would stop prematurely requiring participants to withhold their response (stop-trials). Feedback was provided at the end of each trial. (Bottom) Task-switching was defined as the trial-type (stop/go-trial) congruency between two successive trials (Methods). (B) Behavioral performance as a function of task-switching. (Left) Reaction time was significantly increased after switch trials (go-trial preceded by a stop-trial) as compared to no-switch trials (go-trial preceded by a go-trial). Accuracy (Middle) and d-prime (Right) significantly decreased after switch as compared to no-switch trials. Gray lines display individual participants, density-plots display the data distribution, and boxplots show the median (horizontal line), the first/third quartiles (upper/lower edge of box), and the minima/maxima (vertical lines). (C) Schematic illustration of hypothetical outcomes. In the first scenario, switch costs may reflect the time needed to engage active top-down control processes in the prefrontal cortex to reconfigure the cognitive system. In the second scenario, switch costs could reflect persistent inhibition (passive inertia) of motor areas after withholding a response. Note that both alternatives are not mutually exclusive and could also evolve in parallel.
Fig. 2.
Fig. 2.
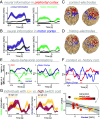
Behavioral dissociation of neural dynamics encoding the past and present. (A, Left) Time course of context-dependent information averaged across all context-encoding electrodes in PFC. (Right) Time course of history-dependent neural information averaged across all history-encoding electrodes in the PFC. Lines and shaded regions show the mean and SEM. Gray traces indicate the time course of neural information across nonencoding electrodes. The lower horizontal black line shows the temporal extent of significant neural information. (B) Same as A, but for the motor cortex. (C) Context-encoding electrodes overlaid on a standardized brain in Montreal Neurological Institute and Hospital (MNI) coordinates for the PFC (red) and motor cortex (blue). Overall, 165 electrodes in the PFC and 89 electrodes in the motor cortex carried significant context-dependent information. (D) History-encoding electrodes, same conventions as in C. Task-history was significantly encoded in 96 electrodes in the PFC and 48 electrodes in the motor cortex. (E, Left) Temporally resolved correlation between neural information and individual switch costs (accuracy; see SI Appendix, Fig. S4 for reaction time) for the PFC (Left) and motor cortex (Right). Lines and shaded regions show the mean and 95% CIs of bootstrapped correlation coefficients (Methods). The lower colored horizontal lines show the temporal extent of significant correlation for context- (purple) and history-dependent (green) neural information. The black line shows the temporal extent of significant differences in neurobehavioral correlation between predictive context and -history. (F, Top) Temporally resolved correlation between context- and history-dependent neural information for the PFC (red) and motor cortex (blue). The red horizontal line shows the temporal extent of significant correlation between context- and history-dependent information in the PFC. Lines and shaded regions show the mean and 95% CIs of bootstrapped correlation coefficients (Methods). (Bottom) Correlation between context- and history-dependent information based on the significant temporal cluster shown in the top panel of F. Filled dots represent individual participants; color-coded by their individual switch costs. Gray-shaded area indicates 95% CIs of the trend line. (G) Median split analysis based on individual switch costs (shown for accuracy) for history- (Left) and context-dependent information (Right) in the PFC. The lower horizontal black line highlights the temporal extent of significant differences between individuals with a low (yellow) vs. high (red) switch cost. Lines and shaded regions show the mean and SEM.
Fig. 3.
Fig. 3.
Multivariate data analysis approach to identify low dimensional coding subspaces. (A) Schematic illustration of the multivariate analysis applied to estimate population coding subspaces (Methods). (B, Left) Cumulative explained variance estimated using the first five PCs for history- and context-coding subspaces. Small Inset illustrates that the dimensionality of context- and history-coding subspaces does not differ. (Right) Schematic of two coding trajectories through a three-dimensional state space. The black dotted line reflects the multidimensional distance between the two trajectories at time t = 1. The colored dotted lines denote the projection line onto PC1 and PC2. (C, Left) Single subject example with a low switch cost and antagonistically evolving context- and history-dependent coding trajectories projected onto the first two PCs. (Right) Single subject example with a high switch cost and strongly resembling coding trajectories projected onto the first two PCs (see SI Appendix, Fig. S5 for group-level correlation).
Fig. 4.
Fig. 4.
Low-dimensional coding partition predicts individual switch costs. (A) Example of subspace alignment in the PFC for a participant with a low-behavioral switch cost. (Top Left) Channel weights obtained for the dominant mode (PC1) across context (Left) and history axes (Right). (Top Right) Channel weights obtained for the dominant mode across context (Top) and history axes (Bottom) overlaid on an individual brain. (Bottom Left) Strong negative correlation between channel weights projecting onto the dominant mode across context and history axes. (Bottom Right) Temporal evolution of low-dimensional context- and history-coding subspaces, shown for the dominant mode. Note the anticorrelated traces. (B) Example of subspace alignment in the PFC for a participant with low-behavioral switch costs. Same conventions as in A. (C) Group-level correlation reveals a positive relationship between subspace alignment strength and individual switch cost. Strong subspace alignment is associated with a high switch cost, whereas weak subspace alignment is associated with a low switch cost. Outlined circles in gray indicate the example subjects in A and B. The inset highlights the strength of subspace alignment based on a median split for participants with a low (yellow) and high (red) switch cost. Gray-shaded area indicates 95% CIs of the trend line.

References

    1. Buschman T. J., Denovellis E. L., Diogo C., Bullock D., Miller E. K., Synchronous oscillatory neural ensembles for rules in the prefrontal cortex. Neuron 76, 838–846 (2012). - PMC - PubMed
    1. Helfrich R. F., Knight R. T., Oscillatory dynamics of prefrontal cognitive control. Trends Cogn. Sci. 20, 916–930 (2016). - PMC - PubMed
    1. Rigotti M., et al. , The importance of mixed selectivity in complex cognitive tasks. Nature 497, 585–590 (2013). - PMC - PubMed
    1. Parthasarathy A., et al. , Mixed selectivity morphs population codes in prefrontal cortex. Nat. Neurosci. 20, 1770–1779 (2017). - PubMed
    1. Ebitz R. B., Hayden B. Y., The population doctrine in cognitive neuroscience. Neuron 109, 3055–3068 (2021), 10.1016/j.neuron.2021.07.011. - DOI - PMC - PubMed

Publication types

LinkOut - more resources