. 2023 Jul 11;120(28):e2305236120.
doi: 10.1073/pnas.2305236120. Epub 2023 Jul 3.

Comprehensive tissue deconvolution of cell-free DNA by deep learning for disease diagnosis and monitoring

Affiliations

Comprehensive tissue deconvolution of cell-free DNA by deep learning for disease diagnosis and monitoring

Shuo Li et al. Proc Natl Acad Sci U S A. .

Erratum in

Abstract

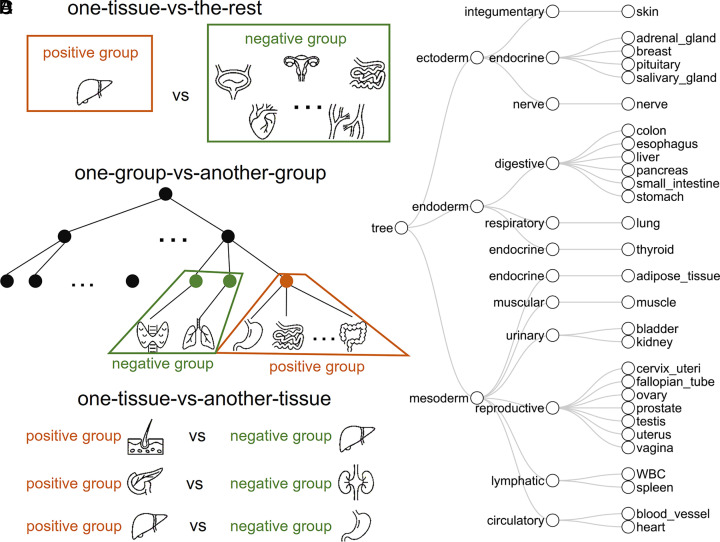
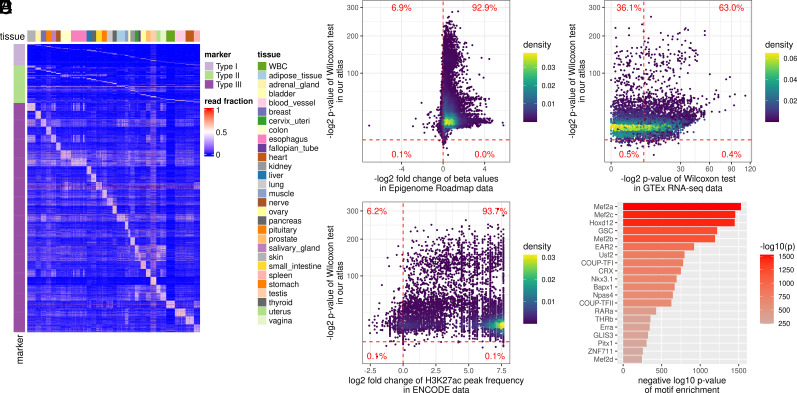
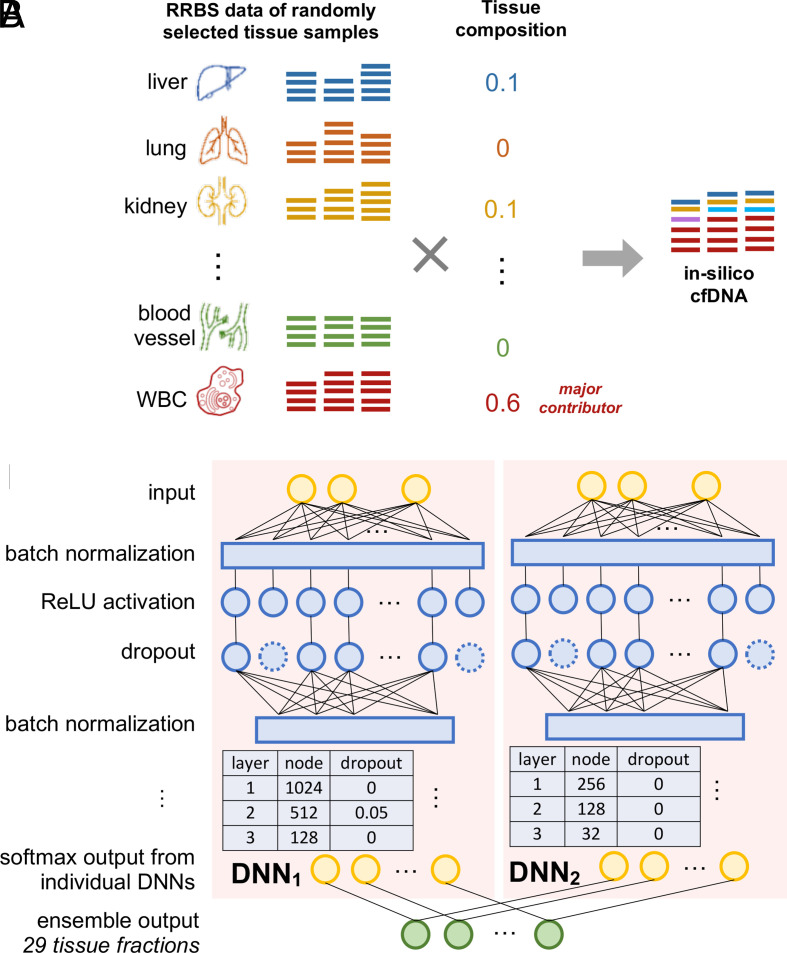
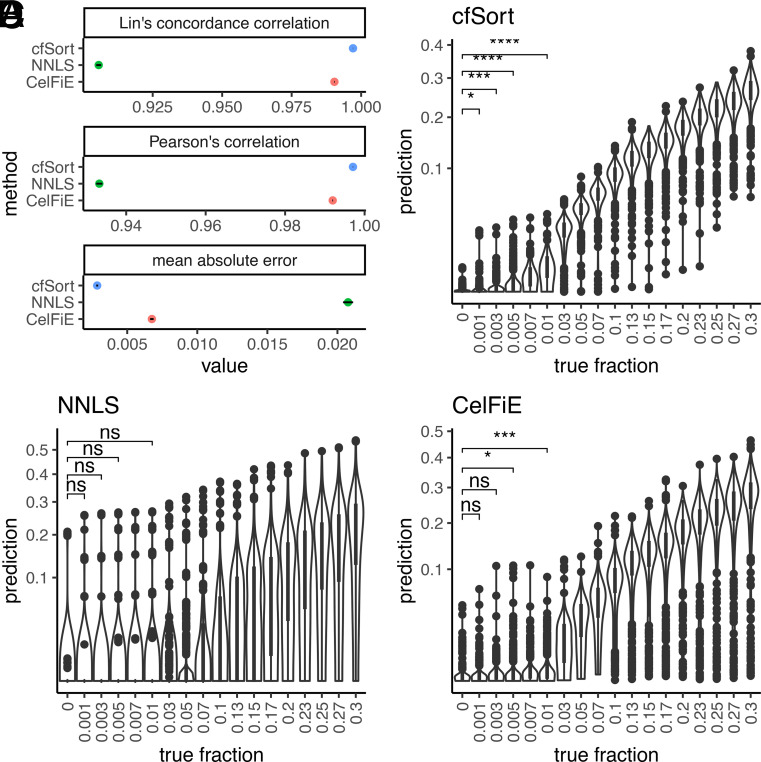
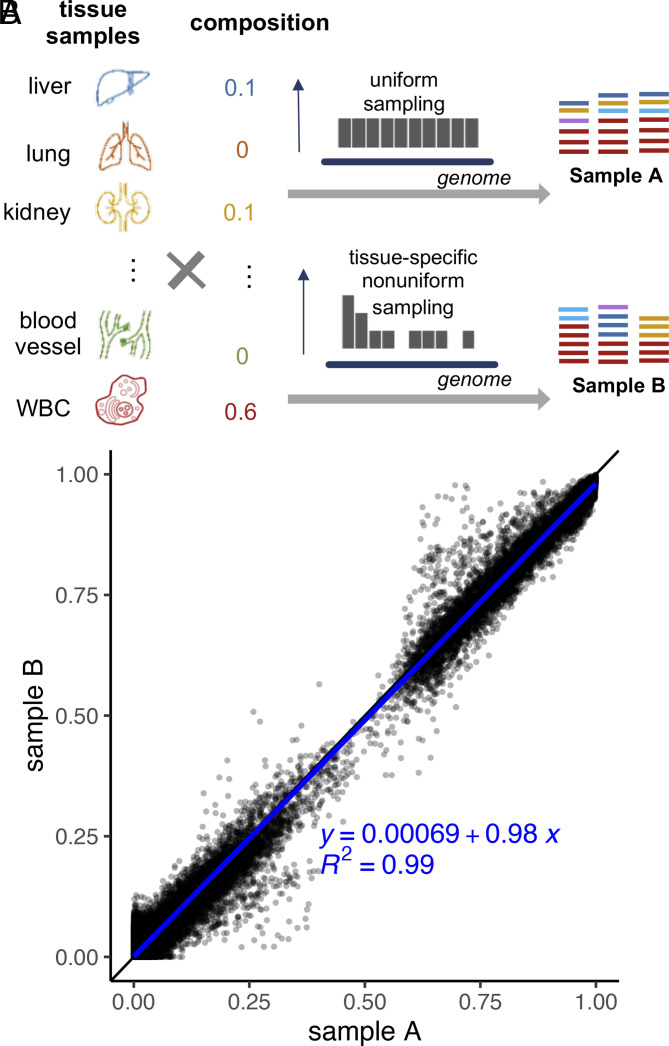
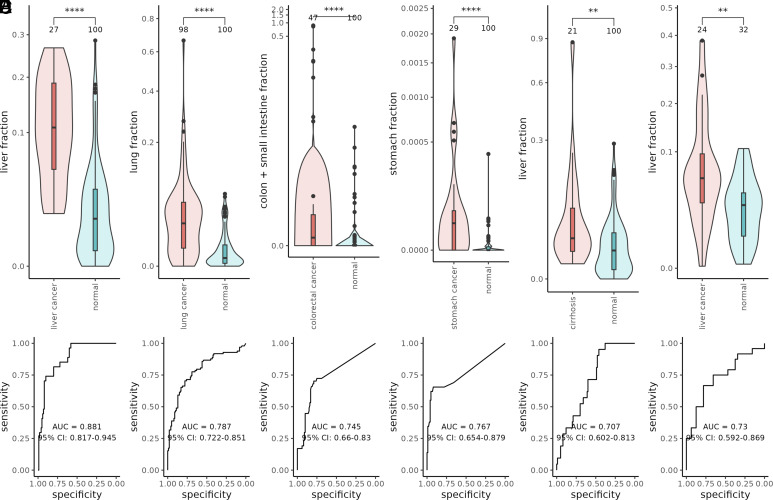
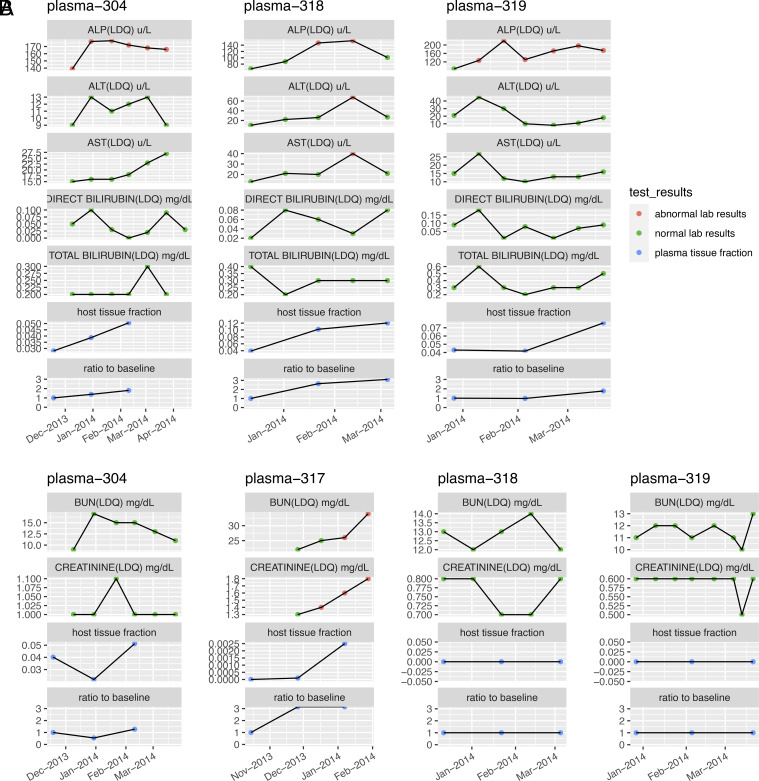
Plasma cell-free DNA (cfDNA) is a noninvasive biomarker for cell death of all organs. Deciphering the tissue origin of cfDNA can reveal abnormal cell death because of diseases, which has great clinical potential in disease detection and monitoring. Despite the great promise, the sensitive and accurate quantification of tissue-derived cfDNA remains challenging to existing methods due to the limited characterization of tissue methylation and the reliance on unsupervised methods. To fully exploit the clinical potential of tissue-derived cfDNA, here we present one of the largest comprehensive and high-resolution methylation atlas based on 521 noncancer tissue samples spanning 29 major types of human tissues. We systematically identified fragment-level tissue-specific methylation patterns and extensively validated them in orthogonal datasets. Based on the rich tissue methylation atlas, we develop the first supervised tissue deconvolution approach, a deep-learning-powered model, cfSort, for sensitive and accurate tissue deconvolution in cfDNA. On the benchmarking data, cfSort showed superior sensitivity and accuracy compared to the existing methods. We further demonstrated the clinical utilities of cfSort with two potential applications: aiding disease diagnosis and monitoring treatment side effects. The tissue-derived cfDNA fraction estimated from cfSort reflected the clinical outcomes of the patients. In summary, the tissue methylation atlas and cfSort enhanced the performance of tissue deconvolution in cfDNA, thus facilitating cfDNA-based disease detection and longitudinal treatment monitoring.

Keywords: DNA methylation; cell-free DNA; disease diagnosis; disease monitoring; tissue deconvolution.


Conflict of interest statement

W.L., W.H.W., and X.J.Z. are co-founders of EarlyDiagnostics Inc. X.N. and M.L.S. are employees at EarlyDiagnostics Inc. S.L. is a former employee at EarlyDiagnostics Inc. S.L., W.Z., X.N., W.L., M.L.S., Y.Z., W.H.W., S.M.D., and X.J.Z. own stocks of EarlyDiagnostics Inc. The other authors declare no competing interests.

Figures

Fig. 1.
Fig. 1.
Three strategies to select the tissue-specific methylation signatures. Illustration of the tissue comparisons in the one-tissue-vs.-the-rest strategy (A), the one-group-vs.-another-group strategy (B) following the tissue development phylogeny (C), and the one-tissue-vs.-another-tissue strategy (D). The fragment-level methylation in a genomic region was compared between the negative group and the positive group. The phylogenetic tree (C) constructed was based on early tissue development (23). The first layer corresponded to the three germ layers in early embryo development. The second layer corresponded to the function systems. The third layer contained the 29 tissue types in our deconvolution model.
Fig. 2.
Fig. 2.
Construction and validation of the tissue-specific methylation atlas. (A) Heatmap of three types of tissue-specific markers used in the tissue deconvolution (i.e., the top-ranked tissue markers in the methylation atlas). The methylation atlas consists of the tissue markers that distinguish 29 human tissues. The tissue markers were identified by three strategies (Materials and Methods): Type I markers from the one-tissue-vs.-the-rest strategy (Top); Type II markers from the one-group-vs.-the-another-group strategy using the tissue phylogeny (Middle), and Type III markers from the one-tissue-vs.-another-tissue strategy (Bottom). The color in the heatmap showed the fraction of the tissue-specific fragments out of all fragments at a marker (referred to as the read fraction). (B) Validation of the reproducibility of the identified tissue markers in Epigenome Roadmap data. For each marker, from the RRBS data of our tissue samples, we performed the one-sided Wilcoxon rank-sum test between the corresponding tissues (comparing lowly with highly methylated tissues); on the WGBS data from the Epigenome Roadmap project, we calculated the fold change of the beta values between the corresponding tissues. Each point in the figure corresponds to a marker. The vertical dashed line showed a fold change of 1. The points on the right side of the vertical dashed line represented the markers with fold change <1, indicating a consistent methylation pattern with our RRBS data. The horizontal dashed line indicated a significant P value (<0.01). (C) Marker association with tissue-specific H3K27ac modification. For each marker, on the H3K27ac ChIP-seq data from the ENCODE project, we calculated the fold change of the H3K27ac peak frequency between the corresponding tissues. Each point in the figure corresponds to a marker. The vertical dashed line indicated that the fold change was 1. The horizontal dashed line indicated a significant P value (<0.01). (D) Marker association with tissue-specific transcription. For each marker, on the RNA-seq data from the GTEx project, we performed the Wilcoxon rank-sum test between the corresponding tissues. Each point in the figure corresponds to a marker. The vertical and horizontal dashed lines indicated a significant P value (<0.01). (E) Marker association with tissue-specific transcription regulation. We analyzed the enrichment of transcription factor binding motifs at the marker regions using HOMER. The top 20 enriched motifs and their P values were shown in the figure.
Fig. 3.
Fig. 3.
Overview of in silico cfDNA data generation and the DNN of the cfSort. (A) Illustration of in silico cfDNA data generation. The data were generated by in silico mixing of the data of tissue samples (Materials and Methods). For a sample, we randomly selected the original tissue samples and generated a tissue composition where the WBC was always the major contributor. Then we uniformly and randomly sampled DNA fragments from the RRBS data of the selected tissue samples based on the corresponding tissue fraction in the tissue composition. The sampled DNA fragments from every tissue sample were pooled together as the simulated sample. The tissue composition was regarded as the ground truth. (B) Illustration of cfSort. cfSort is an ensemble of two component DNNs, which have three dense hidden layers with the ReLU activation. We applied a batch normalization layer before each dense hidden layer and a dropout layer after each hidden layer. The output layer of each DNN contained 29 nodes corresponding to the 29 tissue types in the deconvolution. We utilized the softmax activation function in the output layer. The final output of cfSort is the average of the output from the two component DNNs.
Fig. 4.
Fig. 4.
Analytical performance of the cfSort and comparisons with the existing methods. (A) The accuracy of the estimated tissue composition from the cfSort, NNLS, and CelFiE on the independent testing set. The accuracy was measured by Lin’s concordance correlation, Pearson’s correlation, and mean absolute error between the estimated tissue composition and the ground truth. The dots indicated the metric values, and the line segments indicated the 95% CI. (BD) The detection limit of the cfSort (B), NNLS (C), and CelFiE (D) were evaluated on the testing dilution series. The detection limit was measured by the statistical significance of a one-sided Student’s t test between the estimated tissue fractions of the samples at every dilution level and the control samples (i.e., 0% tissue fraction). The statistical significance in the figures indicated the P values of the one-sided Student’s t tests at 0.1%, 0.3%, 0.5%, and 1%: “ns” means not statistically significant (P value > 0.05); “*” means P value < 0.05; “**” means P value < 0.01; “***” means P value < 0.001; “****” means P value < 0.0001.
Fig. 5.
Fig. 5.
Evaluation of robustness of the cfSort. (A) Generation of the simulated testing sample pairs for the evaluation of robustness. We generated a testing sample pair (A and B) using the same tissue composition and the same original tissue samples but with different sequencing read sampling distributions. For sample A, we randomly sampled DNA fragments from the original tissue samples following a uniform distribution. For sample B, we used a nonuniform distribution to sample DNA fragments from the original tissue samples. The non-uniform distribution was randomly generated for each tissue type, and the distribution was different for different tissue types. (B) Robustness of the cfSort. The robustness was evaluated by the intercept, slope, and R2 of the fitted linear regression model between the tissue fractions estimated from the testing sample pairs.
Fig. 6.
Fig. 6.
The tissue-derived cfDNA fractions of the affected tissue in the diseased and normal individuals. (A) The liver-derived cfDNA fractions from the cfMethyl-Seq data of liver cancer patients and normal individuals. (B) The lung-derived cfDNA fractions from the cfMethyl-Seq data of the lung cancer patients and normal individuals. (C) The intestine-derived cfDNA fractions (including colon and small intestine) from the cfMethyl-Seq data of the colon cancer patients and normal individuals. (D) The stomach-derived cfDNA fractions from the cfMethylSeq data of the stomach cancer patients and normal individuals. (E) The liver-derived cfDNA fractions from the cfMethyl-Seq data of the cirrhosis patients and normal individuals. (F) The liver-derived cfDNA fractions from the WGBS data of the liver cancer patients and normal individuals. The difference between the diseased and normal individuals was evaluated by the Wilcoxon rank sum tests between the estimated fractions of affected-tissue-derived cfDNA. The statistical significance of the tests was indicated by the asterisks: “**” means P value < 0.01; “***” means P value < 0.001; “****” means P value < 0.0001. The receiver operating characteristic (ROC) curve and the area under ROC curve (AUC) showed the performance of disease detection using the tissue-derived cfDNA fractions of the affected tissue as a sole predictor. The number at the top of each violin showed the number of samples.
Fig. 7.
Fig. 7.
The tissue-derived cfDNA fractions and the biochemical marker levels of four NSCLC cancer patients who received anti-PD-1 immunotherapy. (A) The liver-derived cfDNA fractions and the levels of biochemical markers indicating liver functions. (B) The kidney-derived cfDNA fractions and the levels of biochemical markers indicating kidney functions. The plasma cfDNA samples were collected at the 0 wk, 6 wk, and 12 wk, measured starting from the beginning of the treatment. The biochemical markers were tested during the treatment. The affected tissue fraction was estimated by cfSort; the ratio to baseline was the ratio between the affected tissue fraction at a certain time point and the fraction at the 0 wk.

References

    1. Wan J., et al. , Liquid biopsies come of age: Towards implementation of circulating tumour DNA. Nat. Rev. Cancer 17, 223–238 (2017). - PubMed
    1. Stroun M., et al. , The origin and mechanism of circulating DNA. Ann. N. Y. Acad. Sci. 906, 161–168 (2000). - PubMed
    1. Kustanovich A., et al. , Life and death of circulating cell-free DNA. Cancer Biol. Therapy 20, 1057–1067 (2019). - PMC - PubMed
    1. Li S., et al. , cfTrack: A method of exome-wide mutation analysis of cell-free DNA to simultaneously monitor the full spectrum of cancer treatment outcomes including MRD, recurrence, and evolutioncfTrack: Comprehensive cancer monitoring using cfDNA. Clin. Cancer Res. 28, 1841–1853 (2022). - PMC - PubMed
    1. Li S., et al. , Sensitive detection of tumor mutations from blood and its application to immunotherapy prognosis. Nat. Commun. 12, 1–14 (2021). - PMC - PubMed

Publication types