. 2023 Jul 11;120(28):e2302485120.
doi: 10.1073/pnas.2302485120. Epub 2023 Jul 3.

Exploring switch II pocket conformation of KRAS(G12D) with mutant-selective monobody inhibitors

Affiliations

Exploring switch II pocket conformation of KRAS(G12D) with mutant-selective monobody inhibitors

Padma Akkapeddi et al. Proc Natl Acad Sci U S A. .

Abstract

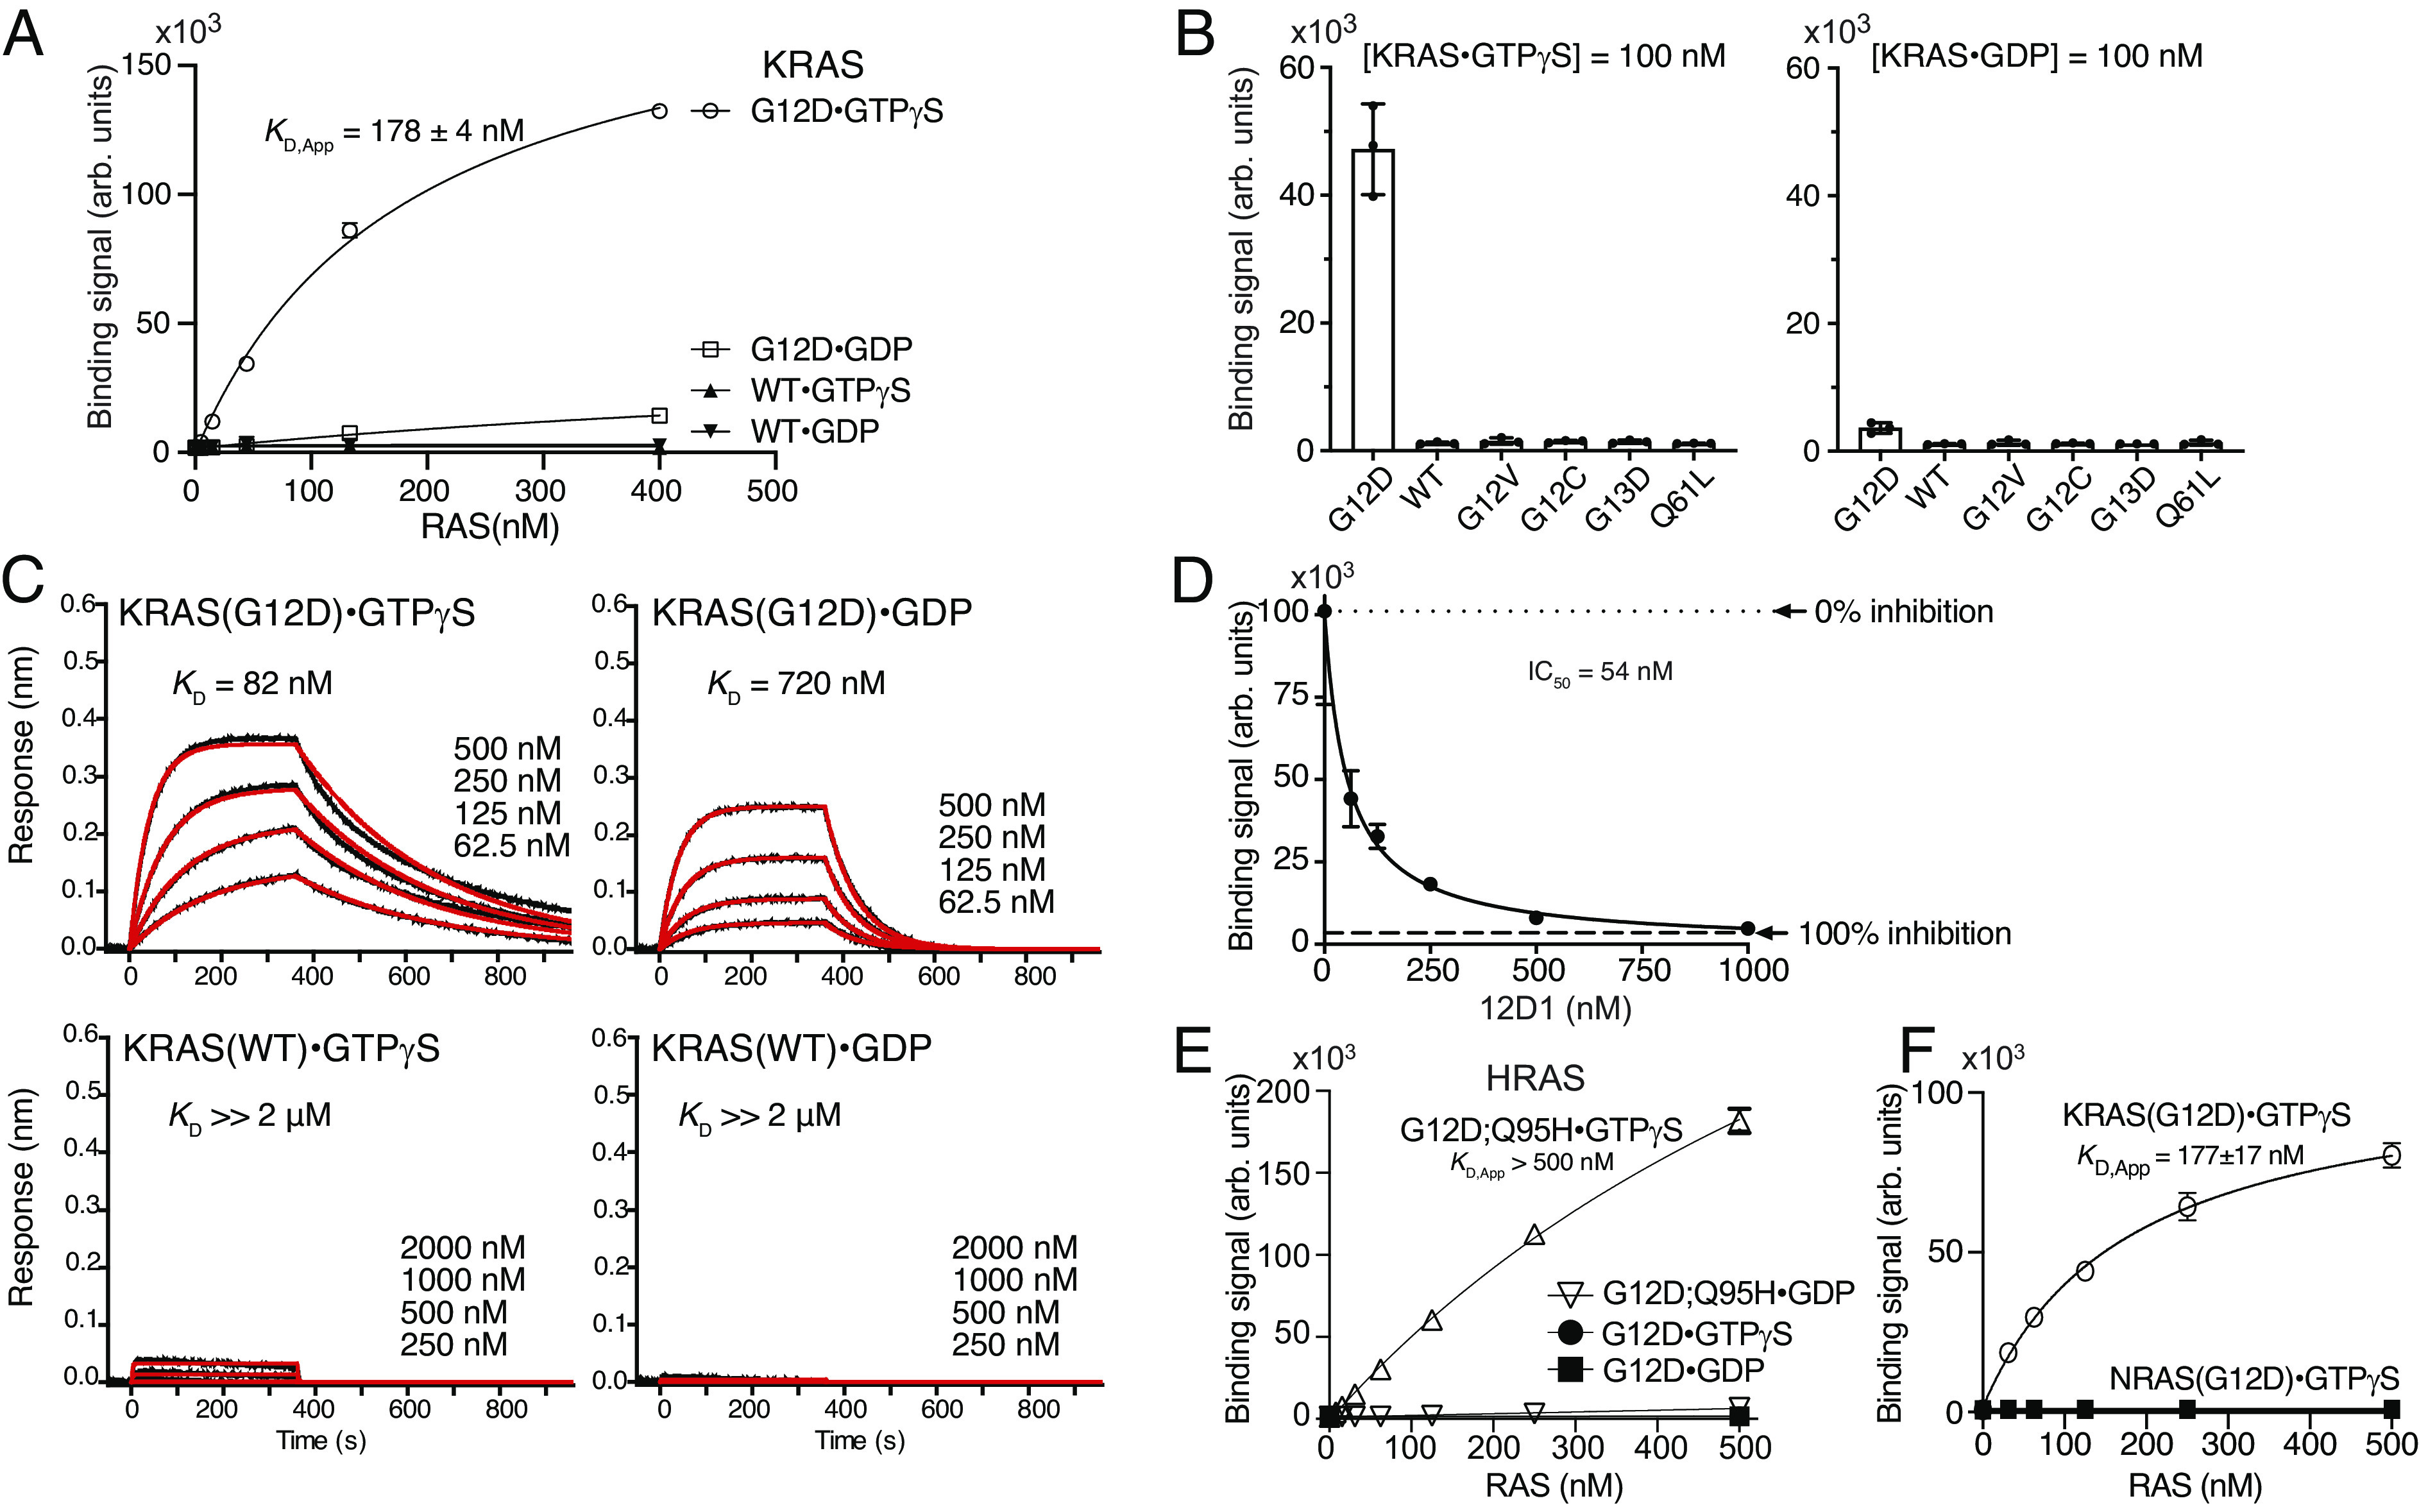
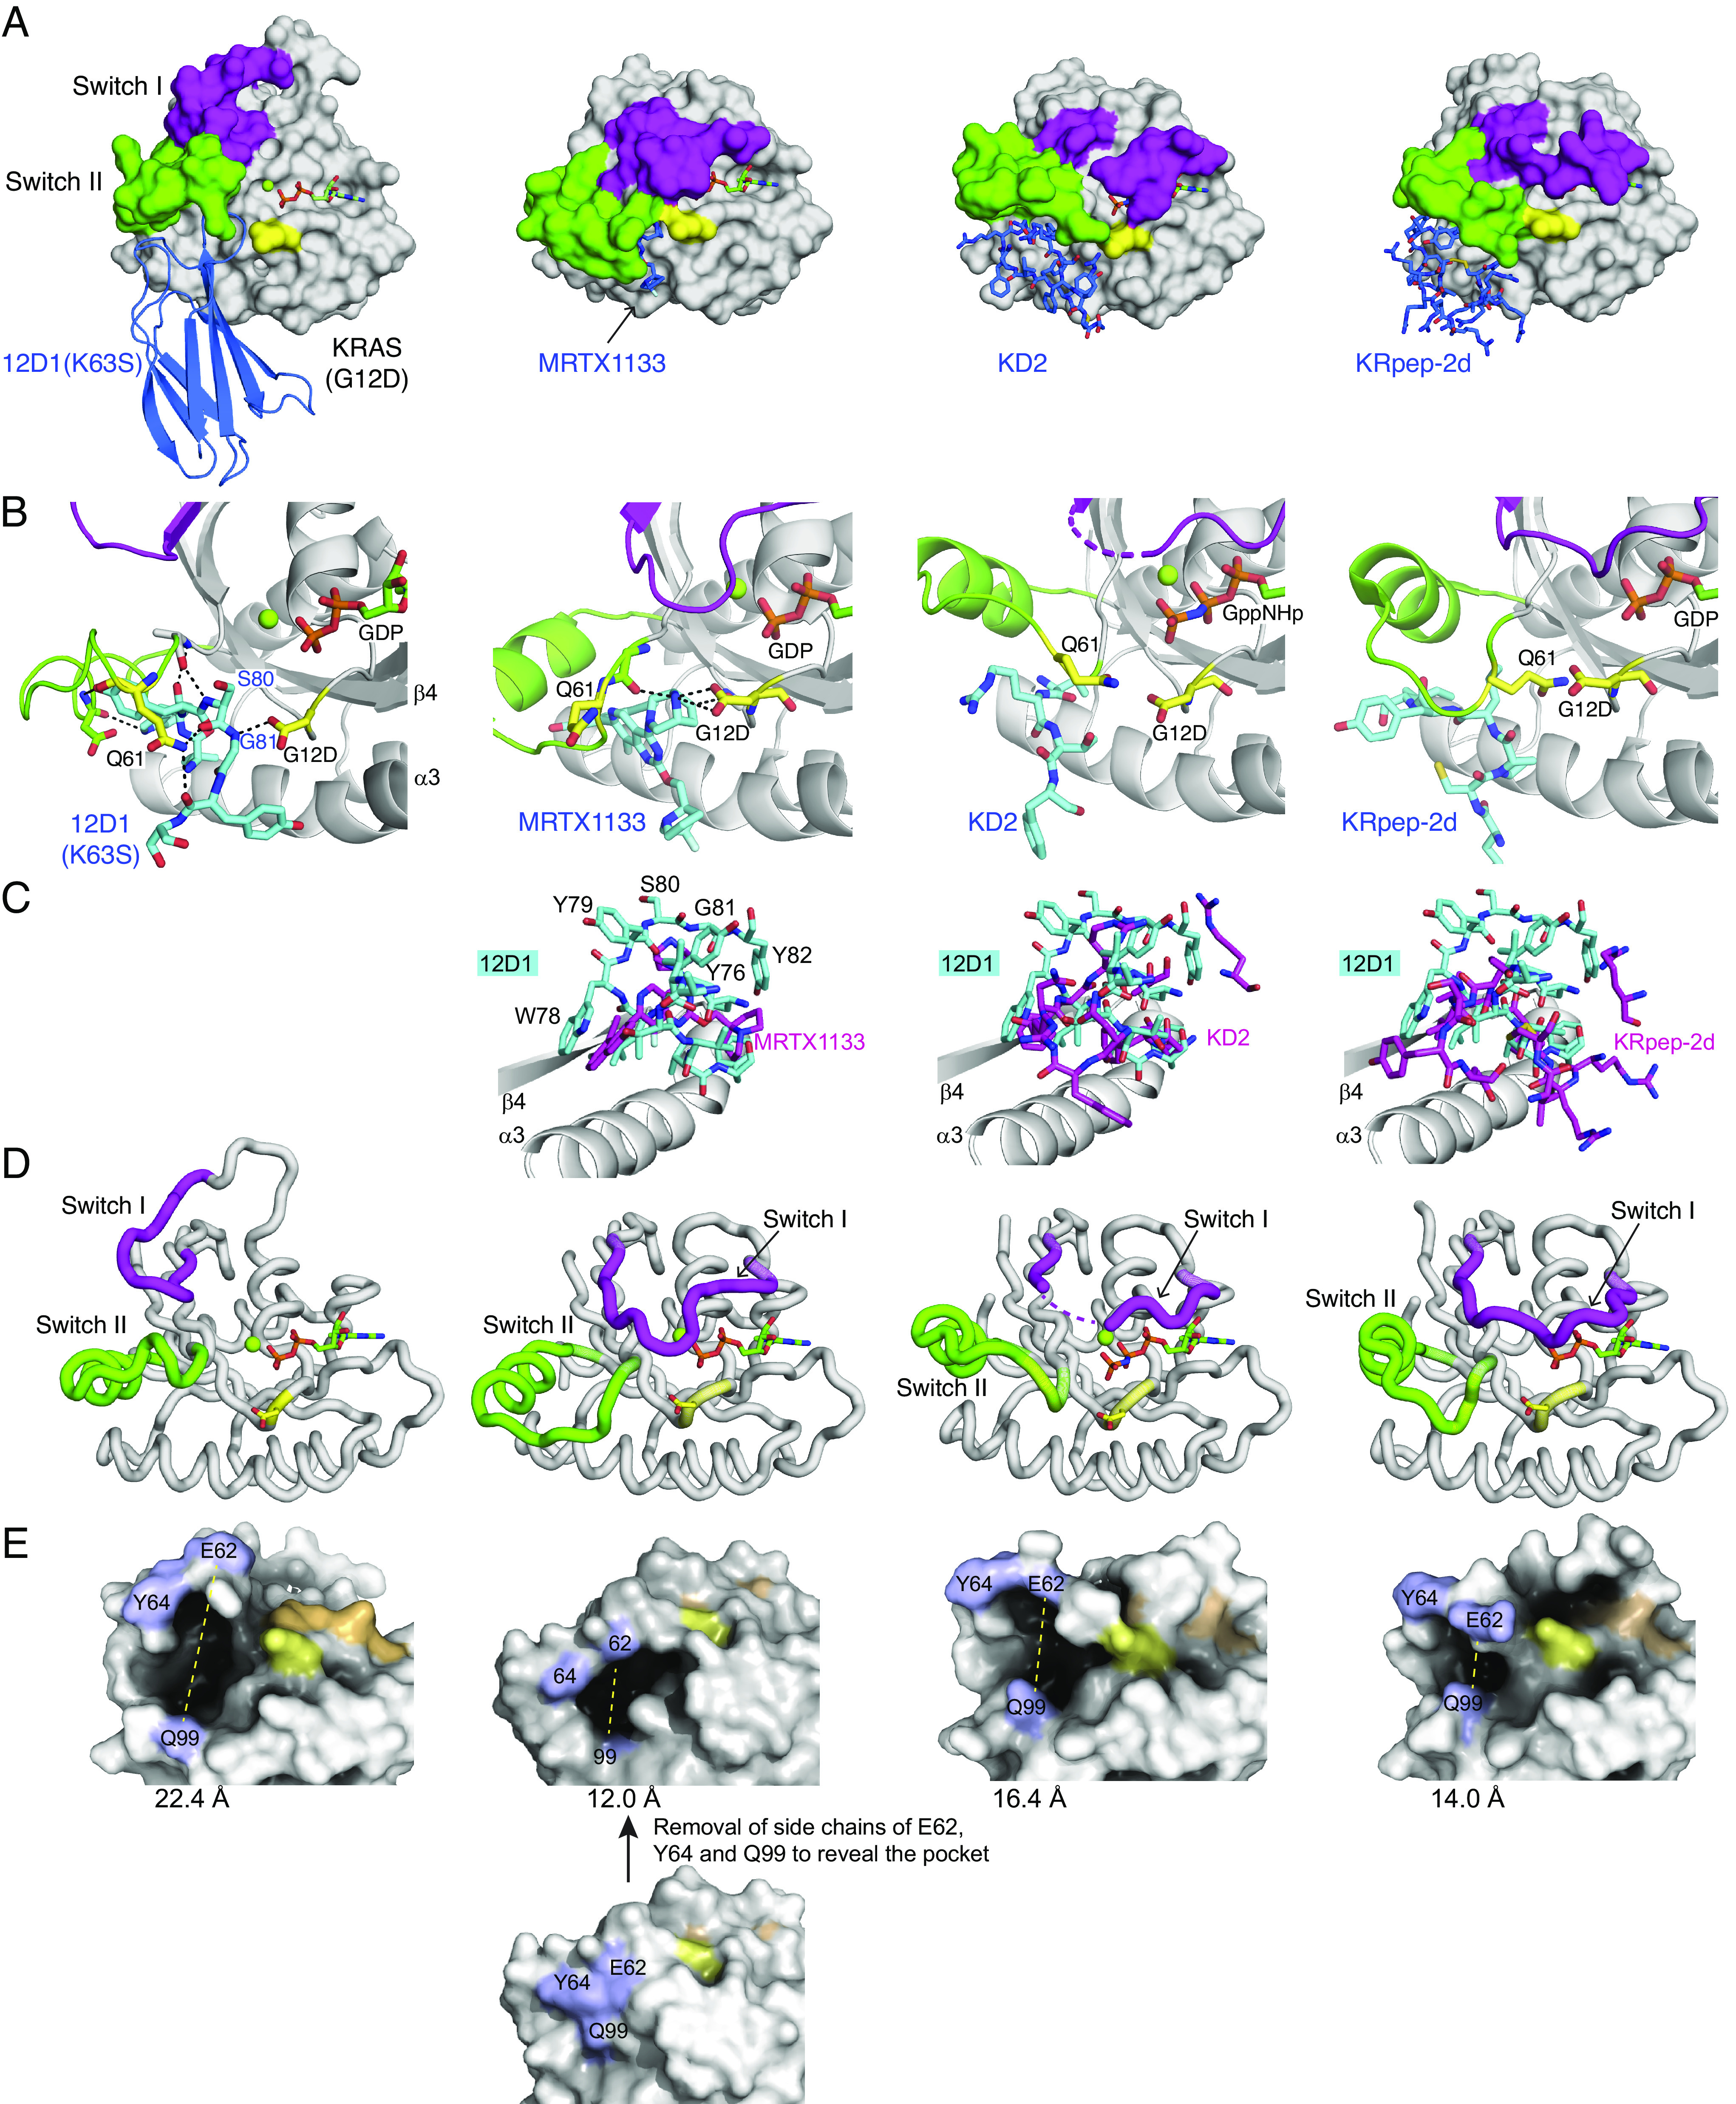
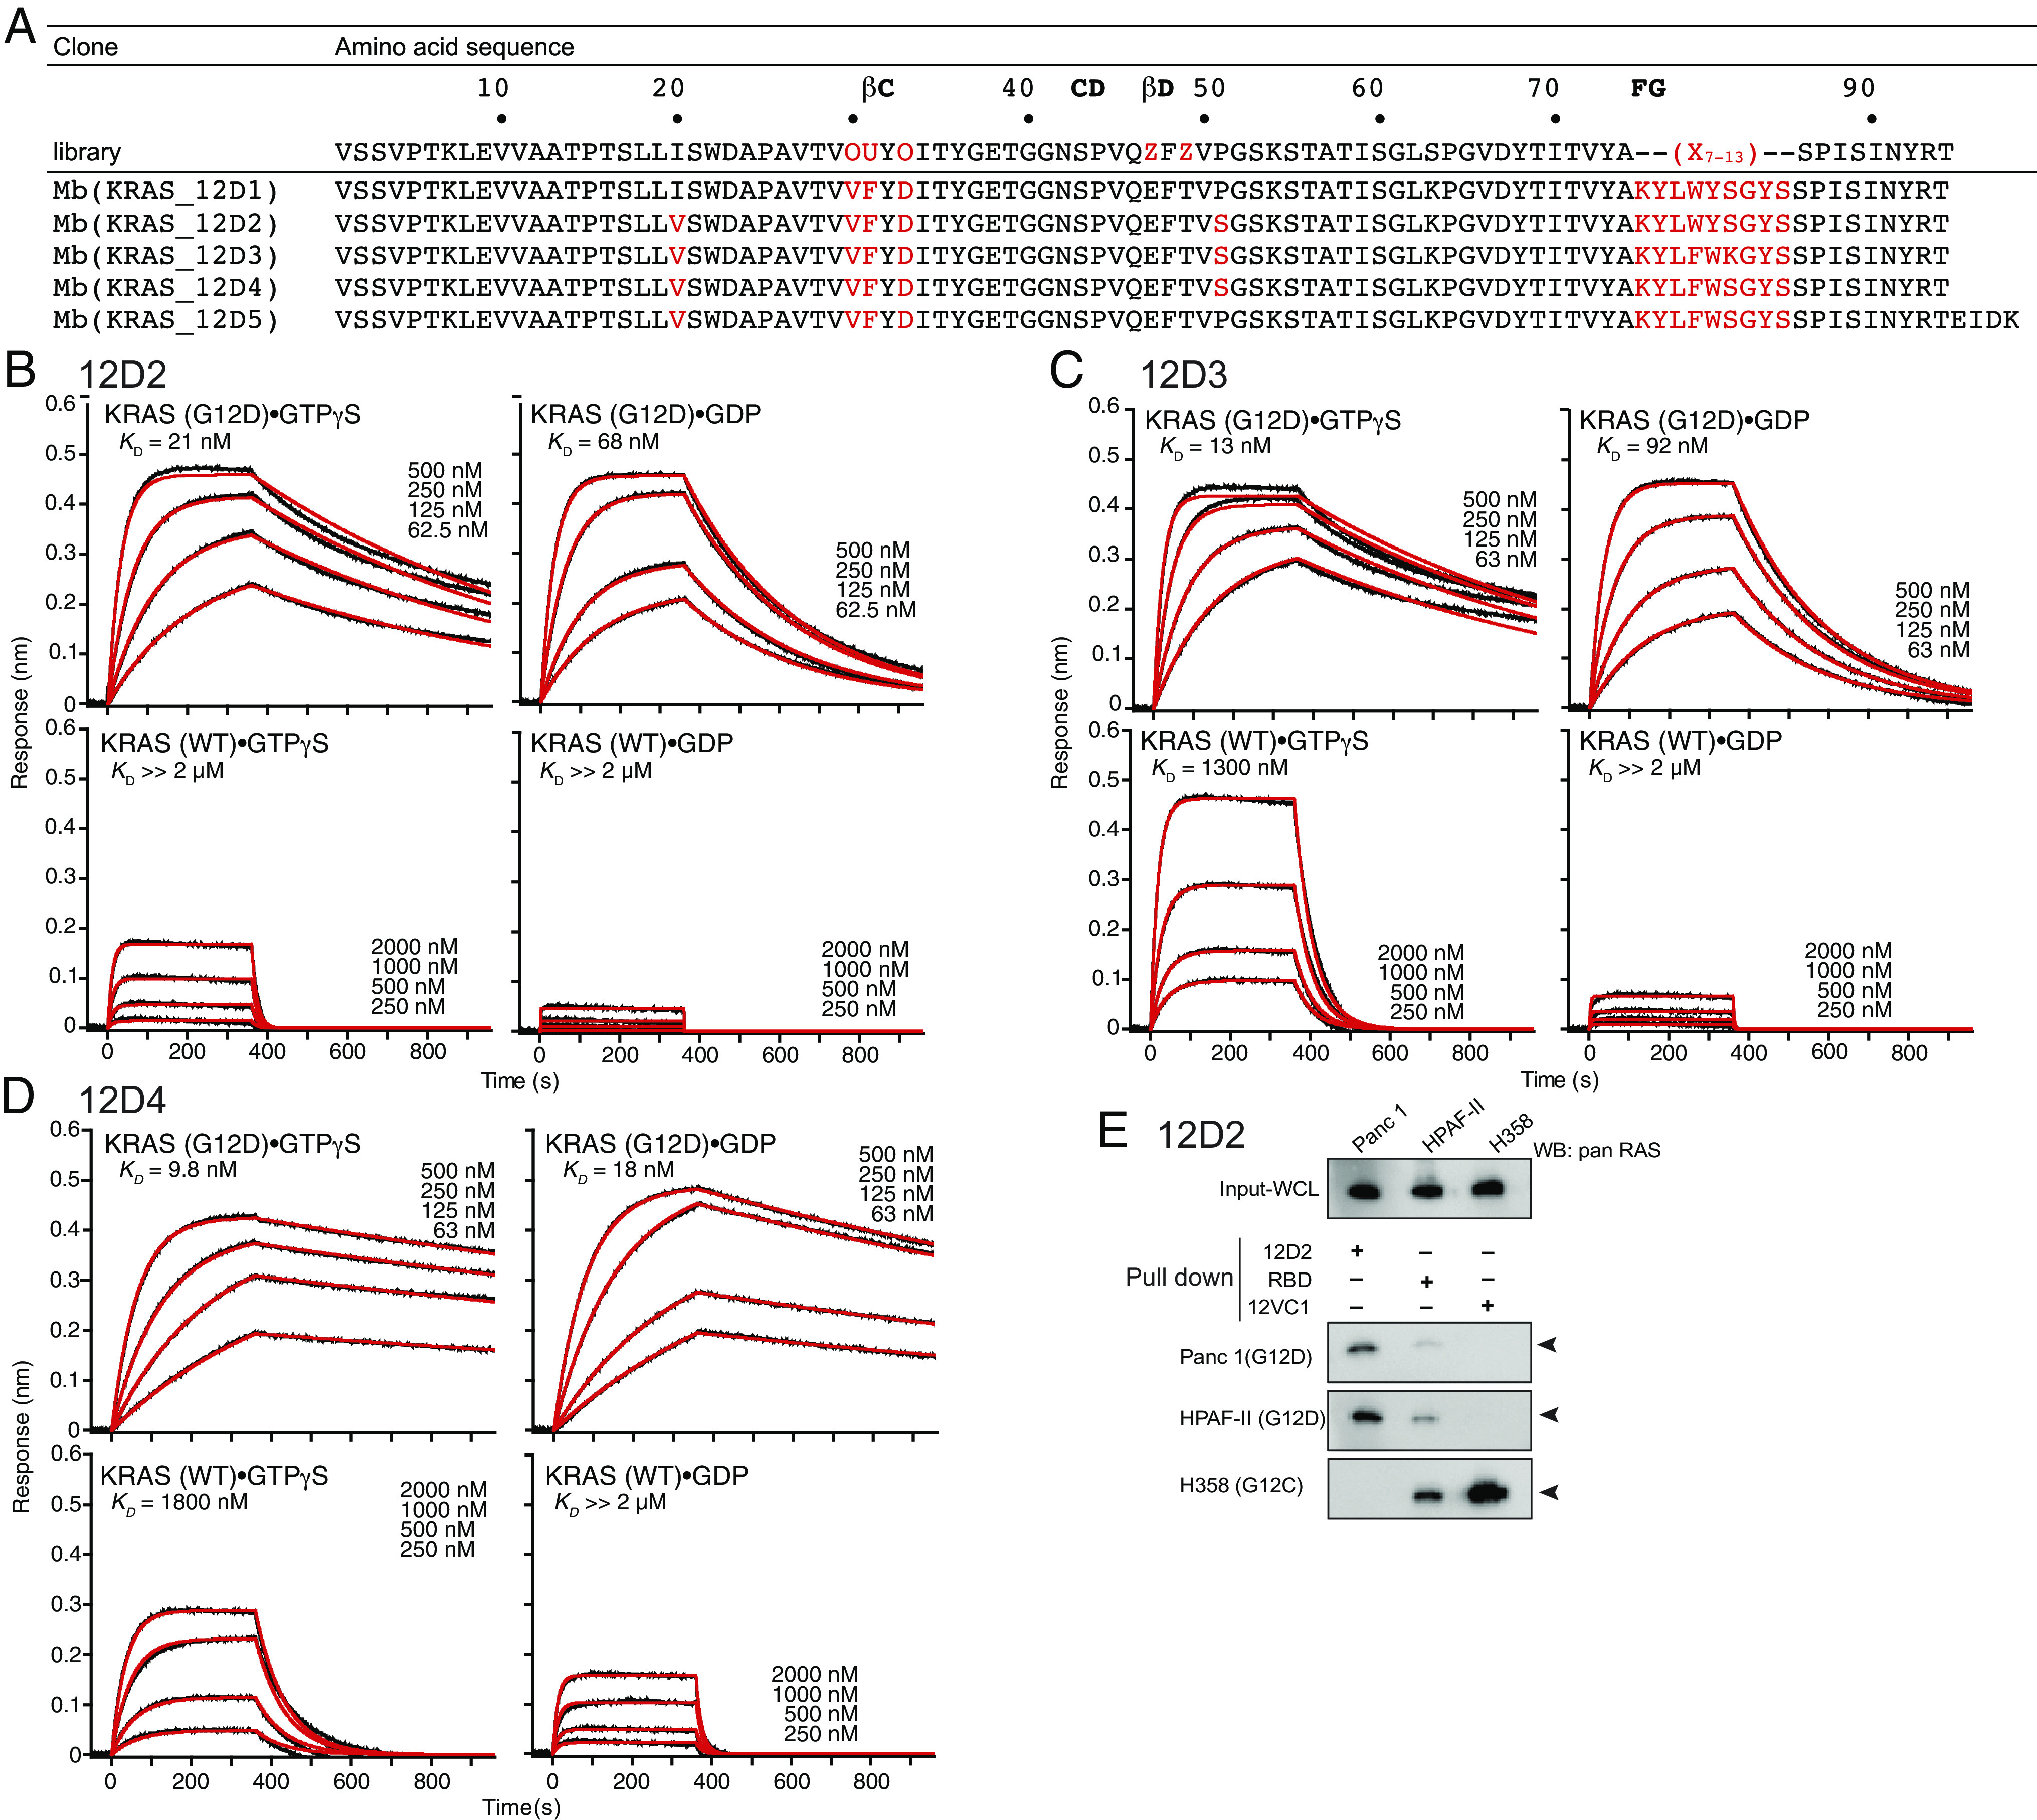
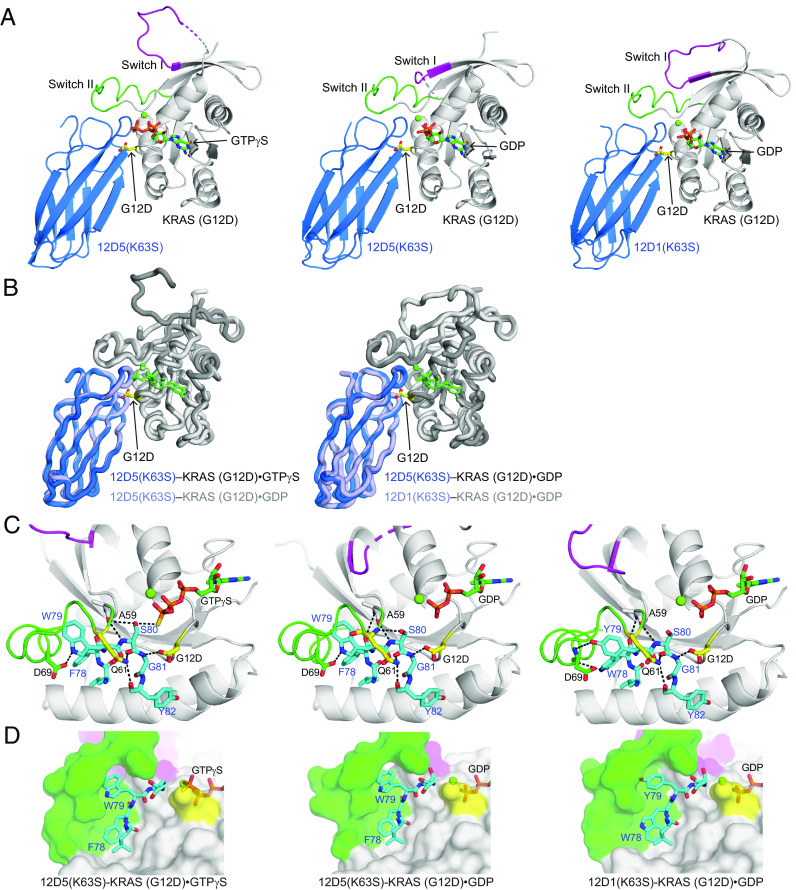
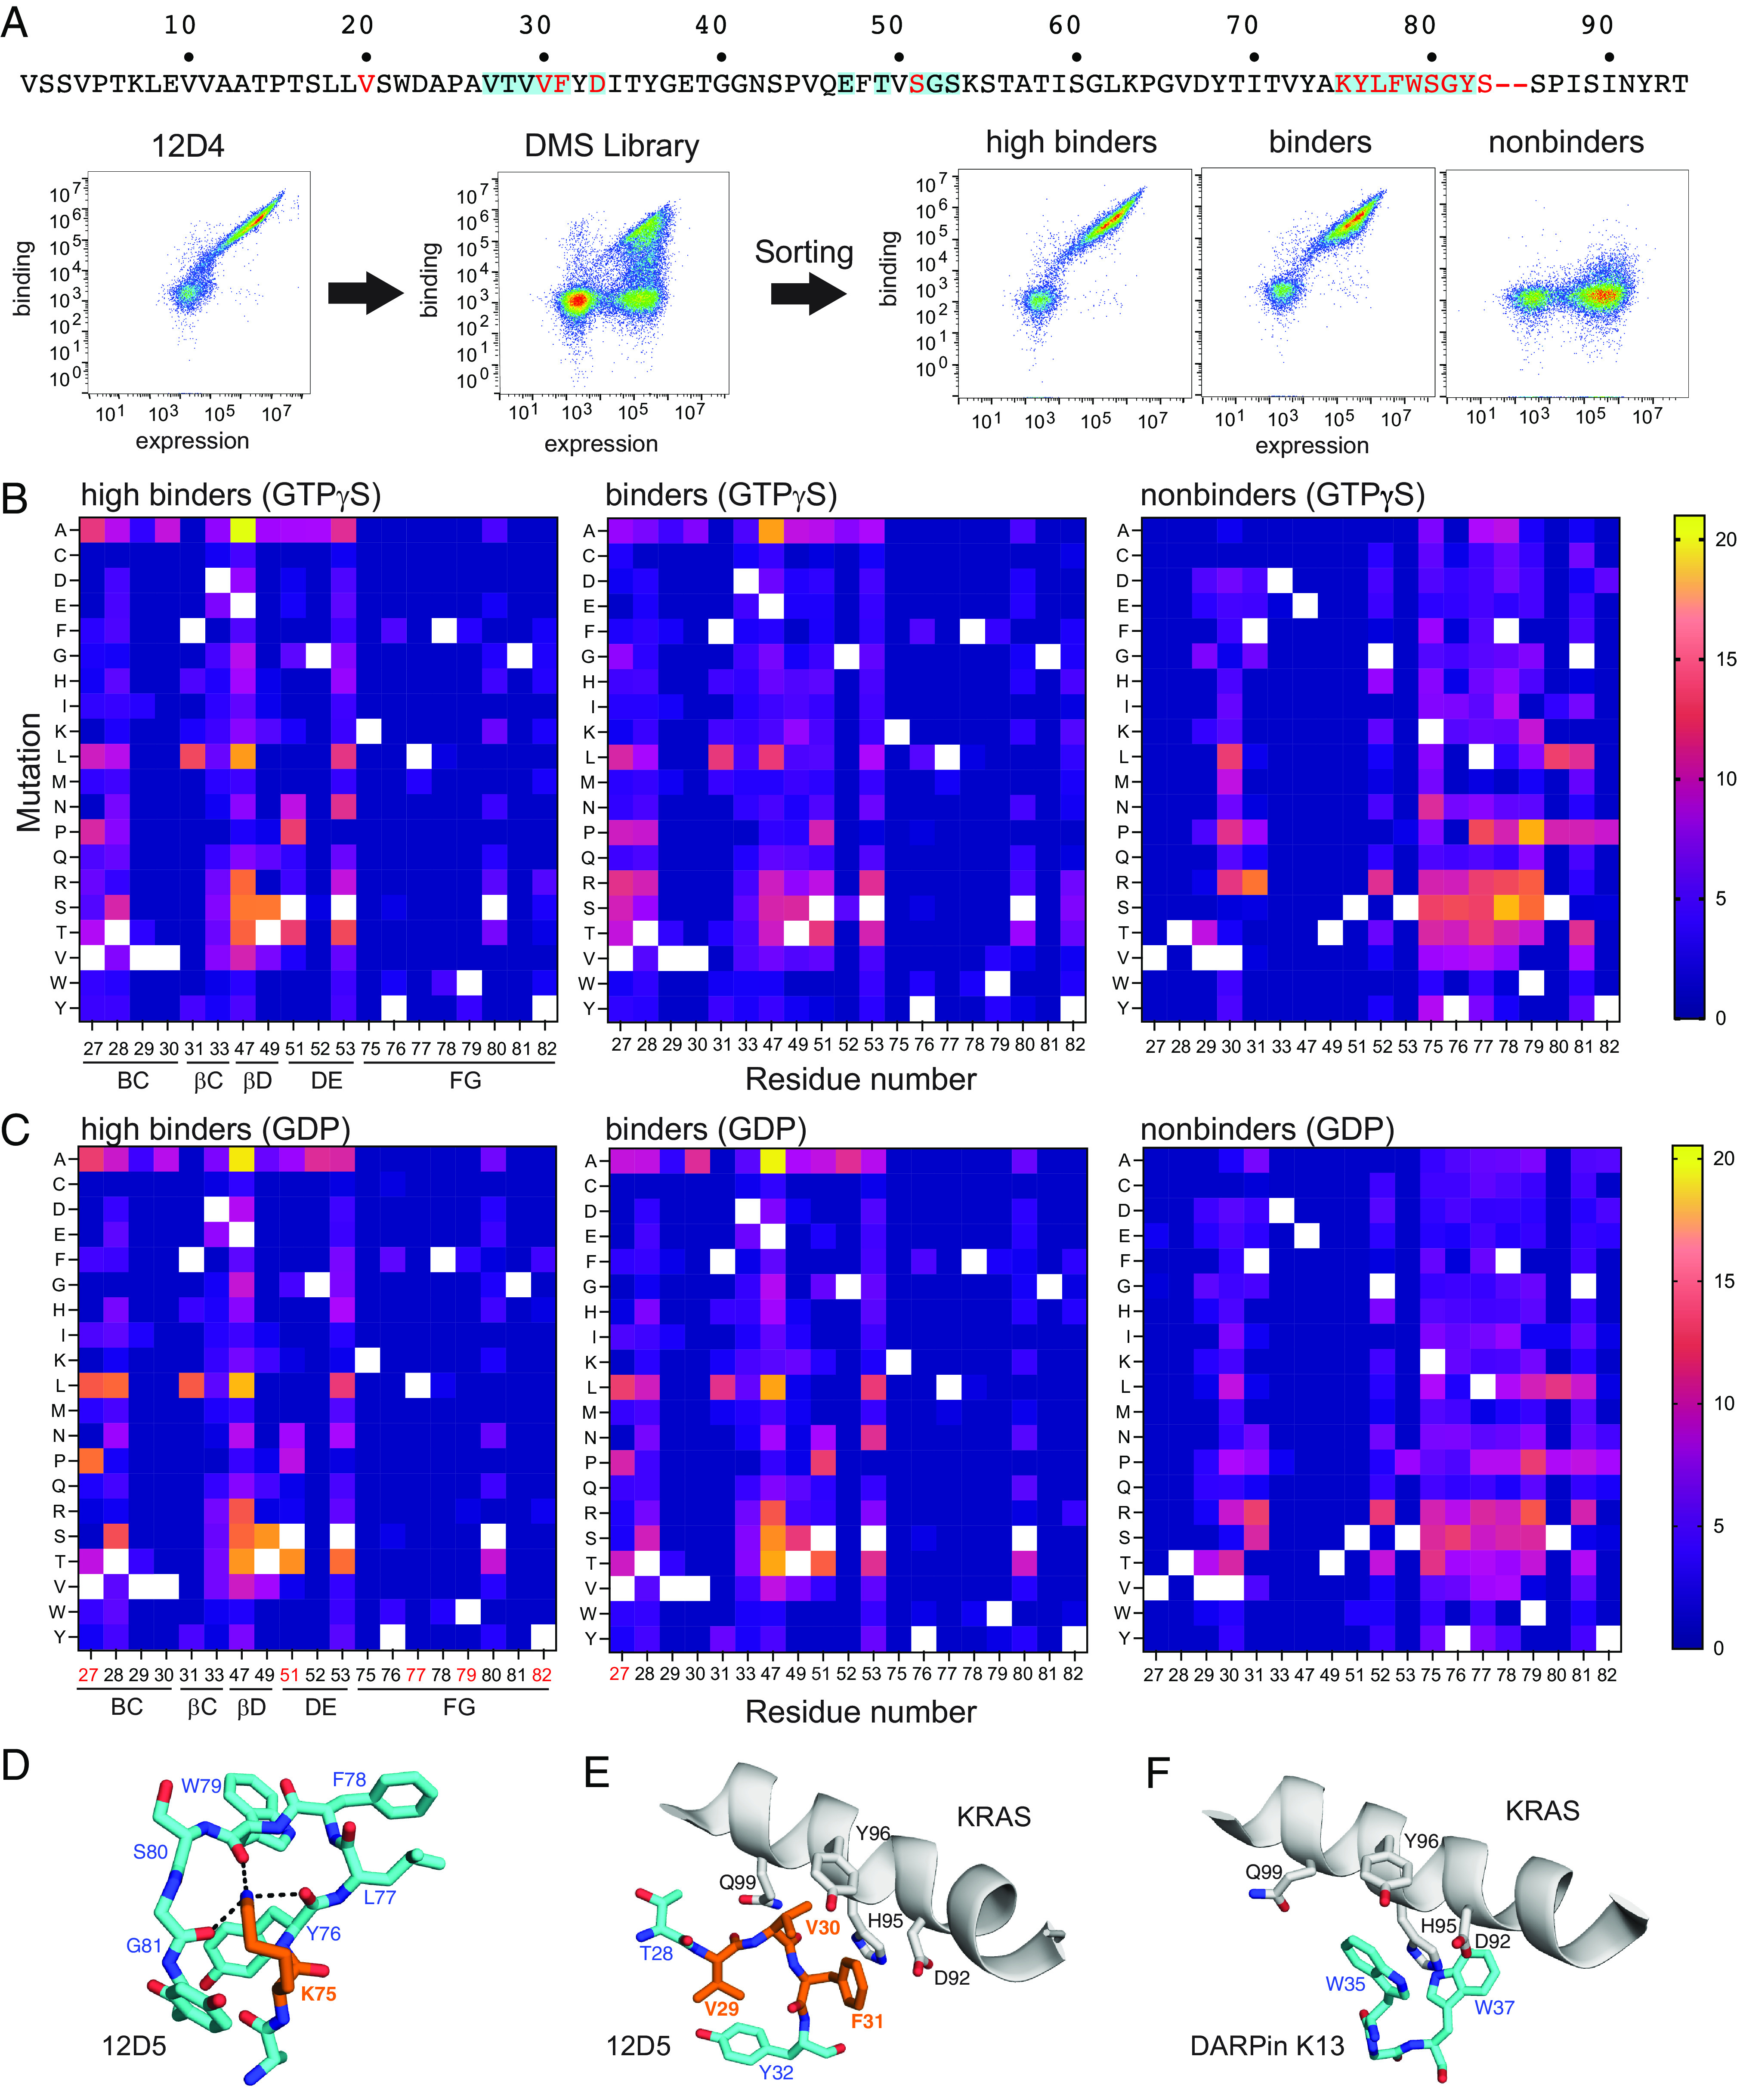
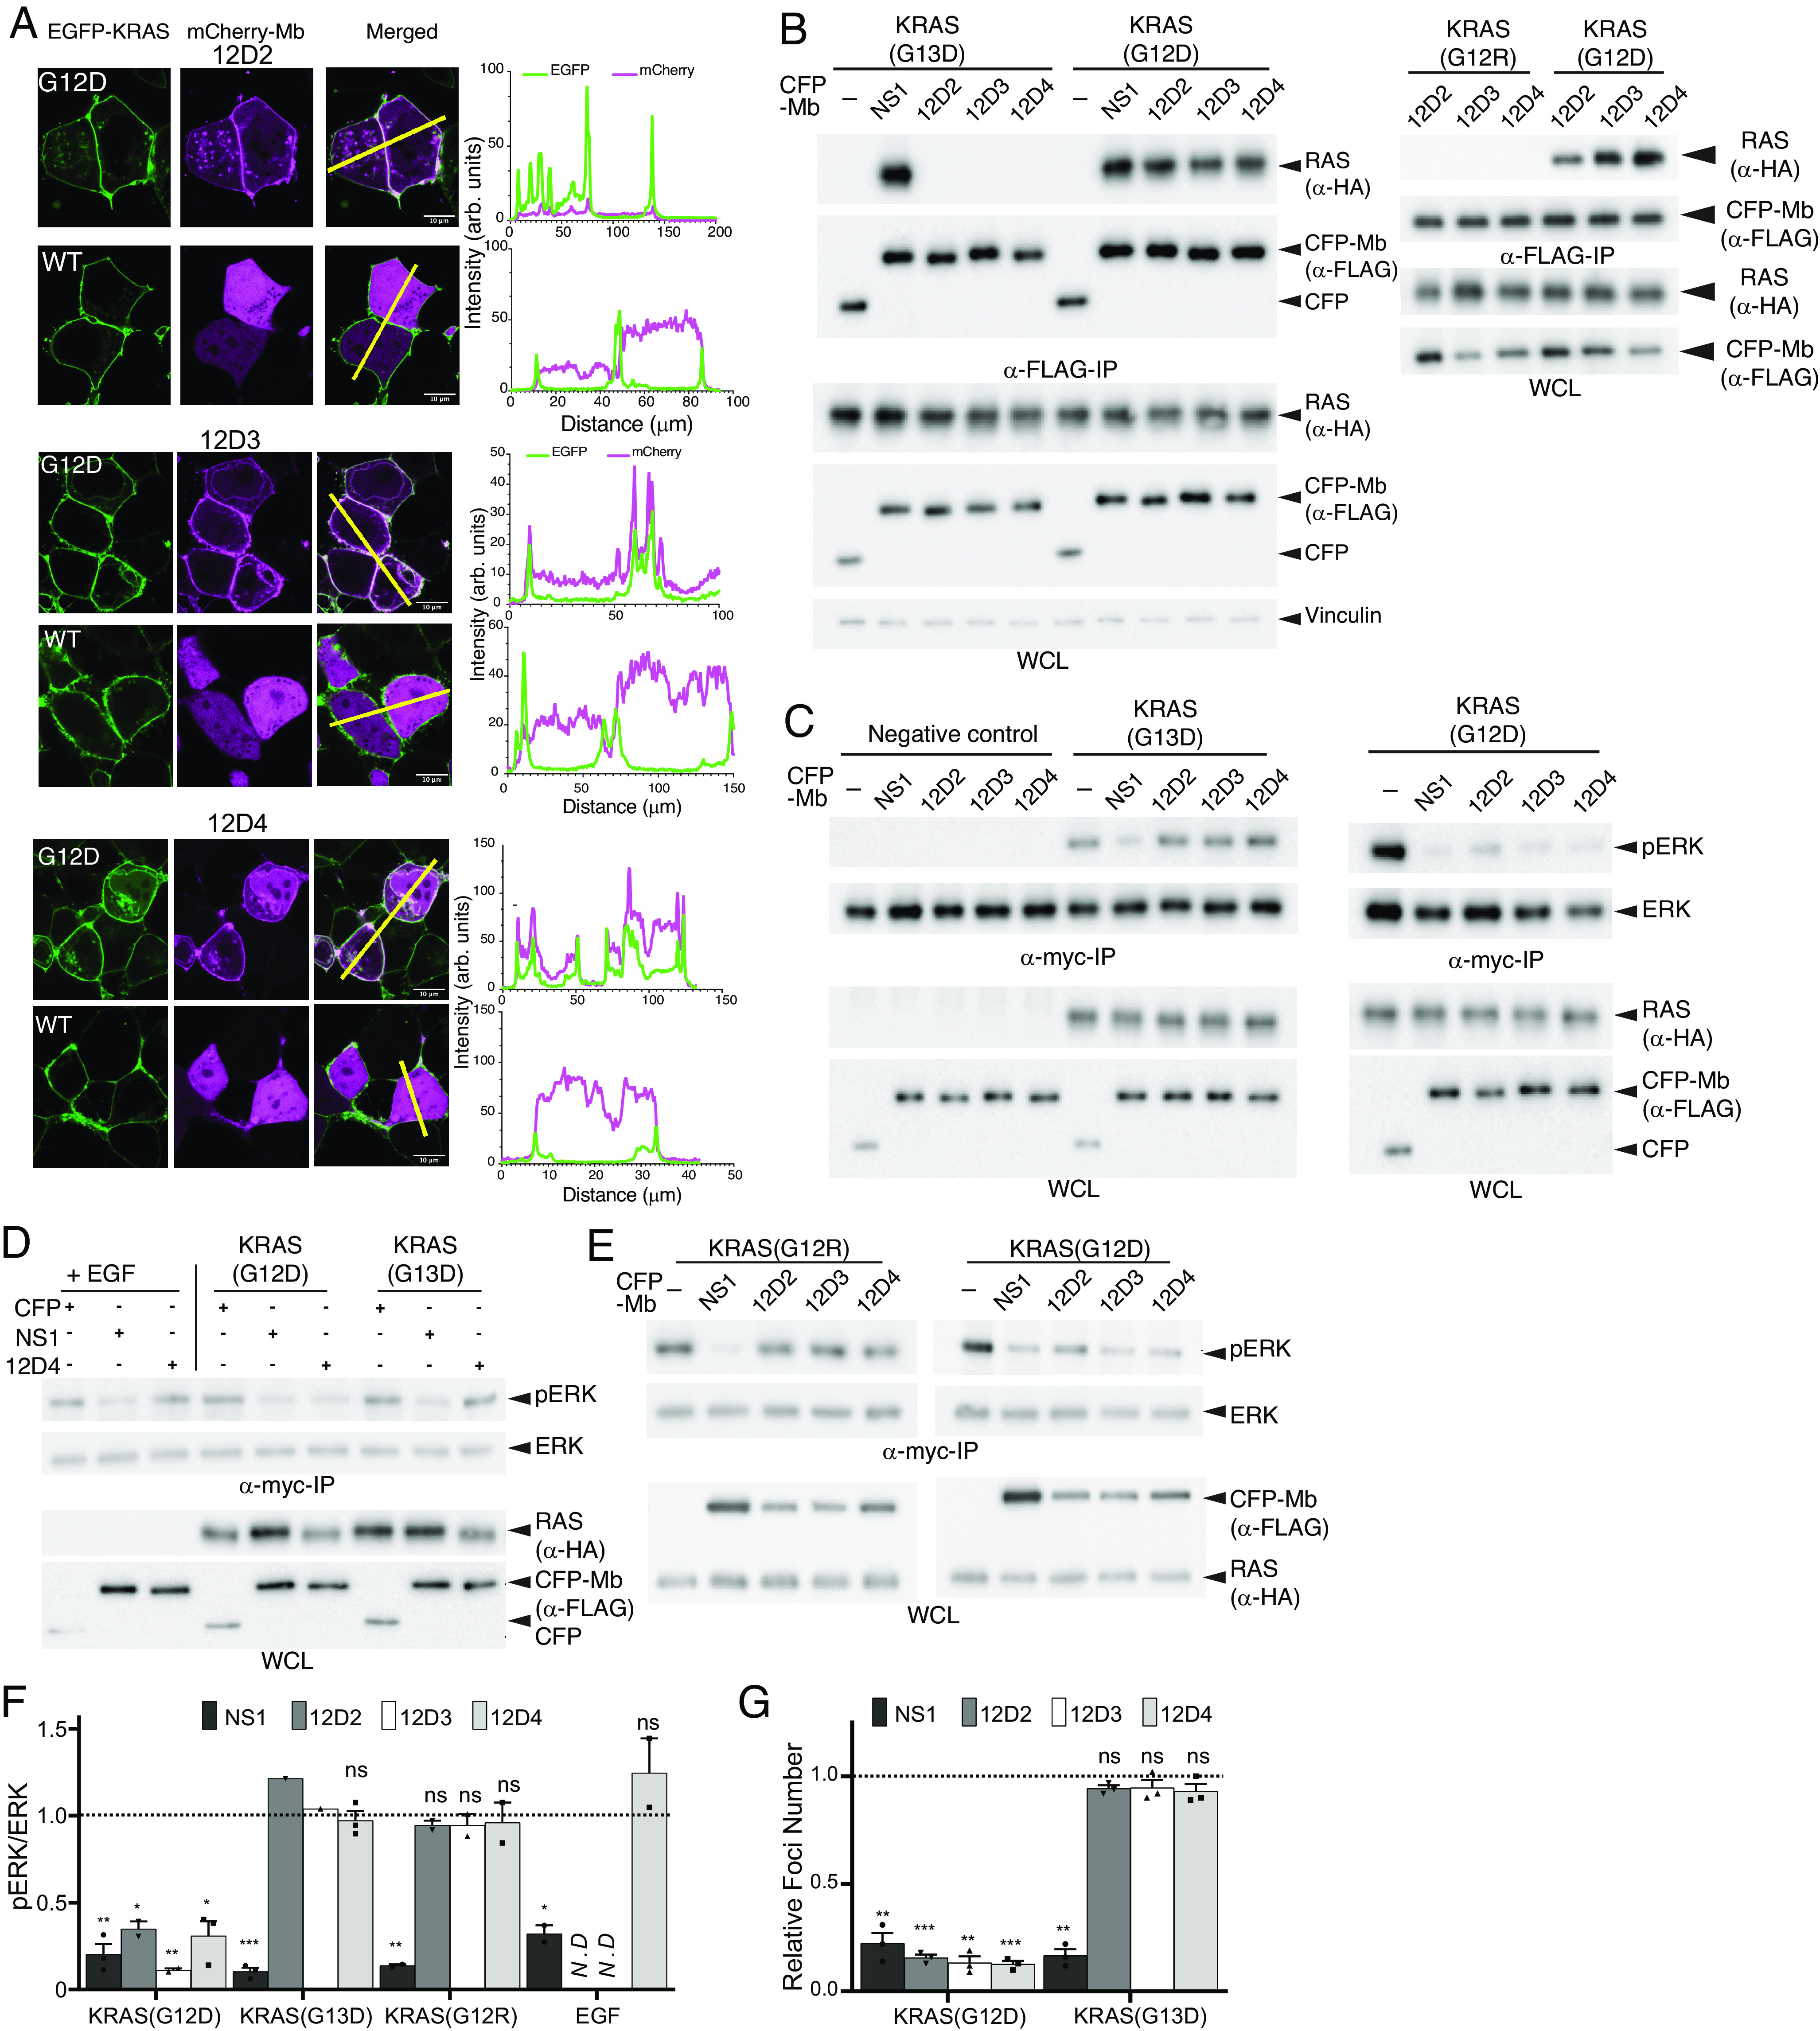
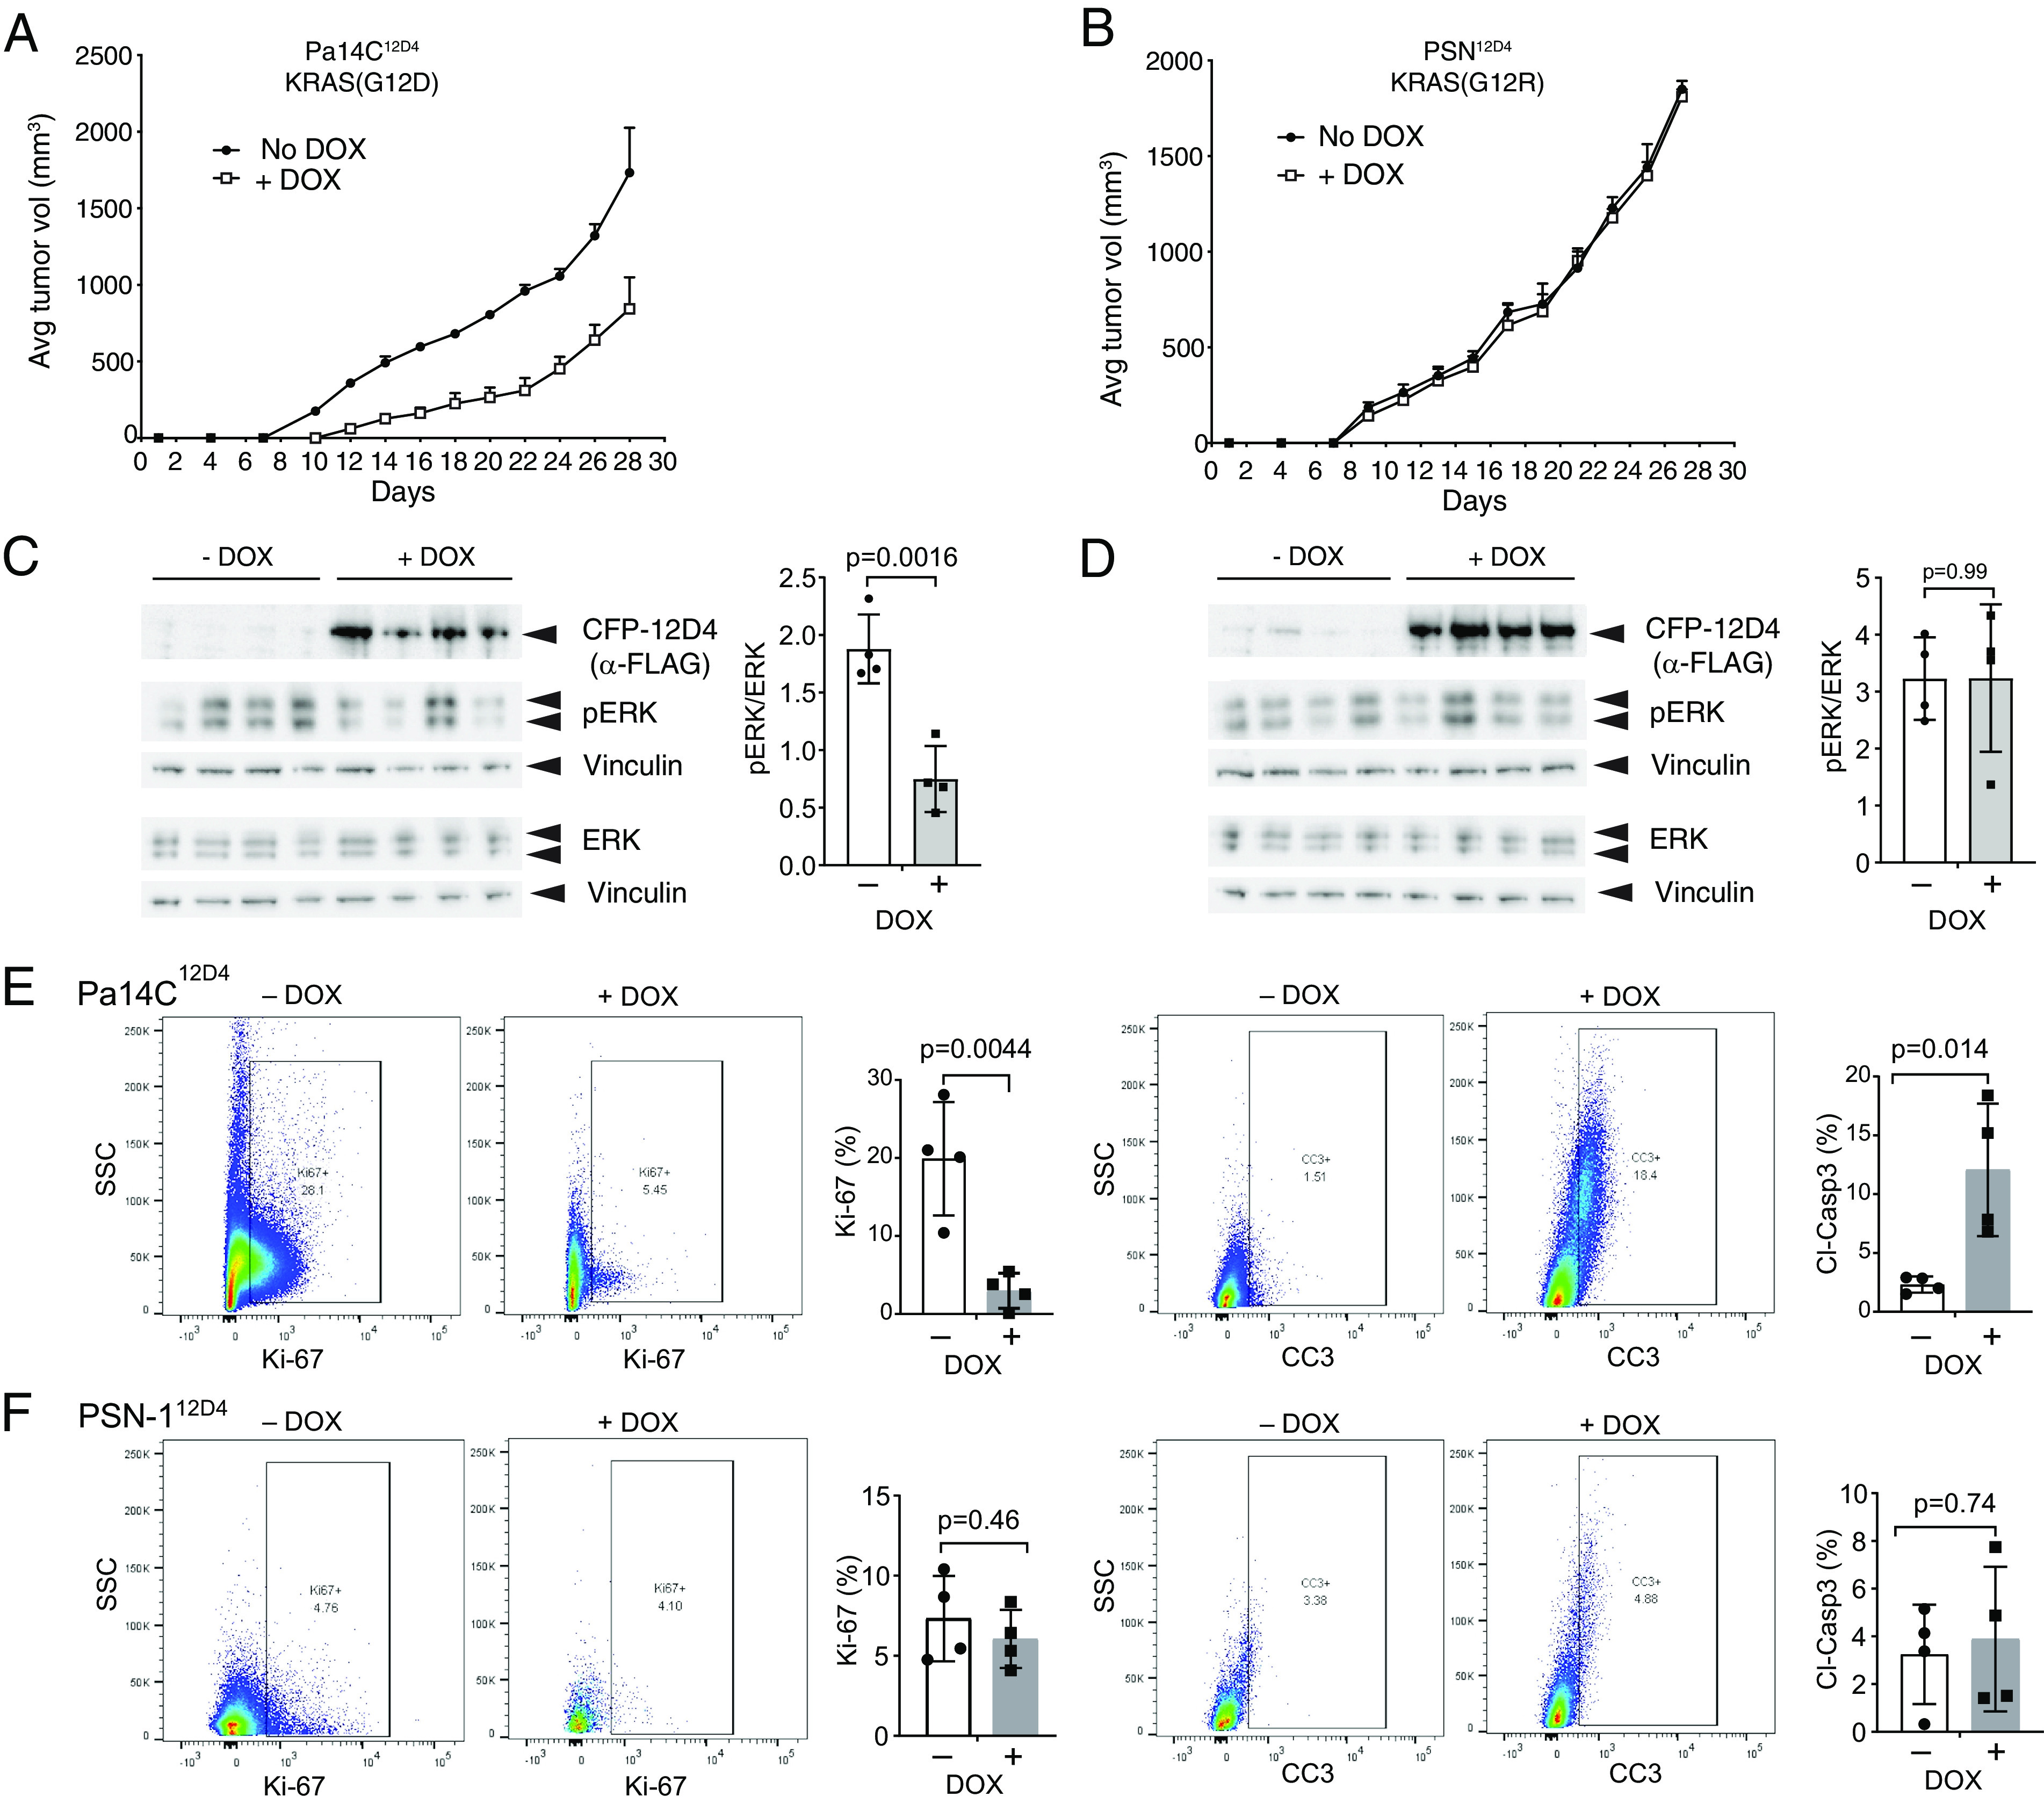
The G12D mutation is among the most common KRAS mutations associated with cancer, in particular, pancreatic cancer. Here, we have developed monobodies, small synthetic binding proteins, that are selective to KRAS(G12D) over KRAS(wild type) and other oncogenic KRAS mutations, as well as over the G12D mutation in HRAS and NRAS. Crystallographic studies revealed that, similar to other KRAS mutant-selective inhibitors, the initial monobody bound to the S-II pocket, the groove between switch II and α3 helix, and captured this pocket in the most widely open form reported to date. Unlike other G12D-selective polypeptides reported to date, the monobody used its backbone NH group to directly recognize the side chain of KRAS Asp12, a feature that closely resembles that of a small-molecule inhibitor, MTRX1133. The monobody also directly interacted with H95, a residue not conserved in RAS isoforms. These features rationalize the high selectivity toward the G12D mutant and the KRAS isoform. Structure-guided affinity maturation resulted in monobodies with low nM KD values. Deep mutational scanning of a monobody generated hundreds of functional and nonfunctional single-point mutants, which identified crucial residues for binding and those that contributed to the selectivity toward the GTP- and GDP-bound states. When expressed in cells as genetically encoded reagents, these monobodies engaged selectively with KRAS(G12D) and inhibited KRAS(G12D)-mediated signaling and tumorigenesis. These results further illustrate the plasticity of the S-II pocket, which may be exploited for the design of next-generation KRAS(G12D)-selective inhibitors.

Keywords: conformational plasticity; drug discovery; intracellular biologics; protein engineering; protein-protein interaction.


Conflict of interest statement

S.K. is a co-founder and holds equity in Aethon Therapeutics and Revalia Bio. P.A., T.H., A.K., K.W.T., and S.K. are listed as inventors of pending patents on technology described in this paper filed by New York University. A.K. and S.K. are listed as inventors on issued and pending patents on the monobody technology filed by the University of Chicago and Novartis. S.K. has received research funding from Aethon Therapeutics, Argenx BVBA, Black Diamond Therapeutics, and Puretech Health. S.K. received consulting fees from Aethon Therapeutics and Black Diamond Therapeutics.

Figures

Fig. 1.
Fig. 1.
KRAS(G12D)-selective monobody, 12D1. (A) Binding titration of 12D1 displayed on the yeast cell surface to the indicated KRAS proteins. The mean (n = 3; technical replicates) of the median fluorescence intensity is shown. (B) Specificity of 12D1 to different KRAS mutants bound to GTPγS (Left) and GDP (Right) at 100 nM. The bars indicate the means (n = 3, technical replicates). (C) BLI sensorgrams of the interaction between 12D1 and KRAS. The indicated KRAS proteins were immobilized and binding of a soluble 12D1 sample was measured. The KD values are from the global fit of a 1:1 binding model to the data. (D) Inhibition by 12D1 of the binding of KRAS(G12D)•GTPγS to RAF RBD. Binding of 150 nM biotinylated KRAS(G12D)•GTPγS in complex with streptavidin-Dylight650 to RAF RBD immobilized on M270 Dynabeads in the presence of 0 nM to 1,000 nM 12D1. Complete inhibition (100% inhibition) is defined as the signal intensity in the absence of KRAS(G12D). (E) 12D1 does not bind to HRAS(G12D) in the absence of the KRAS-mimicking mutation, Q95H. (F) 12D1 does not bind to NRAS (G12D). Binding titration of the indicated HRAS and NRAS mutant samples to 12D1 displayed on the yeast cell surface is shown.
Fig. 2.
Fig. 2.
The crystal structure of 12D1(K63S) in complex with KRAS(G12D)•GDP, and comparisons with the structures of other KRAS(G12D) inhibitors. (A) Comparison of 12D1(K63S)–KRAS(G12D)•GDP with MRTX1133–KRAS(G12D)•GDP (PBD: 7RPZ), KD2–KRAS(G12D)•GppNHp (PDB: 6WGN), and KRpep-2d–KRAS(G12D)•GDP (PDB: 5XCO). 12D1(K63S) and other inhibitors are depicted in blue. The switch I and switch II regions and the G12D residue are shown in magenta, green, and yellow, respectively. MRTX1133 is only marginally visible in this mode of presentation. (B) Close-up views of the G12D and Q61 residues (yellow) and surrounding residues of inhibitors (cyan) in the four structures. The hydrogen bonds are indicated as dashed lines. 12D1(K63S) directly interacts with the side chain of the G12D mutation, which resembles interaction between MRTX1133 and the G12D mutation. (C) The superpositions of other inhibitors (magenta) on 12D1 residues (cyan) in the S-II pocket. The structures were superimposed using residues 76–162 of KRAS as the reference. The β4 and α3 regions of KRAS are shown to orient the reader. (D) A comparison of the backbone conformations of the switch I (magenta) and switch II (green) regions of KRAS in the four structures. The inhibitors are not shown for clarity. (E) A comparison of the S-II pocket in the four structures. E62RAS, Y64RAS, and Q99RAS resides are shown in light blue, the nucleotides are shown in orange, and Asp12 in yellow. The distance between E62RAS and Q99RAS (yellow dotted line) is indicated under each structure. For MRTX1133–KRAS(G12D)•GDP, the side chains of E62RAS, Y64RAS, and Q99RAS are removed in order to expose the pocket.
Fig. 3.
Fig. 3.
Affinity maturation of KRAS(G12D)-selective monobodies. (A) Amino acid sequences of monobody clones. Residues in red indicate mutations with respect to the parental scaffold. (BD) BLI sensorgrams of 12D2 (B), 12D3 (C), and 12D4 (D) interacting with immobilized KRAS. The KD value was determined from the global fit of the data with a 1:1 binding model. (E) The capture of endogenous RAS proteins with 12D2. The “pull down” reaction was done with the indicated monobodies (12D2 and 12VC1) and RAF RBD, followed by immunoblotting using an anti-pan RAS antibody. 12VC1 is selective to KRAS(G12C) and KRAS(G12V) and used as a control.
Fig. 4.
Fig. 4.
Crystal structures of 12D5(K63S) in complex with KRAS(G12D)•GTPγS and with KRAS(G12D)•GDP. (A) A comparison of 12D5(K63S)–KRAS(G12D)•GTPγS (Left) and 12D5(K63S)–KRAS(G12D)•GDP (Center) with 12D1(K63S)–KRAS(G12D)•GDP (Right). The color scheme is the same as in Fig. 2. (B) Superpositions of 12D5(K63S)–KRAS(G12D)•GTPγS (Left) and 12D1(K63S)–KRAS(G12D)•GDP (Right) on 12D5(K63S)–KRAS(G12D)•GDP. (C) Close-up views of the G12DRAS and Q61RAS residues (yellow) and surrounding residues of 12D1 or 12D5 (cyan). The hydrogen bonds are indicated as dashed lines. (D) Close-up views of the S-II pocket and surrounding residues of 12D1 or 12D5 (cyan).
Fig. 5.
Fig. 5.
Deep mutational scanning analysis of 12D4 interface residues. (A) Flow cytometry profiles monitoring the binding of KRAS(G12D)•GTPγS (100 nM) to yeast cells displaying 12D4 (Left), the deep mutational scanning library (Middle), and sorted pools (Right). The mutated positions in the 12D4 sequence are highlighted with the cyan boxes. (B) Heat map representation of the numbers of reads for substitutions recovered in the three pools from library sorting with KRAS(G12D)•GTPγS. The number of reads for each substitution was normalized to the total number of reads for each entire pool and multiplied by 1,000. The white squares indicate the wild-type residues. The locations of the residues in the monobody secondary structure elements are indicated on the bottom of the Left panel. (C) Heat map representation of the numbers of reads for substitutions recovered in the three pools from library sorting with KRAS(G12D)•GDP. The data were analyzed in the same manner as in panel B. The residue numbers in red indicate positions whose amino acid profile differs between the pools sorted with KRAS(G12D)•GTPγS and KRAS(G12D)•GDP. (D and E) Close-up views of K75Mb and adjacent residues (D), and of V29Mb, V30Mb, F31Mb, and adjacent residues (E) in the 12D5–KRAS(G12D)•GTPγS complex. Nε of K75Mb interacts with three backbone carbonyl groups of residues in the FG loop of 12D5, depicted with the dashed lines. (F) The region corresponding to that depicted in E of DARPin K13 in complex with KRAS(WT) (PDB:6H46). The π–π stacking interaction between W35 of DARPin K13 and H95 of KRAS(WT) resembles the interaction between F31Mb of monobody 12D5 and H95 of KRAS(G12D) depicted in E.
Fig. 6.
Fig. 6.
Selective engagement and inhibition of KRAS(G12D) by monobodies. (A) Colocalization of mCherry-fused 12D2, 12D3, and 12D4 (pseudo-color magenta) with overexpressed EGFP-fused KRAS(G12D) and KRAS(WT) (pseudo-color green) in HEK293T cells. The scale bar denotes 10 μm. The graphs on the right show the fluorescence intensity profiles under the yellow lines in the microscopy images. (B) Coimmunoprecipitation of HA-tagged KRAS mutants and FLAG- and CFP-tagged monobodies. The proteins were coexpressed in HEK-293 cells and the capture of KRAS proteins was probed. The NS1 monobody, which is agnostic to KRAS mutations, was used as a control. (CE) Effects of monobodies on ERK–MAPK activation mediated by KRAS mutants and by EGF stimulation. CFP-tagged monobodies and MYC-tagged ERK were coexpressed in HEK293 cells, and phosphorylation of MYC-tagged ERK was detected following MYC IP and western blotting. CFP and CFP-NS1 were used as controls. The negative control lanes in C show results with cells without the expression of a KRAS mutant. (F) Quantification of pERK levels for data in panels CE. The pERK level was first normalized to the total ERK level. The resulting value in the presence of the indicated monobody was divided by the value for CFP alone. The dotted line at 1 represents the normalized pERK level by CFP alone without inhibition. The P values were determined using a Student’s t test between CFP-monobody and CFP for each condition. (G) Inhibition of KRAS(G12D)-mediated transformation of NIH/3T3 cells with monobodies, as measured by quantification of foci numbers. The raw data are provided in SI Appendix, Fig. S7A. Each bar represents the ratio of foci number with CFP-monobody to that with CFP alone (n = 3; mean ± SD). The P values were determined using a Student’s t test between CFP-monobody and CFP for each condition. *P ≤ 0.05; **P ≤ 0.01; and ***P ≤ 0.001.
Fig. 7.
Fig. 7.
Selective inhibition of KRAS(G12D)-driven tumorigenesis by monobody 12D4. (A and B) The effects of 12D4 expression on tumor growth in mouse xenograft models of Pa14C cells harboring KRAS(G12D) (A) and of PSN1 cells harboring KRAS(G12R) (B). The engineered PDAC cells were injected subcutaneously in the flanks of athymic nude mice. The mice were treated without (−) or with (+) DOX beginning on day 2 following injection, and tumor development was monitored. The mean tumor volumes are shown (n = 4 per condition). The error bars indicate SD. (C and D) Effect of DOX-induced CFP-12D4 expression on ERK–MAPK activation. Tumor lysates were probed for the indicated proteins by immunoblotting. Vinculin was used as a loading control. The graphs show the normalized pERK/ERK ratio for each set of tumor lysates. The P values were calculated using an unpaired Student’s t test. (E and F) Flow cytometric analysis for Ki-67 and cleaved caspase-3 for tumor cells from various cohorts. The gating strategy is shown in SI Appendix, Fig. S7 BF. Cells from the dox-induced conditions had fewer cells in the analysis because they had low viability. The P values were calculated using an unpaired Student’s t test.

References

    1. Cox A. D., Fesik S. W., Kimmelman A. C., Luo J., Der C. J., Drugging the undruggable RAS: Mission possible? Nat. Rev. Drug. Discov. 13, 828–851 (2014). - PMC - PubMed
    1. Moore A. R., Rosenberg S. C., McCormick F., Malek S., RAS-targeted therapies: Is the undruggable drugged? Nat. Rev. Drug. Discov. 19, 533–552 (2020). - PMC - PubMed
    1. Ostrem J. M., Peters U., Sos M. L., Wells J. A., Shokat K. M., K-Ras(G12C) inhibitors allosterically control GTP affinity and effector interactions. Nature 503, 548–551 (2013). - PMC - PubMed
    1. Janes M. R., et al. , Targeting KRAS mutant cancers with a covalent G12C-specific inhibitor. Cell 172, 578–589.e17 (2018). - PubMed
    1. Canon J., et al. , The clinical KRAS(G12C) inhibitor AMG 510 drives anti-tumour immunity. Nature 575, 217–223 (2019). - PubMed

Publication types

MeSH terms

Substances