. 2023 Sep;10(25):e2302136.
doi: 10.1002/advs.202302136. Epub 2023 Jul 3.

Liver-Inspired Polyetherketoneketone Scaffolds Simulate Regenerative Signals and Mobilize Anti-Inflammatory Reserves to Reprogram Macrophage Metabolism for Boosted Osteoporotic Osseointegration

Affiliations

Liver-Inspired Polyetherketoneketone Scaffolds Simulate Regenerative Signals and Mobilize Anti-Inflammatory Reserves to Reprogram Macrophage Metabolism for Boosted Osteoporotic Osseointegration

Hao Gu et al. Adv Sci (Weinh). 2023 Sep.

Abstract

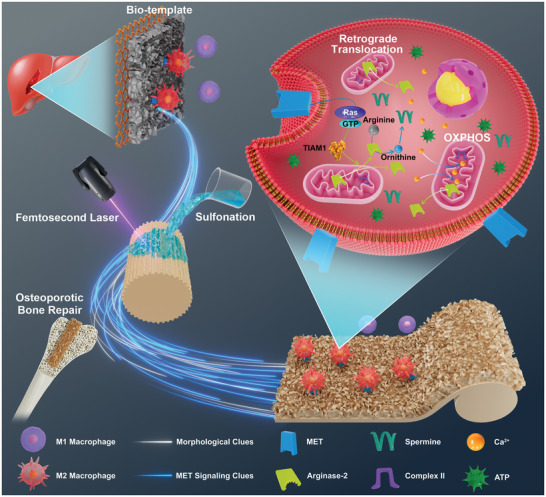
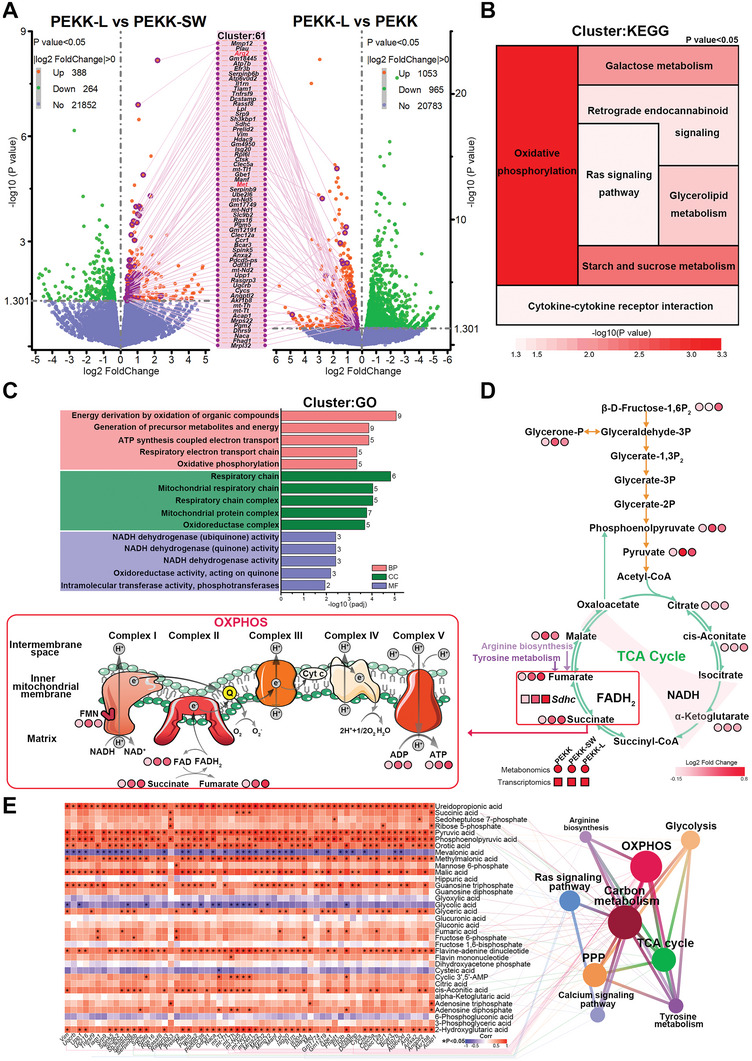
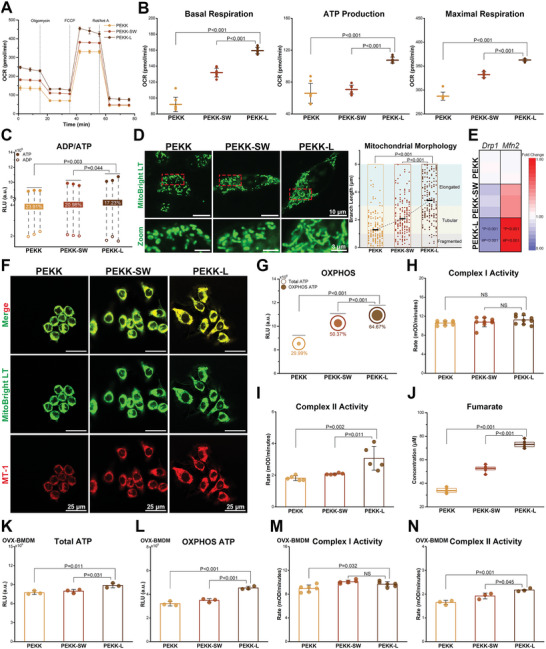
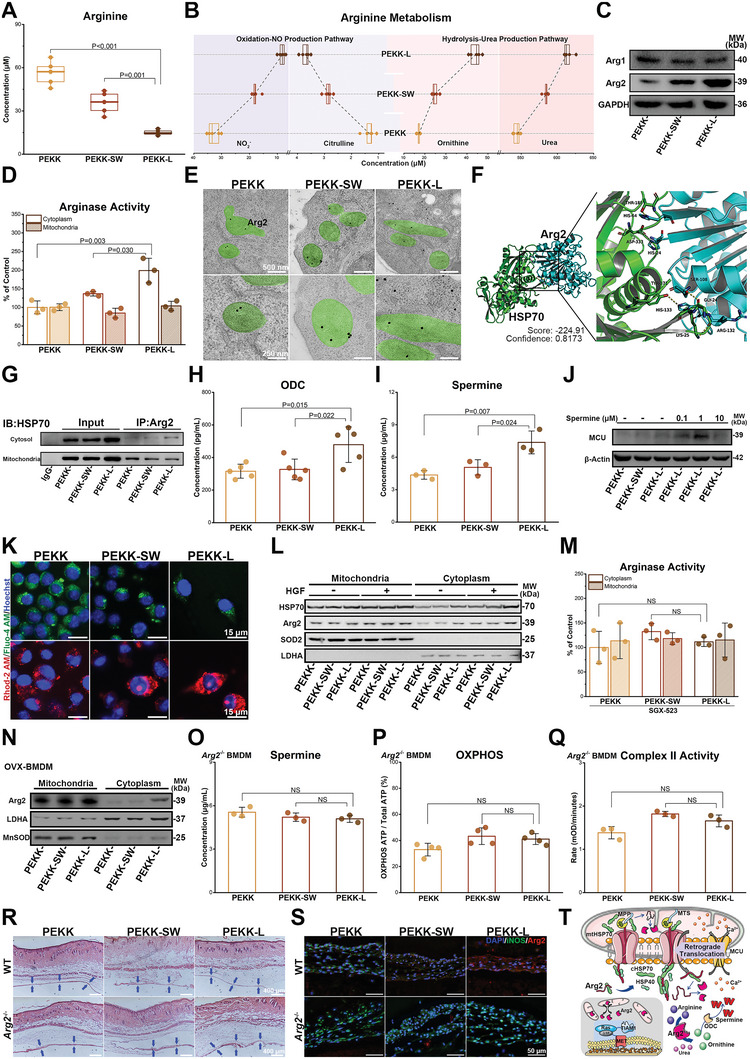
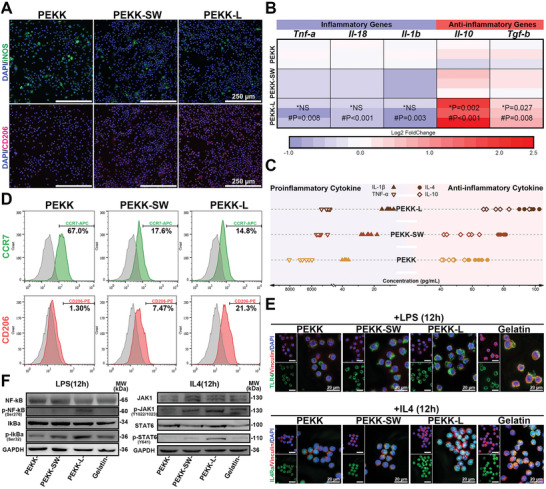
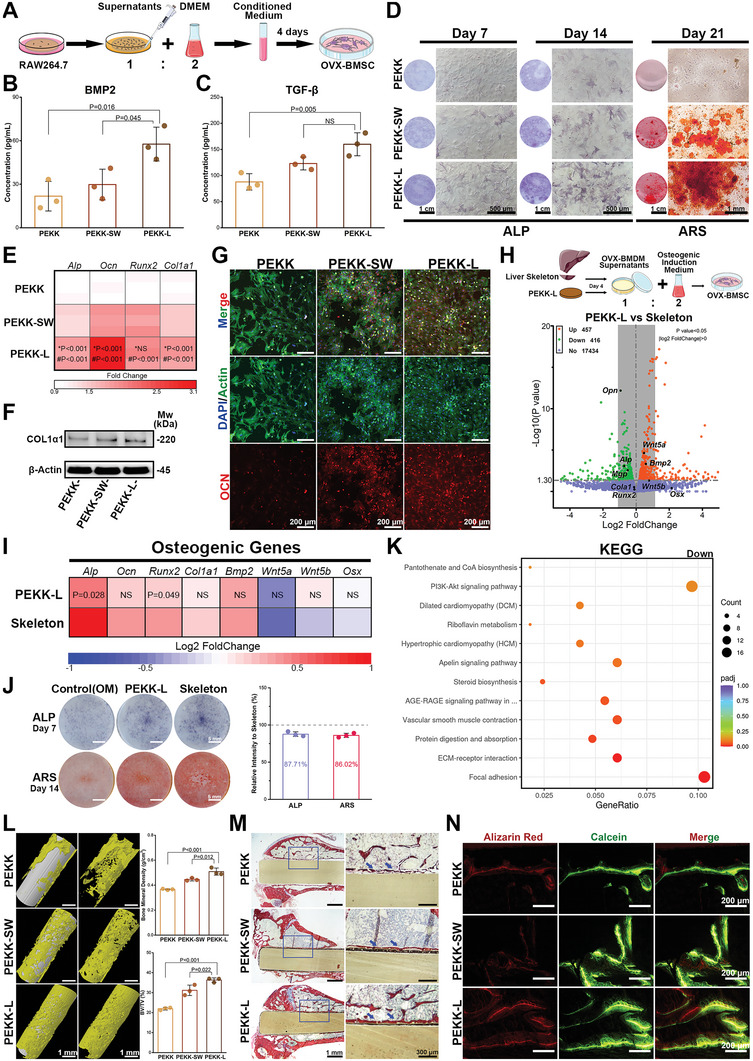
Tissue regeneration is regulated by morphological clues of implants in bone defect repair. Engineered morphology can boost regenerative biocascades that conquer challenges such as material bioinertness and pathological microenvironments. Herein, a correlation between the liver extracellular skeleton morphology and the regenerative signaling, namely hepatocyte growth factor receptor (MET), is found to explain the mystery of rapid liver regeneration. Inspired by this unique structure, a biomimetic morphology is prepared on polyetherketoneketone (PEKK) via femtosecond laser etching and sulfonation. The morphology reproduces MET signaling in macrophages, causing positive immunoregulation and optimized osteogenesis. Moreover, the morphological clue activates an anti-inflammatory reserve (arginase-2) to translocate retrogradely from mitochondria to the cytoplasm due to the difference in spatial binding of heat shock protein 70. This translocation enhances oxidative respiration and complex II activity, reprogramming the metabolism of energy and arginine. The importance of MET signaling and arginase-2 in the anti-inflammatory repair of biomimetic scaffolds is also verified via chemical inhibition and gene knockout. Altogether, this study not only provides a novel biomimetic scaffold for osteoporotic bone defect repair that can simulate regenerative signals, but also reveals the significance and feasibility of strategies to mobilize anti-inflammatory reserves in bone regeneration.

Keywords: arginase-2; biomimetic surface modification; macrophage metabolic reprogramming; osseointegration; polyetherketoneketone.


Conflict of interest statement

The authors declare no conflict of interest.

Figures

Scheme 1
Scheme 1
Schematic diagram showing the biomimetic functionalization design for liver‐inspired PEKK scaffolds and the mechanism of macrophage metabolic reprogramming in osteoporotic bone regeneration via mobilization of anti‐inflammatory reserves.
Figure 1
Figure 1
MET signaling triggered by the liver extracellular skeleton. A) Heat map depicting the expression of genes related to polarization of RAW264.7 cells stimulated by hepatocyte growth factor (HGF) and the MET inhibitor (SGX‐523) (n = 3; *, #, and $ represent HGF vs control, HGF vs HGF+SGX‐523, and HGF+SGX‐523 vs control). B) Scanning electron microscopy (SEM) images capturing surface of the Skeleton sample and the Skeleton‐Flat sample. C) Expression of MET and p‐MET of RAW264.7 cells cultured on the Skeleton sample and the Skeleton‐Flat sample. D) Immunofluorescent staining images of polarization markers of RAW264.7 cells cultured on two liver extracellular skeleton samples treated with HGF antibody or MET antibody for 3 days (iNOS, green; CD206, red; DAPI, blue). E) Expression of MET and p‐MET of RAW264.7 cells cultured on the PEKK scaffold and the titanium scaffold for 3 days. F) Heat map depicting the expression of genes related to polarization of RAW264.7 cells cultured on the PEKK scaffold and the titanium scaffold relative to that of the control group treated with or without SGX‐523 (n = 3; *, ^, #, and $ represent PEKK vs Ti, PEKK+SGX‐523 vs Ti+SGX‐523, PEKK vs PEKK+SGX‐523, and Ti vs Ti+SGX‐523, respectively). The concentrations of G) BMP2 and H) TGF‐β of the microenvironment regulated by RAW264.7 cells cultured on the PEKK scaffold and the titanium scaffold for 4 days (error bars, means ± SD; n = 5). Data were analyzed by ordinary one‐way ANOVA with Tukey's post‐hoc test and respective P values are provided.
Figure 2
Figure 2
Preparation and characterization of biomimetic PEKK scaffolds. A) Schematic illustration of the preparation of PEKK‐L scaffolds. B) Scanning electron microscopy (SEM) images, C) 3D surface optical profiles and D) atomic force microscopy (AFM) images of various PEKK scaffolds and the liver extracellular skeleton. E) Surface roughness of the PEKK scaffolds and the liver extracellular skeleton detected by 3D optical profiles (error bars, means ± SD; n = 4). F) Fourier transform infrared (FT‐IR) spectra of various PEKK scaffolds. G) Elastic modulus of various PEKK scaffolds and the liver extracellular skeleton detected by AFM (error bars, means ± SD; n = 3) with elastic modulus of representative natural bone tissue according to references. Statistical significance was analyzed by ordinary one‐way ANOVA with Tukey's post‐hoc test and respective P values are provided.
Figure 3
Figure 3
Biocompatibility and functional bionics of biomimetic PEKK scaffolds. A) CCK8 results of RAW264.7 cells and OVX‐BMDMs cultured on various scaffolds for 1 and 4 days, respectively (error bars, means ± SD; n = 3). B) Live/Dead fluorescent images of RAW264.7 cells on the scaffolds and the proportion of living cells in upper right corner of images (living cells, green; dead cells and red). C) SEM observations for RAW264.7 cells (pseudocoloured to red) cultured on the scaffolds for 3 days. D) Confocal laser scanning microscope observations for cytoskeleton of OVX‐BMDMs on the scaffolds for 3 days (F‐actin, green; DAPI, blue). E) Ras activity of RAW264.7 cells (n = 3). F) A sankey diagram obtained by RNA sequencing visualizing the differentially expressed genes (DEGs) of RAS signaling pathway with the fold change in the expression of Met and Tiam1 (* and # represent PEKK‐L vs PEKK‐SW and PEKK‐L vs PEKK, respectively). G) Expression of MET, p‐MET, and TIAM1 of RAW264.7 cells cultured on various scaffolds treated with or without HGF for 3 days. Statistical significance was analyzed by ordinary one‐way ANOVA with Tukey's post‐hoc test and respective P values are provided.
Figure 4
Figure 4
Exploration of gene expression and energy metabolism patterns and functional enrichment analysis. A) Volcano plots of DEGs of RAW264.7 cells cultured on various scaffolds for 3 days and the intersecting cluster of upregulated DEGs. B) KEGG pathway enrichment analysis and C) GO pathway enrichment analysis of the intersecting gene cluster. D) Central carbon metabolism analysis visualizing the levels of differentially expressed metabolites related to the TCA cycle and OXPHOS. E) A heat map of combined analysis of RNA sequencing and central carbon metabolism depicting the correlation between the changes in the expression of metabolites and intersecting DEGs with functional enrichment analysis of the related genes and metabolites. n  =  3 biological samples per group. Statistical significance was analyzed by ordinary one‐way ANOVA with Tukey's post‐hoc test and respective P values are provided.
Figure 5
Figure 5
Mitochondrial respiration and mitochondrial dynamic evaluations of macrophages regulated by scaffolds. A) Oxygen consumption rates (OCR) of RAW264.7 cells cultured on scaffolds with addition of Oligomycin (1 µm), FCCP (0.9 µm) and Rotenone + Antimycin A (Rot/Ant A) (0.5 µm) sequentially (error bars, means ± SD; n = 8). B) Basal respiration, ATP production and maximal respiration calculated by OCR curves (error bars, means ± SD). C) The ratio of ADP to ATP (n = 3). D) Mitochondrial morphology of RAW264.7 cells cultured on scaffolds with mitochondrial morphology analysis. E) Heat map depicting the expression of Drp1 and Mfn2 (n = 3; * and # represent PEKK‐L vs PEKK‐SW and PEKK‐L vs PEKK, respectively). F) Mitochondrial membrane potential of RAW264.7 cells. G) Total and OXPHOS ATP (n = 3). Comparison of RAW264.7 cells cultured for 3 days on scaffolds for H) complex I activity (n = 9), I) complex II activity (n = 5) (error bars, means ± SD) and J) fumarate (lower and upper box boundaries, line inside box and lower and upper lines represent 25th and 75th percentiles, median, minimum, and maximum, respectively; n = 5). Comparison of OVX‐BMDMs cultured for 3 days on scaffolds for levels of K) total ATP (n = 3), L) OXPHOS ATP (n = 3), M) complex I activity (n = 6) and N) complex II activity (n = 3; error bars, means ± SD). Data were analyzed by ordinary one‐way ANOVA with Tukey's post‐hoc test and respective P values are provided.
Figure 6
Figure 6
Retrograde translocation of Arg2 in macrophages on PEKK‐L to reprogram arginine metabolism and energy metabolism. RAW264.7 cells were cultured on scaffolds for levels of A) arginine concentration (n = 5) and B) downstream metabolite concentration (n = 5). C) Expression of Arg1 and Arg2. D) Arginase activity in the cytoplasm and mitochondria (n = 3). E) Immunoelectron microscopy of mitochondria (green) and Arg2 (labeled with immune colloidal gold). F) Proposed docking interface between Arg2 (cyan) and HSP70 (green) based on molecular docking. G) Interaction between cytosol HSP70 and immunoprecipitated Arg2. Concentration of H) ornithine decarboxylase (n = 5) and I) spermine (n = 3). J) Expression of MCU treated with or without exogenous spermine. K) Cytoplasmic Ca2+ (green) and mitochondrial Ca2+ (red) in RAW264.7 cells. L) Expression of Arg2 and HSP70 treated with or without HGF. M) Arginase activity in RAW264.7 cells cultured on scaffolds for 3 days treated with SGX‐523 (n = 3). N) Arg2 expression in the cytoplasm and mitochondria of OVX‐BMDMs. Comparison of O) spermine (n = 3), P) OXPHOS (n = 4), and Q) complex II activity (n = 3) in Arg2 −/−‐BMDMs. R) HE and S) immunofluorescent staining of fibrous layer (blue arrows) of dorsal skin in wild type and Arg2 −/− mice after implantation for 3 days (n = 3). T) A schematic diagram showing the putative molecular mechanism. Data were analyzed by ordinary one‐way ANOVA with Tukey's post‐hoc test and respective P values are provided.
Figure 7
Figure 7
Macrophage polarization and immune sensitization regulated by PEKK‐L in vitro. A) Immunofluorescent staining images of polarization markers of RAW264.7 cells cultured on various scaffolds for 4 days (iNOS, green; CD206, red; DAPI, blue). B) A heat map depicting the fold change in the expression of polarization genes relative to that of the PEKK group (* and # represent PEKK‐L vs PEKK‐SW and PEKK‐L vs PEKK, respectively; n = 3). C) The concentration of secreted cytokines of RAW264.7 cells cultured on various scaffolds for 4 days detected by ELISA (n = 6). D) Histogram plots comparing the expression of surface markers (CCR7 and CD206) of RAW264.7 cells by flow cytometry. E) Immunofluorescent staining images of TLR4 or IL4Ra and Vinculin (TLR4 or IL4Ra, green; Vinculin, red; DAPI, blue) and F) the expression of downstream proteins of RAW264.7 cells on various scaffolds and gelatin after stimulation of LPS or IL4 for 12 h. Statistical significance was analyzed by ordinary one‐way ANOVA with Tukey's post‐hoc test and respective P values are provided.
Figure 8
Figure 8
Evaluation of osteogenesis in the microenvironment regulated by various PEKK scaffolds. A) A schematic diagram showing constructed macrophage‐conditioned microenvironment. The concentration of B) BMP2 and C) TGF‐β of in the conditioned medium (n = 3). D) ALP and ARS staining of OVX‐BMSCs cultured with the RAW264.7 cell‐conditioned medium. E) Heat map depicting the expression of osteogenic genes of OVX‐BMSCs cultured for 14 days with the conditioned medium (* and # represent PEKK‐L vs PEKK‐SW and PEKK‐L vs PEKK, respectively; n = 3). Comparison of F) COL1α1 and G) OCN (OCN, red; Actin, green; DAPI, blue) of OVX‐BMSCs cultured for 14 days with the conditioned medium. RNA sequencing analysis was performed on OVX‐BMSCs treated with the OVX‐BMDM conditioned medium (n = 3). H) A volcano plot of DEGs. I) Heat map depicting the expression of osteogenic genes of OVX‐BMSCs cultured for 7 days with the OVX‐BMDM‐conditioned medium (n = 3). J) ALP and ARS staining of OVX‐BMSCs cultured by the OVX‐BMDM‐conditioned medium with the comparison of staining intensity. K) KEGG enrichment analysis of down‐regulated pathways. L) 3D images of micro‐CT after implantation for 8 weeks and quantitative analysis of bone mineral density and bone volume fraction (n = 3). M) Van Gieson staining of undecalcified sections (blue arrows indicate bone implant contact). N) Undecalcified sections of sequential polychrome labels for bone (red, Alizarin red, at week 4; green, Calcein, at week 6). Data were analyzed by ordinary one‐way ANOVA with Tukey's post‐hoc test and respective P values are provided.

Similar articles

Cited by

References

    1. Duda G. N., Geissler S., Checa S., Tsitsilonis S., Petersen A., Schmidt‐Bleek K., Nat. Rev. Rheumatol. 2023, 19, 78. - PubMed
    1. Zhang J., Tong D., Song H., Ruan R., Sun Y., Lin Y., Wang J., Hou L., Dai J., Ding J., Yang H., Adv. Mater. 2022, 34, 2202044. - PubMed
    1. Yuan B., Cheng Q., Zhao R., Zhu X., Yang X., Yang X., Zhang K., Song Y., Zhang X., Biomaterials 2018, 170, 116. - PubMed
    1. Torstrick F. B., Lin A. S. P., Potter D., Safranski D. L., Sulchek T. A., Gall K., Guldberg R. E., Biomaterials 2018, 185, 106. - PubMed
    1. a) Li B., Shu R., Dai W., Yang F., Xu H., Shi X., Li Y., Bai D., Yang W., Deng Y., Small 2022, 18, 2203619; - PubMed
    2. b) Liu W., Li J., Cheng M., Wang Q., Yeung K. W. K., Chu P. K., Zhang X., Adv. Sci. 2018, 5, 1800749; - PMC - PubMed
    3. c) Yuan B., Zhang Y., Zhao R., Lin H., Yang X., Zhu X., Zhang K., Mikos A. G., Zhang X., Sci. Adv. 2022, 8, eabq7116. - PMC - PubMed

Publication types

Substances