. 2023 Jul 3;14(1):3911.
doi: 10.1038/s41467-023-39643-7.

Loss of the batten disease protein CLN3 leads to mis-trafficking of M6PR and defective autophagic-lysosomal reformation

Affiliations

Loss of the batten disease protein CLN3 leads to mis-trafficking of M6PR and defective autophagic-lysosomal reformation

Alessia Calcagni' et al. Nat Commun. .

Abstract

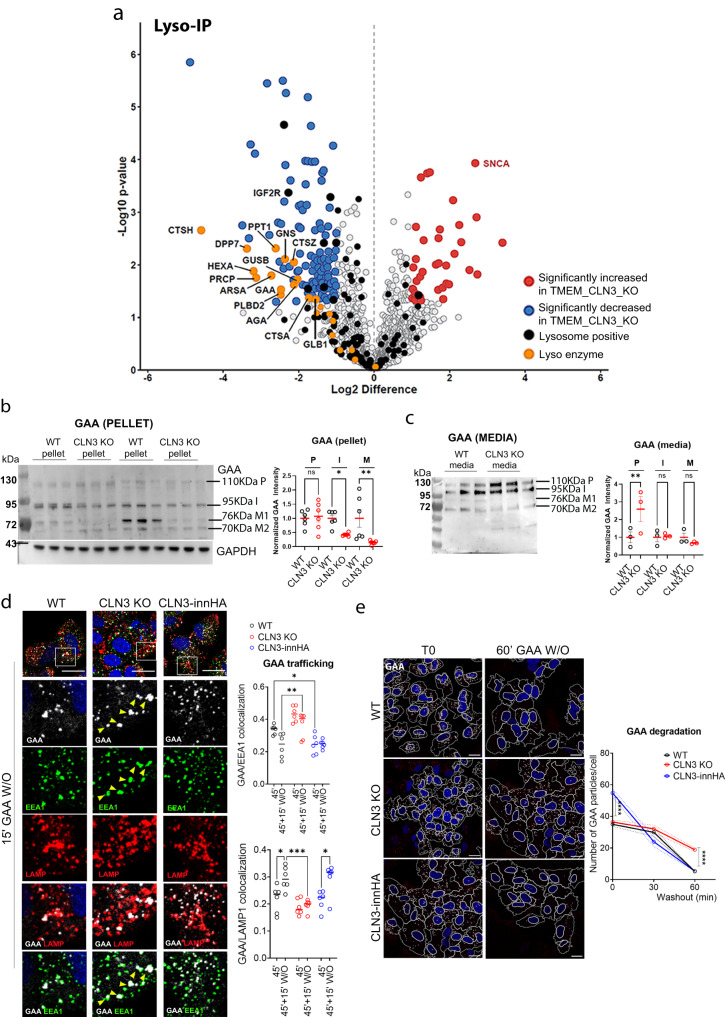
Batten disease, one of the most devastating types of neurodegenerative lysosomal storage disorders, is caused by mutations in CLN3. Here, we show that CLN3 is a vesicular trafficking hub connecting the Golgi and lysosome compartments. Proteomic analysis reveals that CLN3 interacts with several endo-lysosomal trafficking proteins, including the cation-independent mannose 6 phosphate receptor (CI-M6PR), which coordinates the targeting of lysosomal enzymes to lysosomes. CLN3 depletion results in mis-trafficking of CI-M6PR, mis-sorting of lysosomal enzymes, and defective autophagic lysosomal reformation. Conversely, CLN3 overexpression promotes the formation of multiple lysosomal tubules, which are autophagy and CI-M6PR-dependent, generating newly formed proto-lysosomes. Together, our findings reveal that CLN3 functions as a link between the M6P-dependent trafficking of lysosomal enzymes and lysosomal reformation pathway, explaining the global impairment of lysosomal function in Batten disease.


Conflict of interest statement

A.B. is co-founder of CASMA Therapeutics and advisory board member of Next Generation Diagnostics and Avilar and Coave Therapeutics. The remaining authors declare no competing interests.

Figures

Fig. 1
Fig. 1. CLN3 protein localizes to lysosomes and Golgi.
a ARPE19 WT and CLN3-KO cells stained with antibodies against CLN3 (red), TGN46 (blue) and LAMP1 (green), analyzed by confocal microscopy. Scale bar 20 μm. Insets show image enlargements. b Enlargement of WT cells shown in (a), and fluorescent line intensity plot showing CLN3-LAMP1 and CLN3-TGN46 co-localization. White lines show analyzed areas. CLN3-TGN46 and CLN3-LAMP1 Manders’ co-localization coefficients and mean+single values are also shown. N = 45 cells, unpaired t-test (two-tailed), P value 0.4977 (NS). c ARPE19 cells stained with antibodies against CLN3 (red) and TGN46 (green) and imaged with Airyscan super-resolution microscopy. Scale bar 5 μm d CLN3- immunoprecipitates were prepared from WT and CLN3-KO ARPE19 cells and analyzed by immunoblotting for the indicated proteins. Repeated two times. IgH, IgG heavy-chains. e Immunoblot of ARPE19 cells infected with pLVX-CLN3innHA and induced for 0, 4, 6, or 18 h with doxycycline followed by a 12 h doxycycline washout, or collected immediately after induction. Arrows indicate 45 kDa and 65–80 kDa bands. W/O washout, Dox doxycycline, hrs hours. Repeated two times. f Scheme of doxycycline protocol used to study CLN3 protein maturation. Source data are provided as a Source Data file.
Fig. 2
Fig. 2. CLN3 interacts with endo-lysosomal trafficking and recycling complexes.
Interactome analysis in ARPE19-pLVX-CLN3innHA cells induced for 24 h with 1 μg/ml doxycycline, and immunoprecipitated for the HA-tag, showing enriched hits (fold change ≥ 1.5, p value < 0.05) compared to cells not expressing the HA tag. Relevant protein complexes identified with Corum and displayed with Cytoscape, are color-coded and reported in separate enlargements. N = three independent experiments. Data are provided in Supplementary Data 1. P values are calculated using two-tailed unpaired t-tests.
Fig. 3
Fig. 3. CI-M6PR is degraded in CLN3-KO cells.
a ARPE19 WT and CLN3-KO cells were treated with 20 nM bafilomycin for 12 h and analyzed by immunoblotting with the indicated antibodies. Each lane is an independent replicate. The relative quantifications are shown in graph, values are normalized against b-tubulin (Tubb) and WT cells. N = three independent experiments. Unpaired t-test (Tukey’s multiple comparisons test) (*p < 0.05, **p < 0.01, ***p < 0.001). b ARPE19 WT and CLN3-KO cells stained with antibodies against CI-M6PR and TGN46, analyzed by confocal microscopy. Scale bar 20 μm (left), and 5 μm (right, insets). c ARPE19 WT and CLN3-KO cells were treated with 20 nM bafilomycin for 12 h and stained with antibodies against CI-M6PR, TGN46 and LAMP1. Overlapped CI-M6PR-LAMP1 fluorescent line intensity plots are shown. Scale bar 20 μm (left), and 5 μm (right, insets). d ARPE19 WT and CLN3-KO cells were loaded with saturating concentrations (5 ug/ml) of a monoclonal anti-CI-M6PR antibody recognizing the extracellular/luminal domain (lum-CI-M6PR) at 37 °C for 60 min and were analyzed by immunoblot with antibodies against the indicated proteins. To detect lum-CI-M6PR, only the relative secondary antibody was blotted. Each lane is an independent replicate. Relative quantifications are shown in graph, values are normalized against b-tubulin (Tubb) and WT+lum-CI-M6PR condition. N = three independent experiments. One-way Anova (**p < 0.01). e Representative flow cytometry dot plots from ARPE19 WT and CLN3 KO cells, loaded with 5ug/ml of anti-lum-CI-M6PR at 4 °C for 45 min, and stained for PM CI-M6PR, or unstained (lower plot). Selected positive populations and their relative quantification are shown (N = three independent experiments, unpaired t-test (two-tailed), mean ± SEM, **p < 0.01). The gating strategy is provided in Supplementary Fig. 9. Source data are provided as a Source Data file.
Fig. 4
Fig. 4. CLN3 regulates the recycling of CI-M6PR.
a Representative confocal images of ARPE19 cells loaded with 5ug/ml anti-lumCI-M6PR antibody, at 37 °C for 60 min (lumCI-M6PR, red), and co-stained with EEA1 (green) (scale bar 20 μm). Insets show enlargement areas. Graph shows lumCI-M6PR-EEA1 Manders’ colocalization coefficient (N = 16–21 areas, mean + single values, three independent replicates). One-way Anova (Tukey’s multiple comparisons test), (***p < 0.001, ****p < 0.0001). b Representative confocal images of ARPE19 cells loaded with lumCI-M6PR (red), as described in (a), and co-stained with G97 (green) (scale bar 20 μm). Insets show enlargement areas. Quantification shows lumCI-M6PR-G97 Manders’ colocalization coefficient (N = 16–21 areas, mean+single values, three independent replicates) one-way Anova (***p < 0.001, ****p < 0.0001). c Schematic representation of lumCI-M6PR localization upon CLN3-overexpression. d ARPE CLN3innHA cells were transfected with SNX5 + 6, VPS35 or scramble siRNA for 72 h, and the day after induced with 1 μg/ml doxycycline for the remaining 40 h, loaded with 5ug/ml anti-lumCI-M6PR antibody (red), at 37 °C for 45 min, and then chased for 30 min. Cells were co-stained with G97 (green) and analyzed by confocal microscopy (scale bar 20 μm). Manders’ colocalization coefficients are shown. Results are means+single values, N = 18–21 areas, four independent experiments, one-way Anova. Scale bar 10 μm. (**p < 0.01, ****p < 0.0001). Source data are provided as a Source Data file.
Fig. 5
Fig. 5. CLN3 depletion causes mis-sorting of lysosomal enzymes.
a Volcano plots of the lysosomal proteome from ARPE19 WT and CLN3 KO cells. Lysosomal immuno-purification was performed as reported in Supplementary Fig. 2b. Volcano plots highlight proteins significantly depleted (blue dots, fold change ≤−1, p value < 0.05) and enriched (red dots, fold change ≥1, p value > 0.05) compared to WT cells. Cells without HA expression were used as negative control. Lysosomal enzymes are depicted in yellow. N = 4 independent experiments. Data are provided in Supplementary Data 2. P values are calculated using two-tailed unpaired t-tests. b, c Immunoblot analysis of GAA protein maturation in WT and CLN3 KO ARPE19 cells (b, pellet, N = 6 independent replicates; c media N = 3 independent replicates); mean ± SEM, one-way Anova (Fisher’s LSD test), with relative quantifications (*p < 0.05, **p < 0.01). P precursor, I intermediate, M1 mature 1, M2 mature 2. Graphs report the levels of precursor, intermediate, and mature proteins (expressed as sum of M1 + M2), respectively normalized against GAPDH and WT samples. d Representative confocal images of ARPE WT, CLN3 KO and CLN3innHA cells (induced with 1 μg/ml doxycycline for 40 h) loaded for 45 min at 37 °C with 40 µg/ml rhGAA-546 and then chased for 15 min. RhGAA particles are shown in white. Cells were then co-stained for EEA1 (green) and LAMP1 (red) and analyzed by confocal microscopy. Manders’ colocalization coefficients of internalized rhGAA with EEA1 and LAMP1 are shown. Results are means + single values, three independent experiments, 45’ loading N = 14 areas, 45’ + 15’ W/O N = 12 areas, two-way Anova (*p < 0.05, **p < 0.01, ***p < 0.001). Scale bar 20 μm. e Representative confocal images of GAA degradation, in cells treated as described in (a), and chased for 30 and 60 min. Images were generated with the Imaris software, white dots represent rhGAA particles. Graphs are relative to the number of GAA particles per cell, over time (T0 N = 13–14 areas, T30 N = 12–15 areas, T60 = 10–14 areas, mean ± SEM, three independent replicates, two-way Anova, ****p < 0.0001). Scale bar 10 μm. Source data are provided as a Source Data file.
Fig. 6
Fig. 6. CLN3 depletion causes accumulation of enlarged autolysosomes.
a Ultrastructural analysis of lysosomal compartment. LAMP1 immuno-EM (iEM) images of ARPE19 cells showing normal lysosomes in WT cells (arrows, green), and aggregated lysosomes with undigested material in CLN3 KO cells (arrows, pink). Scale bar 500 nm. Relative quantifications are shown in graph. Size of LAMP1 vesicles, N = 33–57 areas, Autolysosomes number/field, N = 26–30 areas. Unpaired t-test (two-tailed) (***p < 0.001, ****p < 0.0001). b Transmission electron microscopy (EM, scale bar 500 nm) and confocal microscopy (Scale bar 20 μm, magnification of the outlined areas are shown at the bottom) images of ARPE19 cells upon block of cell cycle for 1 week, with 1 mM hydroxyurea (HU) treatment. Aggregated lysosomes in KO cells are indicated by arrows. Repeated two times. c ARPE19 WT and CLN3-KO cells were progressively starved (serum + glutamine) for the indicated time point and analyzed by immunoblot with the indicated antibodies. Mean ± SEM, four independent experiments. Quantifications are shown in graph. d pLVX-LAMP1-mCherry cells were induced with doxycycline for 40 h and transfected with LC3-GFP plasmid for 24 h. Cells were then starved for 16 h and analyzed by confocal microscopy. Quantifications shown in graph indicate the number of LC3-GFP spots per cell (top), the percentage of autolysosomes normalized on total lysosomes (middle), and the LC3 + LAMP1 overlapping area (bottom) (N = 9–10 areas, unpaired t-test, two-tailed, *p < 0.05, **p < 0.01). Scale bar 10 μm. e Representative live-image confocal snapshots of CLN3-KO+pLVX-CLN3-innHA with and without 40 h of 1 μg/ml doxycycline induction, in prolonged starvation (16 h) and loaded with 1 µg/µl dextran for 1 h the night prior imaging. Lysosomes (dextran, green) and lysosomal tubules (red). Scale bar 7 μm. Graphs show number of lysosomal tubules, normalized against the total number of lysosomes per field, lysosome number per cell, normalized against the total number of cells, and lysosomes area quantification, each spot is a single lysosome. N = 90–141 cells, three independent experiments, mean + single values are reported, unpaired t-test (two-tailed) (*p < 0.05, **p < 0.01, ****p < 0.0001). Source data are provided as a Source Data file.
Fig. 7
Fig. 7. CLN3 drives lysosomal tubulation and reformation.
a Representative time-lapse images of ARPE19-CLN3innHA + LAMP1-mCherry cells, induced with 1 μg/ml doxycycline for 40 h, and highlighting tubules (asterisks), budding and being released from lysosomes (arrows). Cells were imaged after 16 h of serum+glutamine starvation to induce ALR. Repeated six times. Scale bar 20 μm. b Representative live-image confocal snapshots of ARPE19 WT, CLN3 KO and CLN3-overexpressing cells treated with 1 µg/ml doxycycline for 40 h, loaded with 1 μg/μl Dextran for 1 h the night before imaging, and then treated with PS media for 16 h to label lysosomes (green), with lysosomal tubules marked in red. Images were generated with the Imaris software. Enlargement panels show lysosomes and tubules stained with dextran (green) and lysosotracker (red, 100 nM). Lysotracker was added right before imaging. Scale bar 10 μm. Top graphs depict the number of lysosomal tubules and lysosomes showed in (b). Number of lysosomal tubules (left graph) is normalized against the total number of lysosomes per field (N = 102–134 cells, three independent experiments). Lysosome number per cell (right graph), is normalized against the total number of cells, and quantified in fed (FED) and starvation conditions (8 h and 16 h PS, prolonged starvation) (basal N = 274–375 cells, 8 h PS N = 344–500 cells, 16 h PS N = 225–598 cells). N = 3 independent experiments. Mean ± SEM, two-way Anova (*p < 0.05, **p < 0.01, ***p < 0.001, ****p < 0.0001). Bottom graph shows lysosome area quantification from images shown in (b). Each spot represents a single lysosome, quantified in fed and starvation conditions (N = 102–134 cells, N = 3 independent experiments). Mean + single values are reported, one-way Anova. PS, prolonged starvation (*p < 0.05, **p < 0.01, ***p < 0.001, ****p < 0.0001). c Representative live-image confocal snapshots of ARPE19-CLN3innHA transfected with ATG7 or scramble siRNA for 72 h, induced with doxycycline for 40 h and loaded with 1 μg/μl dextran as described in (b). Scale bar 20 μm. Graphs show number of lysosomal tubules, normalized against the total number of lysosomes per field, lysosome number per cell, normalized against the total number of cells, and lysosomes area quantification, each spot is a single lysosome. N = 197–303 cells, three independent experiments, mean + single values are reported, unpaired t-test (two-tailed) (****p < 0.0001). Source data are provided as a Source Data file.
Fig. 8
Fig. 8. CLN3 modulate ALR by promoting the delivery of lysosomal enzymes.
a Lysosomal immuno-purification analysis of pLVX-CLN3-innHA cells with and without 40 h doxycycline induction (repeated twice). Cells were analyzed by immuno-blot analysis with the indicated antibodies. Quantification is shown in graph. b Left, representative live-image confocal snapshots of ARPE19 CLN3-innHA cells upon prolonged starvation and 40 h doxycycline induction, loaded with 1 μg/μl dextran as described in 7b, and then loaded for 60 min with 40 µg/ml rhGAA-546 before imaging. Lysosomal tubules that are positive to both Dextran and GAA, are reported in pink and are indicated by white arrows. Enlargements areas are reported. Scale bar 7μm. Right, ARPE19 CLN3-innHA cells upon prolonged starvation and 40 h doxycycline induction, loaded with 1 μM PepA (green) and stained for LAMP1 (red). PepA-488 and LAMP1 positive tubules are indicated by white arrows. Repeated two times. Scale bar 20 μm. c Representative live-image confocal snapshots of ARPE19-CLN3innHA transfected with CI-M6PR, SNX5 + 6 or scramble siRNA for 72 h, induced with 1 μg/ml doxycycline for 40 h and loaded with 1 μg/μl dextran as described in 7b. Scale bar 20 μm. Graphs show number of lysosomal tubules, normalized against the total number of lysosomes per field, lysosome number per cell, normalized against the total number of cells, and lysosomes area quantification. N = 5–9 fields per replicate, three independent experiments. For lysosomal tubules quantification and lysosome number per cell, mean + single values (each spot is an averaged measurement of the replicates) are shown. For lysosomes area, each spot is a single lysosome. N = 5–9 fields per replicate, three independent experiments, one-way Anova (Dunnett’s multiple comparisons test) (**p < 0.01, ***p < 0.001, ****p < 0.0001). d A model for the role of CLN3 in the regulation of lysosomal biogenesis and reformation. In the presence of CLN3, lysosomal enzymes are recognized by CI-M6PR, and then they are sorted into lysosomes, resulting in lysosomal biogenesis and reformation. On lysosomes, CLN3 modulates the formation of tubules, which then gives rise to new proto-lysosomes. The absence of CLN3 results in mis-trafficking of the CI-M6PR, that is then degraded inside lysosomes. This leads to mis-sorting of neo-synthesized lysosomal enzymes into the secretion route, causing reduction of multiple lysosomal enzymes within the lysosome and consequent accumulation of undigested material (lipofuscins), impaired mTOR reactivation and failure of ALR. Source data are provided as a Source Data file.

References

    1. Weimer JM, Kriscenski-Perry E, Elshatory Y, Pearce DA. The neuronal ceroid lipofuscinoses: Mutations in different proteins result in similar disease. NeuroMol. Med. 2002;1:111–124. doi: 10.1385/NMM:1:2:111. - DOI - PubMed
    1. Mole SE, Cotman SL. Genetics of the neuronal ceroid lipofuscinoses (Batten disease) Biochim. et. Biophys. Acta—Mol. Basis Dis. 2015;1852:2237–2241. doi: 10.1016/j.bbadis.2015.05.011. - DOI - PMC - PubMed
    1. Bennett, M. J. & Hofmann, S. L. The neuronal ceroid-lipofuscinoses (Batten disease): A new class of lysosomal storage diseases. in Journal of Inherited Metabolic Disease vol. 22 535–544 (J Inherit Metab Dis, 1999). 10.1023/A:1005564509027. - PubMed
    1. Cárcel-Trullols J, Kovács AD, Pearce DA. Cell biology of the NCL proteins: What they do and don’t do. Biochim. et. Biophys. Acta—Mol. Basis Dis. 2015;1852:2242–2255. doi: 10.1016/j.bbadis.2015.04.027. - DOI - PubMed
    1. Cotman SL, Staropoli JF. The juvenile Batten disease protein, CLN3, and its role in regulating anterograde and retrograde post-Golgi trafficking. Clin. Lipidol. 2012;7:79–91. doi: 10.2217/clp.11.70. - DOI - PMC - PubMed

Publication types

MeSH terms