Built structures influence patterns of energy demand and CO2 emissions across countries
- PMID: 37400457
- PMCID: PMC10317978
- DOI: 10.1038/s41467-023-39728-3
Built structures influence patterns of energy demand and CO2 emissions across countries
Abstract
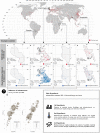
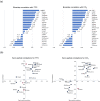
Built structures, i.e. the patterns of settlements and transport infrastructures, are known to influence per-capita energy demand and CO2 emissions at the urban level. At the national level, the role of built structures is seldom considered due to poor data availability. Instead, other potential determinants of energy demand and CO2 emissions, primarily GDP, are more frequently assessed. We present a set of national-level indicators to characterize patterns of built structures. We quantify these indicators for 113 countries and statistically analyze the results along with final energy use and territorial CO2 emissions, as well as factors commonly included in national-level analyses of determinants of energy use and emissions. We find that these indicators are about equally important for predicting energy demand and CO2 emissions as GDP and other conventional factors. The area of built-up land per capita is the most important predictor, second only to the effect of GDP.
© 2023. The Author(s).
Conflict of interest statement
The authors declare no competing interests
Figures


References
-
- IPCC. Climate Change 2021, The Physical Science Basis. (Working Group I contribution to the Sixth Assessment Report of the Intergovernmental Panel on Climate Change, 2021).
-
- IPCC. Global Warming of 1.5 °C. An IPCC special report on the impacts of global warming of 1.5 °C above pre-industrial levels and related global greenhouse gas emission pathways, in the context of strengthening the global response to the threat of climate change, sustainable development, and efforts to eradicate poverty. (WMO, UNEP, 2018).
-
- Dietz T, Shwom RL, Whitley CT. Climate change and society. Annu. Rev. Sociol. 2020;46:135–158. doi: 10.1146/annurev-soc-121919-054614. - DOI
-
- Liddle B. Impact of population, age structure, and urbanization on carbon emissions/energy consumption: evidence from macro-level, cross-country analyses. Popul. Environ. 2014;35:286–304. doi: 10.1007/s11111-013-0198-4. - DOI
LinkOut - more resources
Full Text Sources

