. 2023 Jul 3;9(1):45.
doi: 10.1038/s41522-023-00414-3.

A catalog of bacterial reference genomes from cultivated human oral bacteria

Affiliations

A catalog of bacterial reference genomes from cultivated human oral bacteria

Wenxi Li et al. NPJ Biofilms Microbiomes. .

Abstract

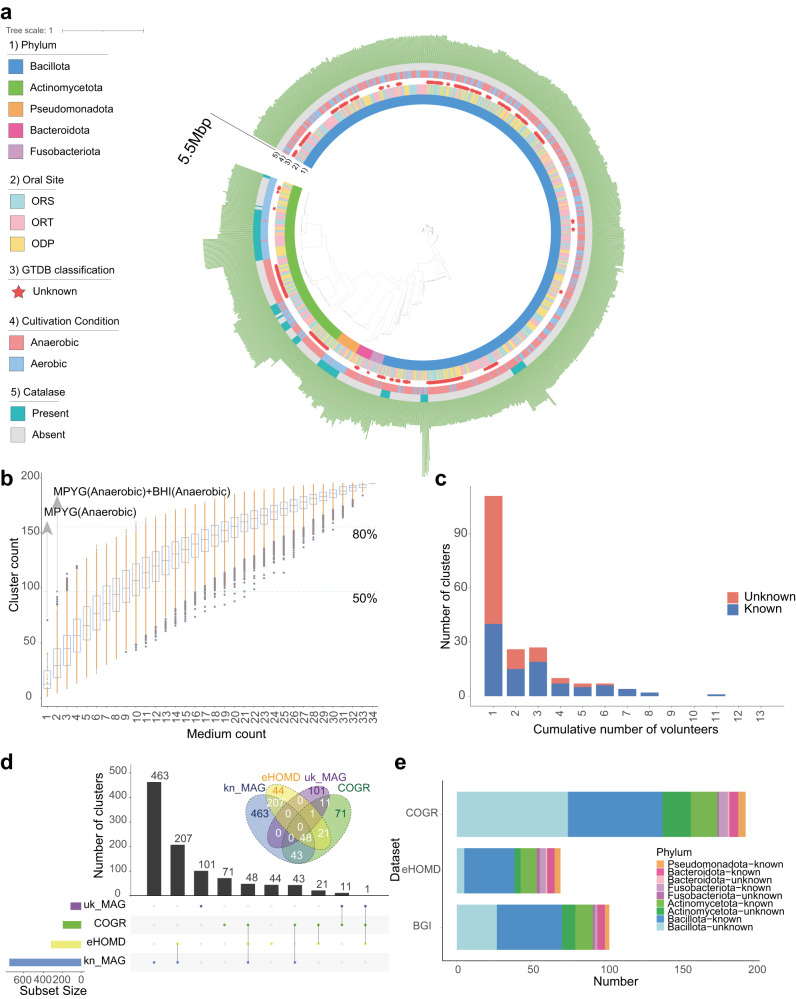
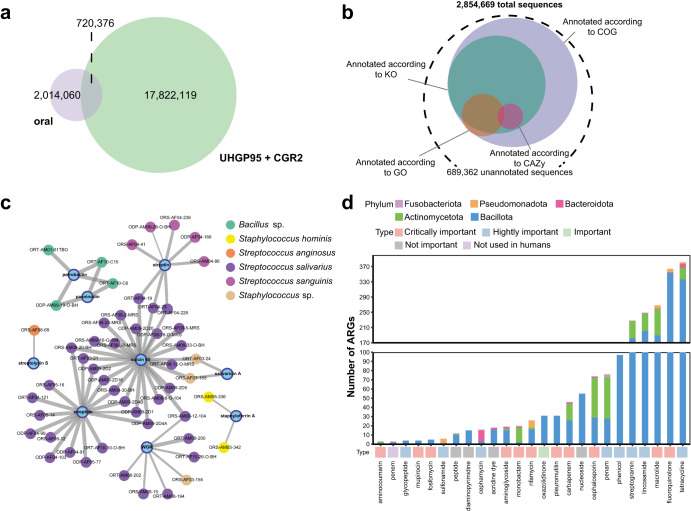
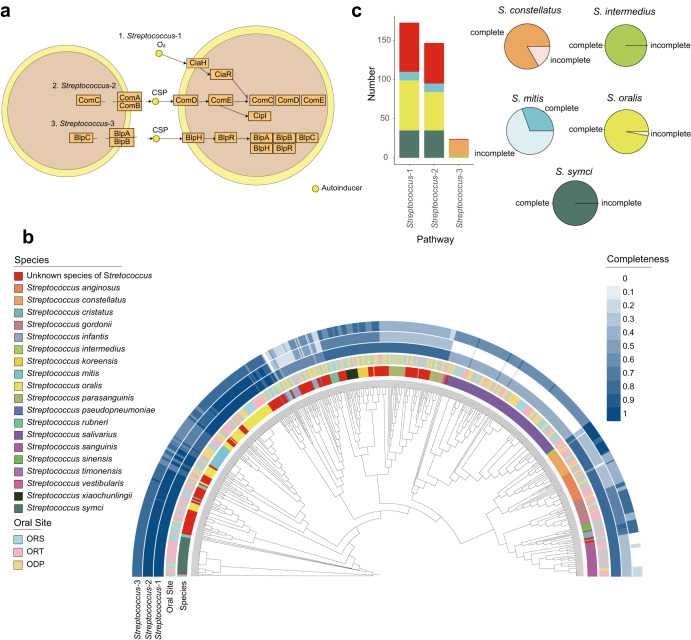
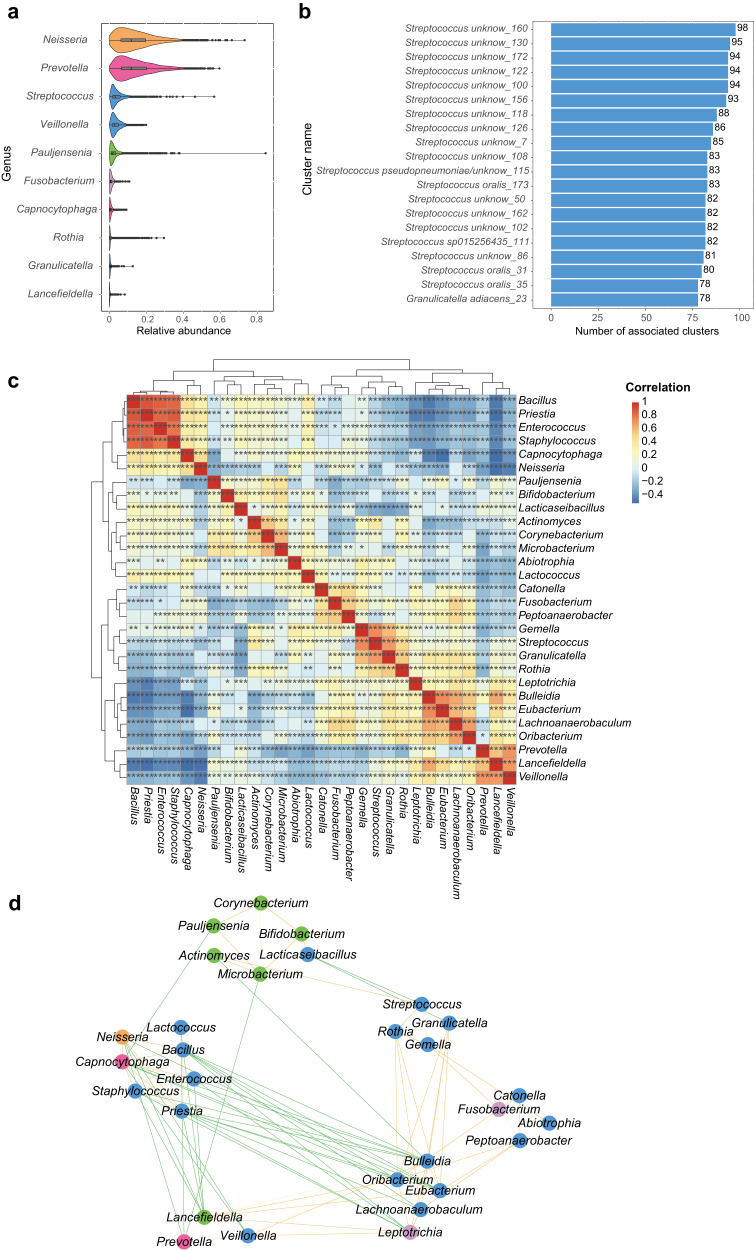
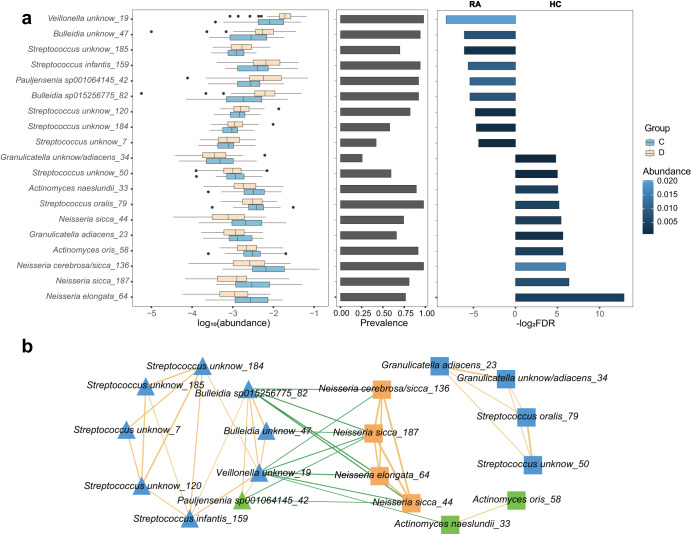
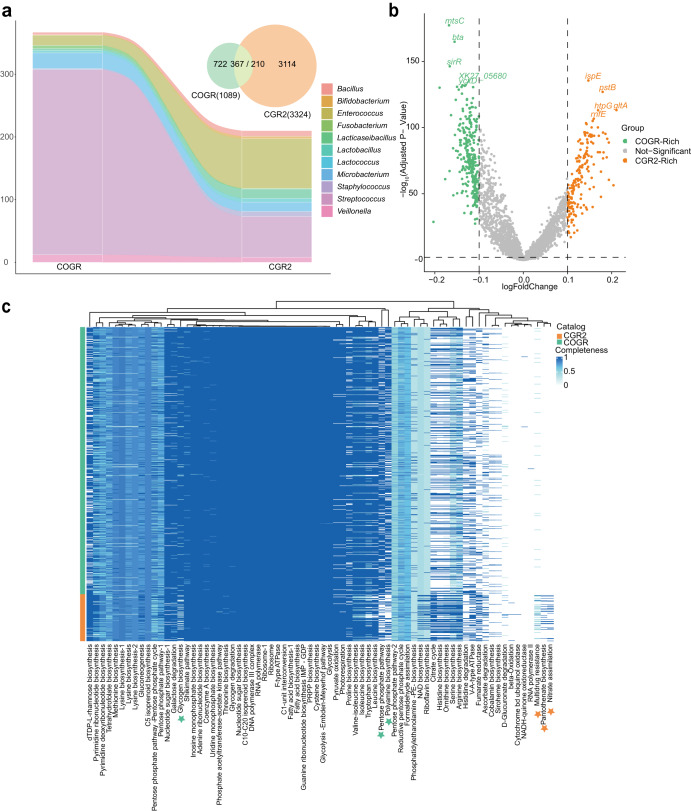
The oral cavity harbors highly diverse communities of microorganisms. However, the number of isolated species and high-quality genomes is limited. Here we present a Cultivated Oral Bacteria Genome Reference (COGR), comprising 1089 high-quality genomes based on large-scale aerobic and anaerobic cultivation of human oral bacteria isolated from dental plaques, tongue, and saliva. COGR covers five phyla and contains 195 species-level clusters of which 95 include 315 genomes representing species with no taxonomic annotation. The oral microbiota differs markedly between individuals, with 111 clusters being person-specific. Genes encoding CAZymes are abundant in the genomes of COGR. Members of the Streptococcus genus make up the largest proportion of COGR and many of these harbor entire pathways for quorum sensing important for biofilm formation. Several clusters containing unknown bacteria are enriched in individuals with rheumatoid arthritis, emphasizing the importance of culture-based isolation for characterizing and exploiting oral bacteria.


Conflict of interest statement

The authors declare no competing interests.

Figures

Fig. 1
Fig. 1. The genome profile of COGR.
a Phylogenetic tree of 1089 COGR genomes based on GTDB annotation. The first circle is colored according to phyla, the second circle is colored according to the origin of the sample, the third circle highlights unknown genomes, the fourth circle is colored according to culture condition, the fifth circle is colored according to presence/absence of catalase, and the outermost circle represents genome length. b Rarefaction curve for the number of clusters obtained from different culture conditions. The MPYG (anaerobic) resulted in the highest count of clusters using one medium, the combination of MPYG (anaerobic) and BHI (anaerobic) resulted in the highest count of clusters using two media. The blue dash line marks the condition that provided 50% and 80% of the clusters of COGR. c The number of clusters shared by different numbers of volunteers. For example, when the cumulative number is 2, the ordinate indicates the number of clusters shared by two volunteers. d The upset plot and the Venn diagram of the comparison of different oral genome datasets. e Number of genomes of COGR mapped to the other two datasets.
Fig. 2
Fig. 2. Functional profile of COGR.
a Venn diagram of unique and shared protein sequences between oral and gut catalogs. b Annotation of 2,854,669 protein sequences according to COG, KO, GO and CAZy databases. c Sequence similarity network of our identified BGCs with known BGCs (similarity >70%,). The nodes in blue represent the known BGCs in the MiBIG database, and the remaining nodes represent identified BGCs in COGR, annotated with the genome name and colored by their species. The width of edges reflects degree of similarity. d Number of annotated ARGs and their distribution. The bottom square is colored according to the importance of drug usage.
Fig. 3
Fig. 3. Quorum sensing in Streptococcus.
a Schematic overview of quorum sensing pathways in Streptococcus (KEGG map02024 (https://www.genome.jp/pathway/map02024)). Genes are represented as orange boxes and the small yellow circles represent autoinducers. Two cells are depicted. b Phylogenetic tree of Streptococcus strains in COGR. The innermost circle is colored according to species and the second circle is colored by according to the oral sampling site. The outer three circles are colored according to the completeness of three quorum sensing pathways in Streptococcus. c The bar plot on the left shows the number of species harboring the complete quorum sensing pathway. The pie chart on the right shows the proportion of complete and incomplete coverage of the quorum sensing pathway in the indicated species of COGR. The color code in (c) is the same as that used in (b).
Fig. 4
Fig. 4. Mapping of 195 representative strain genomes of each cluster from COGR to 4362 oral metagenomes.
a Genera with relative abundance ranking in top 10 in 4362 metagenomes, colored by phylum. b The top 20 clusters with the highest number of associations to other clusters in COGR in a co-occurrence analysis between the 195 clusters. The clusters are named as “GTDB species_cluster number.” c Co-occurrence heatmap of 29 genera based on the relative abundances in the metagenomes. Red color represents positive relationships while blue represents negative relationships. The stars marked in the boxes represent significance. d Network of 29 genera based on the correlation analysis (r > 0.3). The nodes are colored by phylum. Positive correlations are shown by orange lines and negative correlations by green lines. The width of the lines reflects the strength of the correlation. The phyla color codes are as in Fig. 1.
Fig. 5
Fig. 5. Differential patterns of clusters of oral microbes in 47 healthy controls (HC) and 50 patients with rheumatoid arthritis (RA).
a The logarithm of abundance (base 10) in each group and the prevalence of differential clusters. The percentage of samples with abundance of clusters higher than 0.1% was considered as the prevalence. The logarithm of FDR (base 2) between RA and HC is presented, colored according to the average abundance in corresponding group. b Correlation network of clusters differing in abundance between HC and RA, with nodes colored according to phylum. Square nodes are clusters enriched in HC, while triangle nodes are clusters enriched in RA. Positive correlations are indicated by orange lines and negative correlations by green lines. The width of the lines indicates strength of the correlation.
Fig. 6
Fig. 6. Comparison between CGR2 and COGR.
a Genome-wide comparison of COGR (oral) and CGR2 (gut). The number of matched genomes is shown at the genus level using a Sankey diagram. 367 genomes of COGR match 210 genomes of CGR2. b Differential proteins encoded by COGR and CGR2. The top 5 -log10 (Adjusted p-value) proteins are marked. c KEGG module completeness heatmap of Streptococcus. The modules exhibiting significant differences in COGR or CGR2 are highlighted by stars in green or orange.

References

    1. Zou Y, et al. 1520 reference genomes from cultivated human gut bacteria enable functional microbiome analyses. Nat. Biotechnol. 2019;37:179–185. doi: 10.1038/s41587-018-0008-8. - DOI - PMC - PubMed
    1. Frank DN, et al. Molecular-phylogenetic characterization of microbial community imbalances in human inflammatory bowel diseases. Proc. Natl Acad. Sci. USA. 2007;104:13780–13785. doi: 10.1073/pnas.0706625104. - DOI - PMC - PubMed
    1. Qin J, et al. A metagenome-wide association study of gut microbiota in type 2 diabetes. Nature. 2012;490:55–60. doi: 10.1038/nature11450. - DOI - PubMed
    1. Thomas AM, et al. Metagenomic analysis of colorectal cancer datasets identifies cross-cohort microbial diagnostic signatures and a link with choline degradation. Nat. Med. 2019;25:667–678. doi: 10.1038/s41591-019-0405-7. - DOI - PMC - PubMed
    1. Wirbel J, et al. Meta-analysis of fecal metagenomes reveals global microbial signatures that are specific for colorectal cancer. Nat. Med. 2019;25:679–689. doi: 10.1038/s41591-019-0406-6. - DOI - PMC - PubMed

Publication types