. 2023 Aug;25(8):1157-1172.
doi: 10.1038/s41556-023-01180-2. Epub 2023 Jul 3.

Arf1 coordinates fatty acid metabolism and mitochondrial homeostasis

Affiliations

Arf1 coordinates fatty acid metabolism and mitochondrial homeostasis

Ludovic Enkler et al. Nat Cell Biol. 2023 Aug.

Abstract

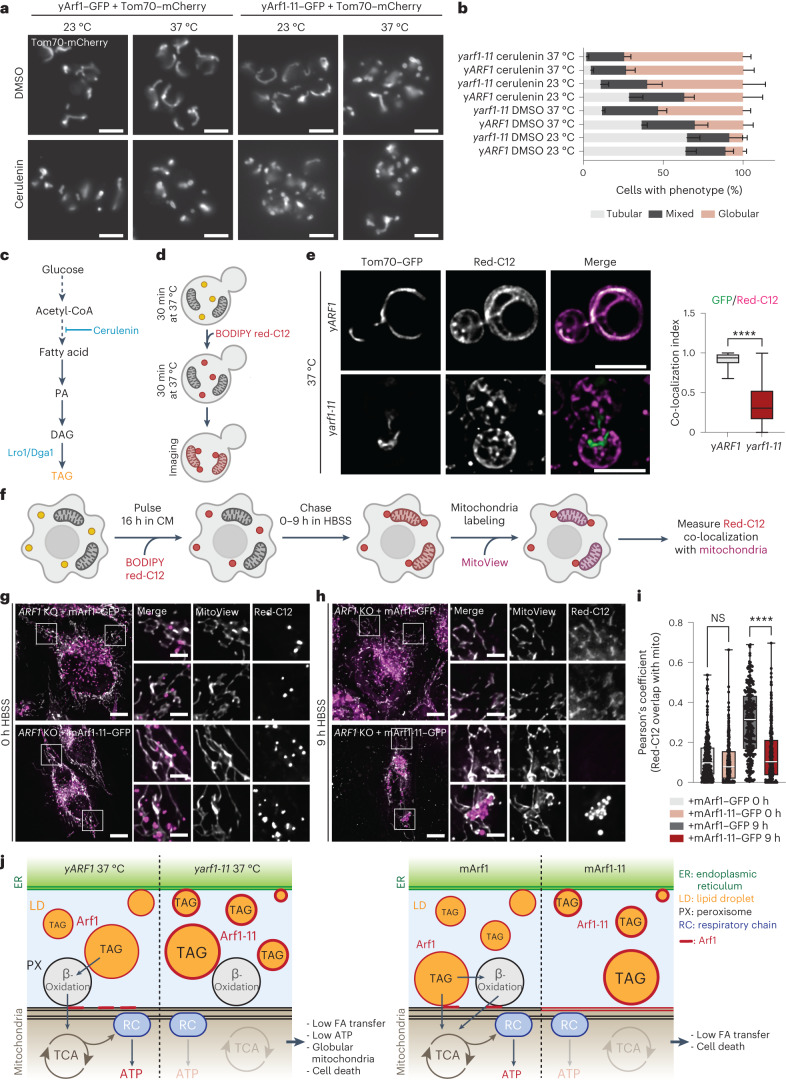
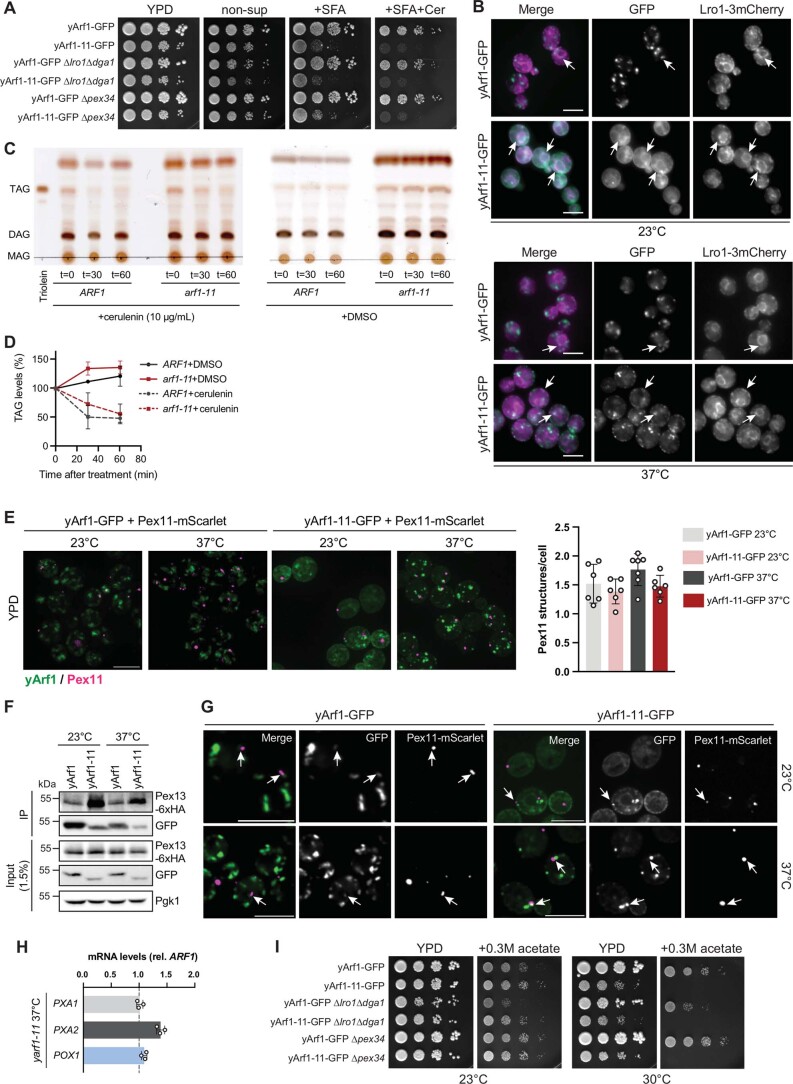
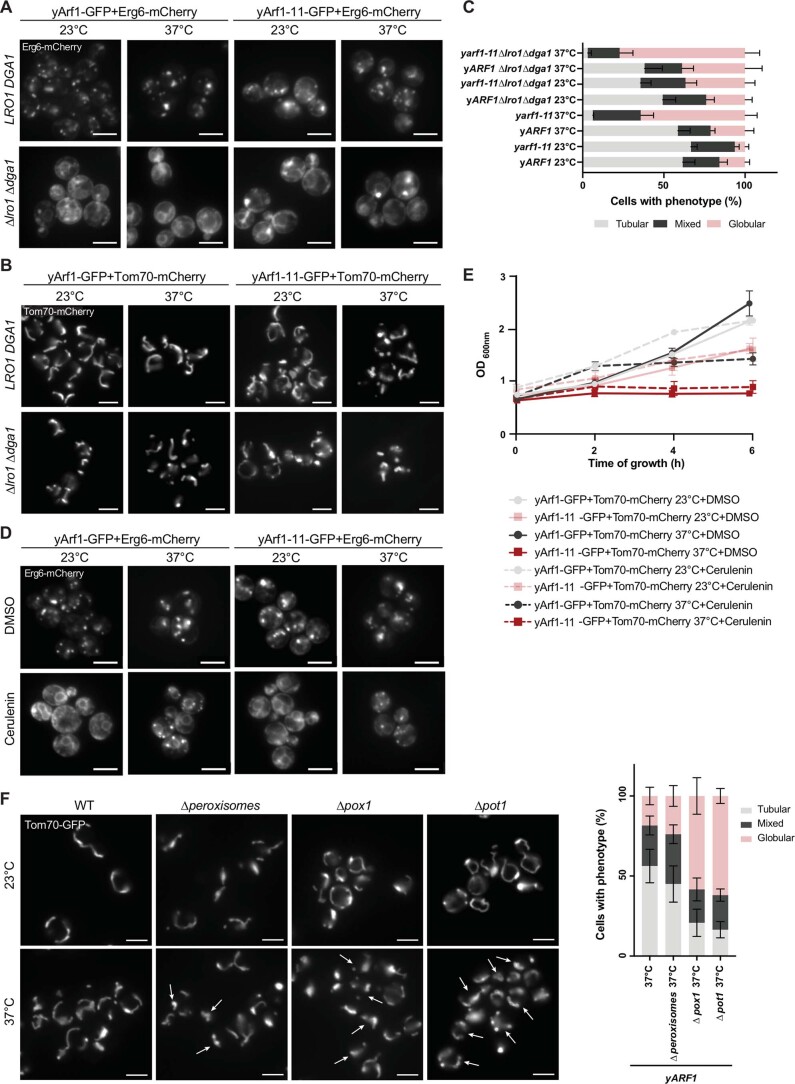
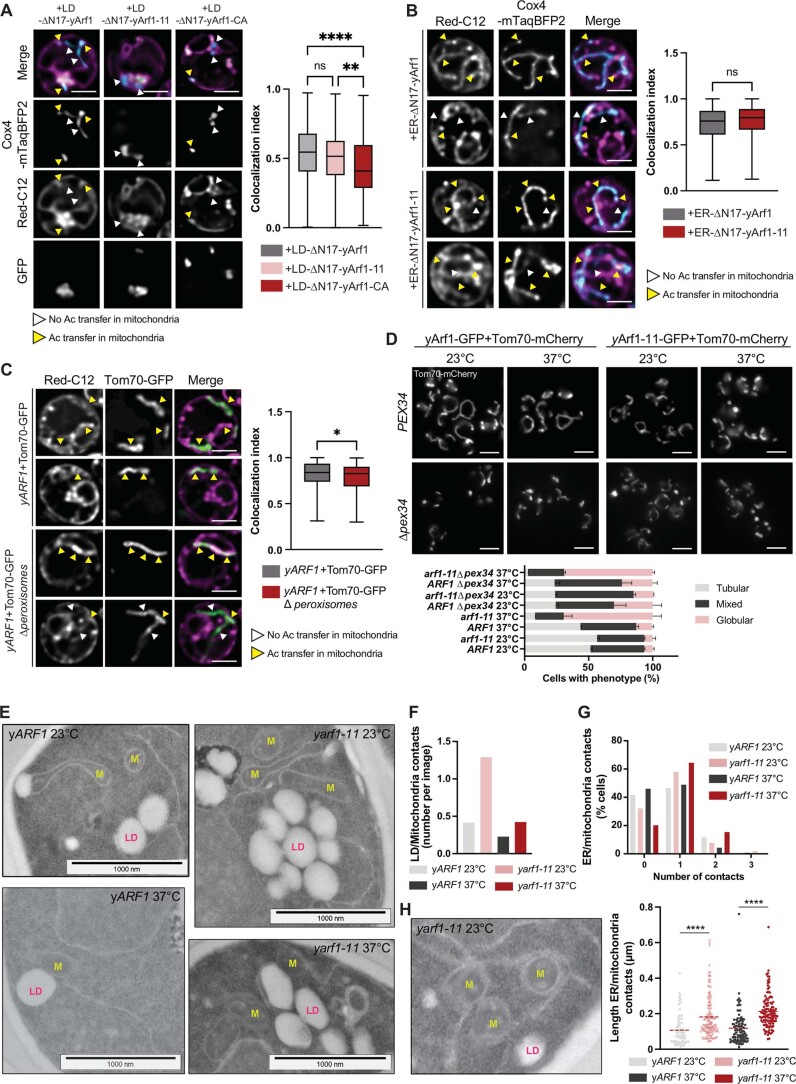
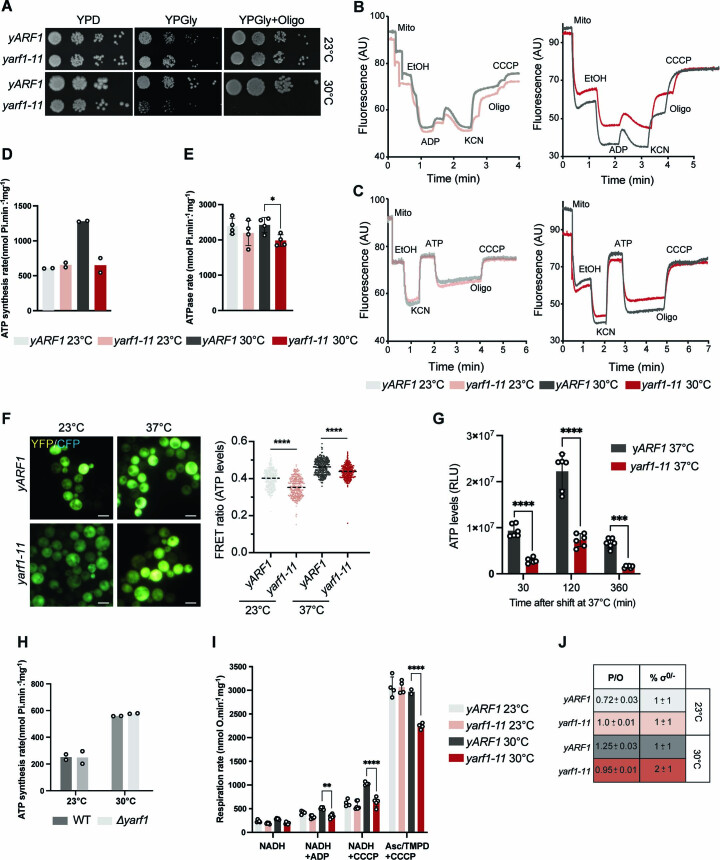
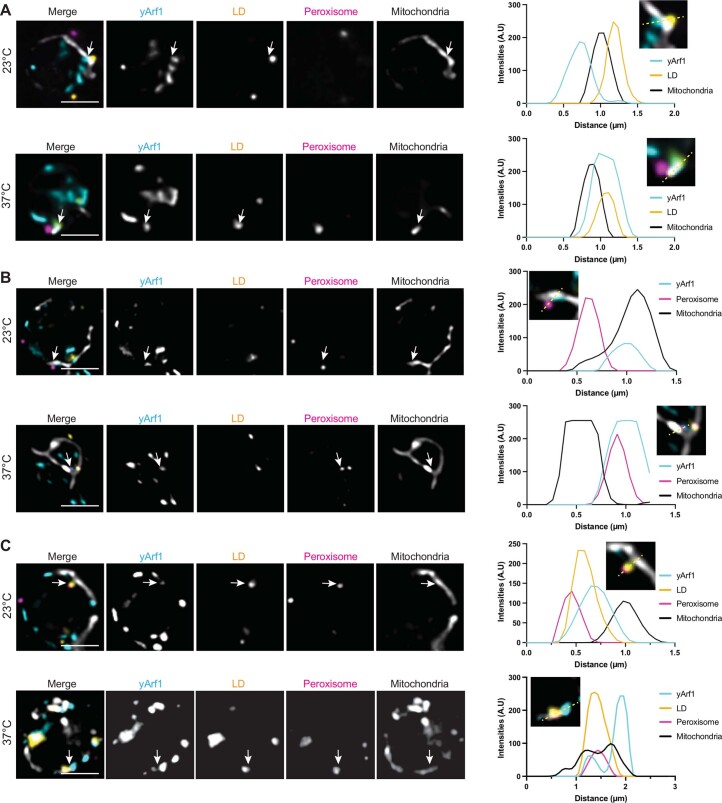
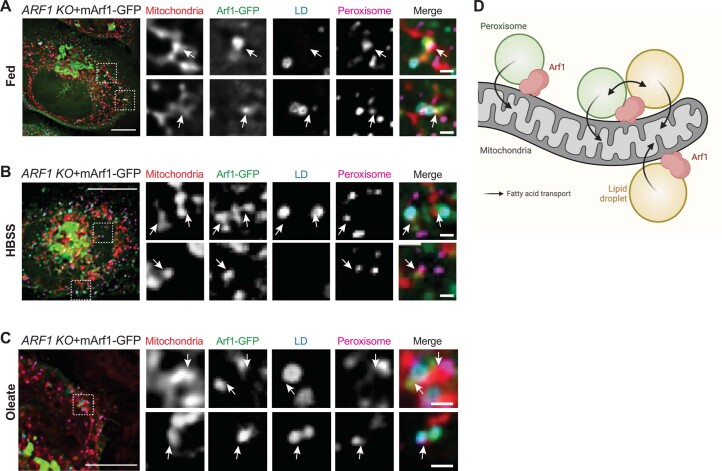
Lipid mobilization through fatty acid β-oxidation is a central process essential for energy production during nutrient shortage. In yeast, this catabolic process starts in the peroxisome from where β-oxidation products enter mitochondria and fuel the tricarboxylic acid cycle. Little is known about the physical and metabolic cooperation between these organelles. Here we found that expression of fatty acid transporters and of the rate-limiting enzyme involved in β-oxidation is decreased in cells expressing a hyperactive mutant of the small GTPase Arf1, leading to an accumulation of fatty acids in lipid droplets. Consequently, mitochondria became fragmented and ATP synthesis decreased. Genetic and pharmacological depletion of fatty acids phenocopied the arf1 mutant mitochondrial phenotype. Although β-oxidation occurs in both mitochondria and peroxisomes in mammals, Arf1's role in fatty acid metabolism is conserved. Together, our results indicate that Arf1 integrates metabolism into energy production by regulating fatty acid storage and utilization, and presumably organelle contact sites.


Conflict of interest statement

The authors declare no competing interests.

Figures

Fig. 1
Fig. 1. yArf1 regulates mitochondria fusion and fission.
a, Schematic of the thermo-sensitive mutant Arf1-11 in yeast (Yahara et al.). Amino acid coordinates are indicated in bold below the protein and corresponding mutated amino acids in red. b, Growth test of yARF1 and yarf1-11 strains on rich medium (YPD) and incubated at 23 °C, 30 °C and 37 °C. c, Cell viability assay of yARF1 and yarf1-11 strains performed after shifting cells to 37 °C. ODs were measured at regular timepoints. Mean and standard deviation are shown; n = 3 biological replicates. d, yARF1 and yarf1-11 strains phenotypes followed by microscopy after 0, 30, 60 and 120 min incubation time at 37 °C. Scale bar, 5 µm. eh, Single timepoint images of movies done with strains expressing yArf1–GFP (e,g) or yArf1-11–GFP (f,h) together with the mitochondrial protein Tom70 fused to mCherry at 23 °C (e,f) or shifted to 37 °C (g,h). White arrows indicate sites of fission and yellow arrows fusion. Asterisk indicates a fusion event independent of Arf1 in h. Scale bar, 5 µm. Scale bar inlays, 2.5 µm. i,j, Measurements of mitochondrial fusion and fission events per cell (i) and the frequency of events where yArf1 is involved (j). Mean and standard deviation are shown; yARF1 23 °C = 271 cells, yARF1 37 °C = 231 cells, yarf1-11 23 °C = 379 cells and yarf1-11 37 °C = 186 cells from n = 3 biological replicates. Source numerical data are available in source data. See also Extended Data Fig. 1. Source data
Fig. 2
Fig. 2. Control of Arf1 activity is needed for mitochondria dynamics.
a, Schematic of the construct designed to anchor yArf1 on mitochondria (MT) via Tom20. yARF1 deleted in its myristoylation sequence (∆N17) was expressed from its endogenous promoter and fused to GFP on its 3′ end. Localization of MT-anchored ∆N17-yArf1–GFP, the dominant negative yArf1-DN or yArf1 bearing yArf1-11–GFP variant in yARF1 cells grown at 23 °C or shifted to 37 °C. Scale bar, 5 µm. b, High-resolution co-localization of MT-anchored ∆N17-yArf1–GFP, yArf1-DN and Arf1-11–GFP with mitochondria stained with MitoTracker Deep Red FM. A single focal plane of 0.2 µm is shown. Scale bar, 2 µm. c, Measurements of mitochondria phenotypes (tubular, mixed or globular) based on images taken in a. Mean and standard deviation are shown; ∆yarf1 + MT-Arf1 23 °C = 419 cells, ∆yarf1 + MT-Arf1-11 23 °C = 544 cells, ∆yarf1 + MT-Arf1-DN 23 °C = 606 cells, ∆yarf1 + MT-Arf1 37 °C = 509 cells, ∆yarf1 + MT-Arf1-11 37 °C = 453 cells, ∆yarf1 + MT-Arf1-DN 37 °C = 462 cells from n = 3 biological replicates. d, Mitochondria morphology were imaged in WT and ∆yarf1 strains grown at 23 °C or shifted to 37 °C using Tom70–mCherry as mitochondrial marker. Mitochondria phenotypes (tubular, mixed or globular) were measured. Mean and standard deviation are shown; WT 23 °C = 355 cells, WT 37 °C = 582 cells, ∆yarf1 23 °C = 419 cells, ∆yarf1-11 23 °C = 571 cells from n = 3 biological replicates. Scale bar, 5 µm. e, Mitochondrial fusion and fission events were measured on the basis of Supplementary Videos 5–8. Mean and standard deviation are shown; WT 23 °C = 320 cells, WT 37 °C = 279 cells, ∆yarf1 23 °C = 319 cells, ∆yarf1-11 37 °C = 321 cells from n = 3 biological replicates. f, Mitochondria morphology were imaged in WT cells expressing yArf1–GFP or yArf1-11–GFP grown at 23 °C or shifted to 37 °C using Tom70–mCherry as mitochondrial marker. For each strain the tubular, mixed and globular phenotypes were measured. Mean and standard deviation are shown. Scale bar, 5 µm. +yArf1 23 °C = 251 cells, +yArf1 37 °C = 273 cells, +yArf1-11 23 °C = 266 cells, +yArf1-11 37 °C = 273 cells from n = 3 biological replicates. g, Mitochondria morphology were imaged in WT cells expressing yArf1-, the constitutively active mutant yArf1-CA- or the dominant negative yArf1-DN–GFP grown at 23 °C or shifted to 37 °C using Tom70–mCherry as mitochondrial marker. For each strain the tubular, mixed and globular phenotypes were measured. Mean and standard deviation are shown. +yArf1 23 °C = 269 cells, +yArf1 37 °C = 275 cells, +yArf1-CA 23 °C = 268 cells, +yArf1-CA 37 °C = 287 cells, +yArf1-DN 23 °C = 243 cells, +yArf1-DN 37 °C = 411 cells from n = 3 biological replicates. Scale bar, 5 µm. Source numerical data are available in source data. Source data
Fig. 3
Fig. 3. yArf1-11 is a hyperactive mutant present on the ER and LDs.
a,b, Active yArf1 pull-down and detection experiments done with strains expressing yArf1 and yArf1-11 fused to GFP (a) or endogenous untagged yArf1 and yArf1-11 (b). Protein extracts from soluble (S100) or pellet (P100) fractions from yARF1 and yarf1-11 cells grown at 23 °C or shifted to 37 °C were incubated with equal amount of purified GST-tagged GAT domain of Gga2 (Gga2GAT). Sec61 and Anp1 were used as membrane marker and Pgk1 as cytosolic marker. s.e., short exposure; l.e., long exposure; PD, pull-down. c, Localization of WT yArf1 and yArf1-11 C-terminally fused to GFP. Cells were incubated either at 23 °C or shifted at 37 °C for 30 min. Mean and standard deviation are shown. Scale bar 5 µm. d, Co-localization of yArf1–GFP and yArf1-11–GFP with the ER marker Sec61 tagged with mCherry grown at 23 °C and 37 °C. Cells highlighted by dotted squares depict GFP and mCherry co-localization. Fluorescence intensities of each channel were measured on a circle drawn around the perinuclear ER and are shown here as arbitrary units (a.u.). Scale bar, 5 µm. eh, TEM of yARF1 (e,f) and yarf1-11 (g,h) strains grown either at 23 °C (e,g) or shifted at 37 °C (f,h) for 30 min. yArf1 and yArf1-11 localizations were detected by immunogold labeling, and dotted squares show enlargements of specific Arf1 localizations. Scale bar, 500 nm. Scale bar magnification, 200 nm. i, Co-localization of yArf1–GFP and yArf1-11–GFP with the LD marker Erg6 tagged with mCherry grown at 23 °C or shifted to 37 °C for 30 min. Arrows indicate sites of co-localization between the yArf1/yArf1-11 and LD. Scale bar, 5 µm. Unprocessed blots are available in source data. See also Extended Data Fig. 2. Source data
Fig. 4
Fig. 4. LD-localized yArf1 induces mitochondria fragmentation.
a, Localization of yArf1, constitutively active (CA) or dominant negative (DN) forms of yArf1 fused to GFP grown at 23 °C or shifted to 37 °C for 30 min. Constructs were expressed from the centromeric low copy number plasmid pGFP33. Scale bar, 5 µm. b, Localization of yArf1, or yArf1 bearing single (K38T, L173S), double (K38T–E132D) or triple (K38T–E132D–L173S) substitution yarf1-11 mutations fused to GFP in Saccharomyces cerevisiae (YPH500) grown at 23 °C or shifted to 37 °C for 30 min. Constructs were expressed from the centromeric low-copy-number plasmid pGFP33. Scale bar, 5 µm. c, Growth assay of the WT strain bearing the empty pGFP3 vector (+EV), single (K38T, L173S), double (K38T–E132D) or triple (K38T–E132D–L173S) yarf1-11 mutations fused to GFP on rich YPD plates incubated at 23 °C, 30 °C or 37 °C. d, Schematic of the construct designed to anchor yArf1 on the LD via the PAT domain of the perilipin PLN1. yARF1 deleted in its myristoylation sequence (∆N17) was expressed from its endogenous promoter and fused to GFP on its 3′ end. Localization of LD-anchored ∆N17-yArf1–GFP, the constitutively active mutant yArf1-CA, or yArf1 bearing yArf1-11–GFP variant in cells depleted of ARF1 grown at 23 °C and shifted to 37 °C. Tom70–mCherry was used as a mitochondrial marker. Mitochondria phenotypes (tubular, mixed or globular) were measured. Mean and standard deviation are shown. At 23 °C, ∆yarf1 = 406 cells, ∆yarf1 + LD-Arf1 = 477 cells, ∆yarf1 + LD-Arf1-11 = 483 cells, ∆yarf1 + LD-Arf1-CA = 403 cells; At 37 °C, ∆yarf1 = 443 cells, ∆yarf1 + LD-Arf1 = 480 cells, ∆yarf1 + LD-Arf1-11 = 523 cells, ∆yarf1 + LD-Arf1-CA = 529 cells from n = 3 biological replicates. Scale bar, 5 µm. e, Schematic of the construct designed to anchor yArf1 on the ER via Sec66. yARF1 deleted in its myristoylation sequence (∆N17) was expressed from its endogenous promoter and fused to GFP on its 3′ end. Localization of ER-anchored ∆N17-yArf1–GFP or yArf1 bearing yArf1-11–GFP variant in ∆yarf1 cells grown at 23 °C and shifted to 37 °C. Scale bar, 5 µm. f, Growth assay of the ER-anchored ∆N17-yArf1–GFP or Arf1 strains bearing yarf1-11 mutations (Arf1K38T–E132D–L173S) on rich YPD plates or synthetic medium lacking uracil (HC-Ura) incubated at 23 °C, 30 °C or 37 °C, and of the ER-anchored ∆N17-yArf1–GFP or yArf1 bearing yarf1-11 mutations (Arf1K38T–E132D–L173S) in YPH500 cells lacking yARF1 (∆yarf1) on rich YPD plates or synthetic media lacking uracil (HC -Ura) incubated at 23 °C, 30 °C or 37 °C. g, Cells expressing yArf1/11 fused to GFP, or expressing ER-∆N17-yArf1/11–GFP were grown at 37 °C for 30 min and mitochondria were imaged with Tom70–mCherry by high-resolution microscopy followed by deconvolution. A z-projection of maximum intensities is shown for each panel. Scale bar, 2 µm. h,i, Measurements of mitochondria phenotypes (tubular, mixed or globular) based on images taken in g (h), and mitochondrial fusion and fission events based on Supplementary Videos 9–12 (i). Mean and standard deviation are shown. ∆yarf1 + yArf1–GFP = 364 cells, ∆yarf1 + yArf1-11–GFP = 800 cells, ∆yarf1 + ER-yArf1–GFP = 608 cells, ∆yarf1 + ER-yArf1-11–GFP = 542 cells from n = 3 biological replicates (h); at 23 °C ∆yarf1 + ER-yArf1–GFP = 210 cells, ∆yarf1 + ER-yArf1-11–GFP = 208 cells and at 37 °C ∆yarf1 + ER-yArf1–GFP = 195 cells, ∆yarf1 + ER-yArf1-11–GFP = 190 cells from n = 3 biological replicates (i). Source numerical data are available in source data. Source data
Fig. 5
Fig. 5. Functional conservation of Arf1-11 in mammalian cells.
a,b, Mammalian Arf1 (mArf1; a) or mArf1-11 (b) fused to GFP were expressed in CRISPR/Cas9-mediated ARF1 knockout HeLa cells (ARF1 KO). Co-localization with the Golgi was done by immunostaining against the marker GM130. Squares show magnification of a perinuclear and distal portion of the cell. Scale bars, 10 µm and 5 µm (inlays). c,d, Co-localization of mArf1–GFP (c) and mArf1-11–GFP (d) expressed in the ARF1 KO cell line with the ER was determined by immunostaining against the marker CLIMP63. Squares show magnification of a perinuclear and distal portion of the cell. Scale bars, 10 µm and 5 µm (inlays). e,f, Co-localization of mArf1–GFP (e) and mArf1-11–GFP (f) expressed in the ARF1 KO cell line with mitochondria was determined by immunostaining against the translocase of mitochondrial outer membrane TOM20. Squares show magnification of a perinuclear and distal portion of the cell. Scale bars, 10 µm and 5 µm (inlays). g,h, Co-localization of mArf1–GFP (g) and mArf1-11–GFP (h) expressed in the ARF1 KO cell line with LDs was determined by incubation with the fluorescent fatty-acid BODIPY Red-C12. Scale bars, 10 µm and 5 µm (inlays). Squares show magnification of distal portion of the cell. All images were acquired 24 h after transfection. See also Extended Data Fig. 3.
Fig. 6
Fig. 6. Hyperactive Arf1 induces TAG accumulation.
a, TEM of yARF1 and yarf1-11 strains grown at 37 °C for 30 min. Scale bars, 2,000 nm. b, LipidTox staining of LDs in yARF1 and yarf1-11 strains grown at 23 °C or shifted to 37 °C. Scale bar, 5 µm. Mean and standard deviation are shown; yARF1 23 °C = 408 cells, yARF1 37 °C = 408 cells, yarf1-11 23 °C = 421 cells, yarf1-11 37 °C = 422 cells from n = 3 biological replicates; two-way ANOVA using Sidak’s multiple comparison, ***P = 0.0009, **P = 0.0032. c, Nile Red staining of LDs in parental HeLa cells (control), ARF1 KO HeLa cells, and ARF1 KO HeLa cells expressing mArf1 or mArf1-11. For each cell line, the numbers of LD were quantified. Images were acquired 24 h after transfection. Mean and standard deviation are shown; HeLa control = 182 cells, ARF1 KO = 181 cells, ARF1 KO +mArf1 = 163 cells, ARF1 KO +mArf1-11 = 151 cells from n = 3 biological replicates; unpaired two-tailed t-test, **P = 0.0096. Scale bar, 5 µm. d, Measurements of TAG in the yARF1 and yarf1-11 strains grown at 23 °C or shifted to 37 °C. Mean and standard deviation are shown from n = 3 biological replicates; unpaired two-tailed t-test, *P = 0.0349; **P = 0.002. e, LDs (Erg6) and mitochondria (Tom70) morphologies imaged in the yARF1 and yarf1-11 parental strains and in strains deprived of SCS3 and YFT2 (∆scs3yft2) grown at 23 °C or shifted to 37 °C. f, LipidTox staining of LDs in WT and ∆arf1 strains grown at 23 °C or shifted to 37 °C. Mean and standard deviation are shown; WT 23 °C = 669 cells, WT 37 °C = 662, ∆arf1 23 °C = 673 cells, ∆arf1 37 °C = 659 cells from n = 3 biological replicates Two-way ANOVA using Sidak’s multiple comparison, WT versus ∆arf1 23 °C **P = 0.0032, WT versus ∆arf1 37 °C **P = 0.001. g, Measurements of TAG in the WT and ∆yarf1 strains grown at 23 °C or shifted to 37 °C. Mean and standard deviation are shown from n = 3 biological replicates; unpaired two-tailed t-test, ***P = 0.0002; ****P = 0.00000396. Source numerical data are available in source data. See also Extended Data Fig. 4. Source data
Fig. 7
Fig. 7. yArf1 regulates LD-associated functions and β-oxidation.
a, Schematic of TAG synthesis and breakdown on LD. Key enzymes involved in TAG synthesis (Dga1), hydrolysis (Tgl4), and FA activation (Faa1) used in our co-IP experiments are shown in green. b,d,e, Co-IP of yArf1–GFP and yArf1-11–GFP with Dga1-6xHA (b), Tgl4-6xHA (d) and Faa1-6xHA (e). Strains were grown at 23 °C or shifted to 37 °C. c, Co-localization of yArf1–GFP and yArf1-11–GFP with the diacylglycerol acyltransferase Dga1 tagged with 3xmCherry grown at 23 °C or shifted to 37 °C for 30 min. Arrows indicate sites of co-localization or juxtaposition between the yArf1/yArf1-11 and Dga1 on the ER or on LD. Scale bars, 5 µm. f, Peroxisome biogenesis followed by microscopy using the peroxisomal marker Pex3 fused to mCherry in the yARF1 and yarf1-11 strains grown at 23 °C or shifted to 37 °C (left). Quantification of peroxisomes per cell in each strain and condition (right). Mean and standard deviation are shown; yARF1 + Pex3–mCherry 23 °C = 1,496 cells, yARF1 + Pex3–mCherry 37 °C = 1,070 cells, yarf1-11 + Pex3–mCherry 23 °C = 1,025 cells, yarf1-11 + Pex3–mCherry 23 °C = 970 cells from n = 3 biological replicates. Scale bars, 5 µm. g, Schematic of TAG mobilization to synthesize acetyl-CoA by peroxisomal β-oxidation in yeast. Relevant proteins monitored in h are shown. Vlc-FA, very-long-chain FAs. h, Immunoblot analysis of all β-oxidation proteins, both acyl-CoA transporters and the Vlc-FA transporter genomically fused to 6xHA in the yARF1 and yarf1-11 strains grown at 23 °C or shifted to 37 °C. Pgk1 was used as loading control. i, Relative fold changes in protein levels from immunodetections done in h. Mean and standard deviation are shown from n = 3 biological replicates. Source numerical data and unprocessed blots are available in source data. See also Extended Data Fig. 5. Source data
Fig. 8
Fig. 8. Acetyl-CoA transfer loss leads to mitochondria fragmentation.
a, Mitochondrial morphology imaged in the yARF1 and yarf1-11 strains grown at 23 °C or shifted to 37 °C and treated with either DMSO or the FA synthesis inhibitor cerulenin. Scale bars, 5 µm. b, Quantification of the mitochondrial phenotypes observed in a. Mean and standard deviation are shown; yARF1 + DMSO 23 °C = 751 cells, yARF1 + DMSO 37 °C = 935 cells, yARF1 + cerulenin 23 °C = 501 cells, yARF1 + cerulenin 37 °C = 654 cells, yarf1-11 + DMSO 23 °C = 616 cells, y arf1-11 + DMSO 37 °C = 740 cells, y arf1-11 + cerulenin 23 °C = 471 cells, y arf1-11 + cerulenin 37 °C = 667 cells from at least n = 3 biological replicates. c, Metabolic pathway leading to TAG synthesis. FAs are used to produce phosphatidic acid (PA), which can be further converted to diacylglycerol (DAG) and to TAG inside LDs by the Lro1 and Dga1 enzymes. The FA synthesis inhibitor cerulenin inhibits TAG synthesis. d, Schematic of the experiment done in e. Yeast cells are first grown for 30 min at 37 °C, treated with BODIPY Red-C12 for another 30 min at 37 °C, washed and imaged. e, Acetyl-CoA transfer to mitochondria monitored in the yeast ARF1 and arf1-11 strains grown at 37 °C using the fluorescent FA BODIPY Red-C12. Co-localization of GFP signal (mitochondria) over Red-C12 one was measured using Mander’s co-localization index. Mean and minimum to maximum are shown, box ranges from the first (Q1–25th percentiles) to the third quartile (Q3–75th percentiles) of the distribution; yARF1 37 °C = 115 cells, yarf1-11 37 °C = 123 cells from n = 3 biological replicates; Unpaired two-tailed t-test, ****P = 0.000000000000001. f, Schematic representation of the FA pulse-chase assay. Cells were stained with BODIPY Red-C12 for 16 h in CM, washed and chased for 9 h in nutrient-depleted medium (HBSS). Then before imaging, cells were stained for 30 min with the MitoView dye. g,h, ARF1 KO cells expressing mArf1–GFP or mArf1-11–GFP were pulsed with BODIPY Red-C12 for 16 h, incubated 1 h in CM, transferred in HBSS (0 h; g) and chased HBSS for 9 h (h). BODIPY Red-C12 was initiated 24 h after mArf1 or mArf1-11 transfection. Scale bar, 10 µm. Scale bar inlays, 2 µm. i, Relative BODIPY Red-C12 localization measured by Pearson’s co-localization index. Mean and minimum to maximum are shown, box ranges from the first (Q1–25th percentiles) to the third quartile (Q3–75th percentiles) of the distribution; ARF1 KO + mArf1 0 h = 114 cells, ARF1 KO + mArf1-11 0 h = 122 cells, ARF1 KO + mArf1 9 h = 145 cells, ARF1 KO + mArf1-11 9 h = 153 cells from n = 3 biological replicates; two-way ANOVA using Sidak’s multiple comparison test, ****P = 0.000000000000001. NS, not significant. j, Schematic of the model we propose for Arf1 role in FA metabolization and how this affects maintenance of mitochondria morphology. For more details, see Discussion. Source numerical data are available in source data. See also Extended Data Figs. 6–10. Source data
Extended Data Fig. 1
Extended Data Fig. 1. yArf1 regulates mitochondria fusion and fission.
(A–D) Single time-point images of movies done with strains expressing yArf1-GFP (A) or yArf1-11-GFP (B) and the mitochondrial protein Tom70-mCherry at 23 °C, or shifted 30 min at 37 °C for yArf1-GFP (C) and yArf1-11-GFP (D). Merge and individual GFP and mCherry channels are shown. Arrows indicate mitochondrial fusion (yellow) and fission (white). Asterisk indicates mitochondrial fusion independent of yArf1-11. Scale bars: 5 µm.
Extended Data Fig. 2
Extended Data Fig. 2. yArf1-11 is a hyperactive mutant present on the ER and LDs.
(A, B) Co-localization of yArf1-GFP (A) and yArf1-11-GFP (B) with the cis-Golgi marker Mnn9-mCherry grown at 23 °C or shifted to 37 °C. Arrows indicate sites of co-localization between yArf1/yArf1-11 and Mnn9. Scale bar: 5 µm. (C, D) Co-localization of yArf1-GFP (C) and yArf1-11-GFP (D) with the trans-Golgi marker Sec7-mCherry and Tvp23-mCherry grown at 23 °C or shifted to 37 °C. Arrows indicate sites of co-localization between yArf1/yArf1-11 and the corresponding markers. (E, F) Transmission electron microscopy of the yArf1-11-GFP strain grown either at 23 °C (E) or shifted to 37 °C for 30 min (F). yArf1-11-GFP localizations were highlighted by immunogold labelling, and dotted squares shows enlargements of yArf-11 specific localizations (arrows). Scale bar: 500 nm, scale bar magnification: 200 nm. (G, H) Co-localization of yArf1-GFP and yArf1-11-GFP with the COPI markers Sec21-mCherry (G) and Sec27-mCherry (H) grown at 23 °C or shifted to 37 °C. Arrows indicate sites of co-localization between the yArf1 or yArf1-11 and COPI components. Scale bar: 5 µm.
Extended Data Fig. 3
Extended Data Fig. 3. Functional conservation of Arf1-11 in mammalian cells.
(A) Alignment of mammalian Arf1 (mArf1), yeast Arf1 (yArf1) and the yeast arf1-11 (yArf1-11) amino acids sequences. Arf1-11 mutation’s and their corresponding amino acids in mArf1 are shown. (B) Immunoblot analysis of Arf1 presence in parental HeLa cells and the CRISPR-Cas9 ARF1 KO cells. For each cell line, three independent biological replicates were analyzed on the same gel. (C) Immunoblot analysis of Arf1-GFP presence in ARF1 KO HeLa cells transfected either with an empty vector (EV), with mArf1-GFP or with mArf-11-GFP. For each cell line, three independent biological replicates were analyzed on the same gel. Actin was used as internal control. (D) Cell viability assay as percent of GFP-positive cells in the total population after transfection of EV, mArf1-GFP or mArf-11-GFP. Mean and standard deviation are shown from n = 3 biological replicates. (E, F) Co-localization of mArf1- (E) and mArf1-11-GFP (F) expressed in the ARF1 KO cell line with COPI vesicles done by immunostaining against the coatomer subunit beta (bCOP). Squares show magnification of a perinuclear and distal portion of the cell. Scale bars: 10 µm and 5 µm (inlays). Images were acquired 24 h after transfection. (G) Different localizations of mArf1-11 observed in ARF1 KO HeLa cell line expressing mArf1-11-GFP. (H) From the images in (G), four phenotypes were identified and their occurrences quantified. 380 cells were quantified. (I) Mitochondrial fusion and fission events measured in Parental cell lines, ARF1 KO, ARF1 KO expressing mArf1- or mArf1-11-GFP. Events were scored 48 h after transfection. Mean and standard deviation are shown, Parental = 31 cells, ARF1 KO = 53 cells, ARF1 KO+mArf1 = 41 cells, ARF1 KO+mArf1-11 = 38 cells from n = 3 biological replicates; Statistical analysis were done using a two-way ANOVA test with Turkey’s multiple comparison test, ****p = 0.000000000048; ***p = 0.001; **p = 0.0047. Source numerical data and unprocessed blots are available in source data. See also Supplementary data 1. Source data
Extended Data Fig. 4
Extended Data Fig. 4. Hyperactive Arf1 induces triacylglycerol accumulation.
(A) Transmission electron microscopy of yARF1 and yarf1-11 strains grown at 23 °C. Scale bars: 2000 nm. (B, C) Measurements of sterols (B) and phospholipids (C) in yARF1 and yarf1-11 strains grown at 23 °C or shifted to 37 °C. PC: phosphatidylcholine, PE: phosphatidylethanolamine, PI: phosphatidylinositol, PS: phosphatidylserine. Mean and standard deviation are shown from n = 3 biological replicates. (D) Transmission electron microscopy of WT and ∆yarf1 strains grown at 23 °C or shifted to 37 °C. Scale bars: 2000 nm. (E) LipidTox staining of LDs in WT and ∆yarf1 strains grown at 23 °C or shifted to 37 °C. Scale bar: 5 µm. (F) Measurements of sterols in WT and ∆yarf1 strains grown at 23 °C or shifted to 37 °C. Mean and standard deviation are shown from n = 3 biological replicates. (G) Measurements of LD numbers in WT cells expressing constitutively active yArf1-CA- or dominant negative yArf1-DN-GFP using Erg6-mCherry as marker. Mean and standard deviation are shown; WT + EV 23 °C = 303 cells, WT+yArf1-CA 23 °C = 298 cells, WT+yArf1-DN 23 °C = 289 cells, WT + EV 37 °C = 291 cells, WT+yArf1-CA 37 °C = 316 cells, WT+yArf1-DN 37 °C = 300 cells from n = 3 biological replicates. Statistical analysis were done using a two-way ANOVA test with Turkey’s multiple comparison test, +EV vs +CA 23 °C ****p = 0.000000271; +EV vs +DN 23 °C ****p = 0.00000871; ***p = 0.0006; *p = 0.022 from n = 3 biological replicates. Scale bar: 5 µm. (H) Measurements of LD numbers in COPI ts-mutants sec21-1, sec27-1, ret1-1 and their corresponding parental strains by LipidTox. Mean and standard deviation are shown; ySEC21-27 23 °C = 559 cells, ysec21-1 23 °C = 563 cells, ysec27-1 23 °C = 560 cells, ySEC21-27 37 °C = 557 cells, ysec21-1 37 °C = 527 cells, ysec27-1 37 °C = 572 cells, yRET1 23 °C = 377 cells, yret1-1 23 °C = 553, yRET1 37 °C = 427 cells, yret1-1 37 °C = 486 cells; Statistical analysis were done using a two-way ANOVA test with Turkey’s multiple comparison test, **p = 0.0034; *p = 0.0215 from n = 3 biological replicates. Scale bar: 5 µm. Source numerical data are available in source data. Source data
Extended Data Fig. 5
Extended Data Fig. 5. yArf1 regulates LD-associated functions and ß-oxidation.
(A) Growth test of yARF1 and yarf1-11 strains, deprived of the LRO1/DGA1 (∆lro1dga1) or of PEX34 (∆pex34), on rich media (YPD), rich media lacking saturated fatty acids (SFA) and containing cerulenin (Cer) (non-sup), containing SFA or SFA and cerulenin at 23 °C. (B) Co-localization of yArf1-GFP and yArf1-11-GFP with Lro1-3xmCherry grown at 23 °C or shifted to 37 °C for 30 min. Arrows indicate yArf1/yArf1-11 co-localizing or juxtaposed to Lro1. Scale bar: 5 µm. (C, D) In vivo TAG mobilization assay performed on yARF1 and yarf1-11 strains. Cellular TAG levels evidenced by thin-liquid chromatography extracted from cells grown in the presence of cerulenin or DMSO (C) were measured (D). Mean and standard deviation from at least n = 3 biological replicates are shown. (E) Peroxisome numbers evaluated by microscopy using Pex11-mScarlet in the yARF1- and yarf1-11-GFP strains grown at 23 °C or shifted to 37 °C. Peroxisome numbers per cell were quantified in each strain and conditions. Mean and standard deviation are shown; yArf1+Pex11-mScarlet 23 °C = 289 cells, yArf1+Pex11-mScarlet 37 °C = 431 cells, yArf1-11+Pex11-mScarlet 23 °C = 200 cells, yArf1-11+Pex11-mScarlet 37 °C = 304 cells from n = 3 biological replicates. Scale bar: 5 µm. (F) Co-immunoprecipitation of yArf1-GFP and yArf1-11-GFP with Pex13-6xHA. Strains were grown at 23 °C or shifted to 37 °C. (G) High-resolution microscopy of yARF1- and yarf1-11-GFP strains expressing Pex11-mScarlet grown at 23 °C or shifted to 37 °C. Arrows indicate Arf1 partially co-localizing with, or juxtaposed to peroxisomes. Scale bars: 5 µm. (H) mRNA levels measurement of POX1, PXA1 and PXA2 in yarf1-11 compared to yARF1 grown at 37 °C by qRT-PCR. Fold changes were measured by the 2−∆∆Ct method. Mean and standard deviation from n = 3 biological replicates are shown. (I) Growth test of yARF1, yarf1-11, ∆lro1dga1 or ∆pex34 strains, on YPD or media supplemented with 0.3 M sodium acetate at 23 °C and 30 °C. Source numerical data and unprocessed blots are available in source data. Source data
Extended Data Fig. 6
Extended Data Fig. 6. Acetyl-CoA transfer loss leads to mitochondria fragmentation.
(A) Lipid droplets morphologies and Erg6 localization imaged in the yARF1 and yarf1-11 parental strains (LRO1 DGA1) or in strains deprived of LRO1 DGA1 (∆lro1dga1) grown at 23 °C or shifted to 37 °C. Scale bar: 5 µm. (B) Mitochondrial morphologies imaged in the parental or ∆lro1dga1 yARF1 and yarf1-11 strains grown at 23 °C or shifted to 37 °C. Scale bar: 5 µm. (C) Quantification of the mitochondrial phenotypes observed in (B). Mean and standard deviation are shown; yARF1 23 °C = 1213 cells, yarf1-11 23 °C = 948 cells, yARF1 ∆lro1∆dga1 23 °C = 804 cells, yarf1-11 ∆lro1∆dga1 23 °C = 1832 cells, yARF1 37 °C = 937 cells, yarf1-11 37 °C = 732 cells, yARF1 ∆lro1∆dga1 37 °C = 640 cells, yarf1-11 ∆lro1∆dga1 37 °C = 988 cells from n = 4 biological replicates. (D) Lipid droplets morphologies and Erg6 localization imaged in the yARF1 and yarf1-11 strains grown at 23 °C or shifted to 37 °C and treated with either DMSO or the fatty acid synthesis inhibitor cerulenin for 6 h. Scale bar: 5 µm. (E) Cell growth monitoring of yARF1 and yarf1-11-GFP strains treated with DMSO or with cerulenin at 23 °C and shifted to 37 °C as seen in (D). Mean and standard deviation from n = 3 biological replicates are shown. (F) Mitochondrial morphologies were imaged in the parental WT cells in which peroxisomal biogenesis was abolished (∆pex3 ∆pex19), or cells lacking enzymes of the ß-oxidation ∆pox1 or ∆pot1. All strains were grown at 23 °C or shifted to 37 °C, and Tom70-GFP was used as a mitochondrial marker. Mitochondrial phenotypes observed were quantified and mean and standard deviation are shown. yARF1 37 °C = 166 cells, yARF1 ∆peroxisomes 37 °C = 180 cells, yARF1pox1 37 °C = 574 cells, yARF1pot1 37 °C = 539 cells from n = 3 biological replicates. Scale bar: 5 µm. Source numerical data are available in source data. Source data
Extended Data Fig. 7
Extended Data Fig. 7. Acetyl-CoA transfer is modulated by yArf1 localization.
(A, B) Red-C12 transfer to mitochondria in y∆arf1 + LD-anchored (A) or ER-anchored strains (B) grown at 37 °C. Cox4-mTaqBFP2 was used as mitochondrial marker. mTaqBFP2 colocalization over Red-C12 measured using Mander’s index. Two-way ANOVA test using Turkey’s multiple comparison test, ****p = 0.00000215; **p = 0.001. Mean and min to max are shown, box ranges from first (25th percentiles) to third quartile (75th percentiles); (A) LD-yArf1-GFP = 187 cells, LD-yArf1-11-GFP = 167 cells, LD-yArf1-CA-GFP = 169 cells and (B) ER-yArf1 = 224 cells, ER-yArf1-11 = 234 cells from n = 3 biological replicates. Scale bar: 2 µm. (C) Red-C12 transfer to mitochondria in yARF1 and ∆peroxisomes strains using Tom70-GFP as a mitochondrial marker. GFP colocalization over Red-C12 measured using Mander’s index. Student unpaired two-tailed t-test. *p = 0.0315. Mean and min to max are shown, box ranges from first (25th percentiles) to third quartile (75th percentiles); yARF1 = 200 cells, yARF1peroxisomes = 185 cells from n = 3 biological replicates. Scale bar: 2 µm. (D) Mitochondrial morphology in WT (PEX34) or ∆pex34 strains grown at 23 °C or shifted to 37 °C. Mean and standard deviation are shown; yARF1 23 °C = 689 cells, yARF1 37 °C = 698 cells, yarf1-11 23 °C = 743 cells, yarf1-11 37 °C = 517 cells, yARF1pex34 23 °C = 1740 cells, yARF1pex34 37 °C = 1592 cells, yarf1-11pex34 23 °C = 1546 cells, yarf1-11pex34 37 °C = 1622 cells from n = 3 biological replicates. Scale bar: 5 µm. (E) TEM of yARF1 and yarf1-11 strains grown at 37 °C for 30 min. LD: lipid droplet; M: mitochondria. Scale bars: 1000 nm. (F) LD-mitochondria contacts quantified based on TEM images (E). n = 130 cells (yARF1 23 °C), n = 136 cells (yARF1 37 °C), n = 138 cells (yarf1-11 23 °C), n = 156 cells (yarf1-11 37 °C). (G, H) ER-mitochondria contacts quantification (G) and length (H) based on (E). Image in (H) shows an example of ER-mitochondria contact. Means are shown. Unpaired two-tailed T-test, yARF1 vs yarf1-11 23 °C ****p = 0.00000638; yARF1 vs yarf1-11 37 °C ****p = 0.0000000000072. n = 101 cells (yARF1 23 °C), n = 139 cells (yARF1 37 °C), n = 155 cells (yarf1-11 23 °C), n = 104 cells (yarf1-11 37 °C). Source numerical data are available in source data. Source data
Extended Data Fig. 8
Extended Data Fig. 8. OXPHOS activity and ATP synthesis are impaired in yarf1-11.
(A) Growth test of yARF1 and yarf1-11 strain on rich media (YPD), on respiratory media (YPGly) or with oligomycine (YPGly+Oligo) at 23 °C and 30 °C. (B, C) Membrane potential measured on isolated mitochondria by Rhodamine-123 at 23 °C or 30 °C in yARF1 and yarf1-11 strains in the presence of external ADP (B) or to test ATP-driven proton pumping (C). (D, E) ATP synthesis (D) and ATPase rate (E) measured on isolated mitochondria from yARF1 and yarf1-11 strains grown at 23 °C or 30 °C. Means are shown from n = 2 biological replicates and 3 technical replicates and (E) n = 4 biological replicates. (F) Intracellular ATP levels quantified in yARF1 and yarf1-11 strains grown at 23 °C or shifted to 37 °C. FRET ratios correspond to relative ATP levels. Median and individual values are shown. Unpaired two-tailed T-test, yARF1 vs yarf1-11 23 °C ****p = 0.000000000000001; yARF1 vs yarf1-11 37 °C ****p = 0.0000000000372; yARF1 23 °C = 332 cells, yARF1 37 °C = 332 cells, yarf1-11 23 °C = 362 cells, yarf1-11 37 °C = 409 cells from n = 4 biological replicates. Scale bar: 5 µm. (G) Relative ATP levels (RLU) measured by Luciferase assay in yARF1 and yarf1-11 strains. Two-way ANOVA using Turkey’s multiple comparison test, 30 min ****p = 0.00000295; 120 min ****p = 0.000000000000028; ***p = 0.0001. Mean and standard deviation are shown from n = 6 biological replicates. (H) ATP synthesis rate measured on isolated mitochondria from WT and ∆yarf1 strains grown at 23 °C or 30 °C. Means are shown from n = 2 biological replicates and 3 technical replicates. (I) Respiration rate measured on isolated mitochondria from yARF1 and yarf1-11 strains grown at 23 °C or 30 °C. Two-way ANOVA using Sidak’s multiple comparison test. NADH + CCCP yARF1 vs yarf1-11 30 °C ****p = 0.00000000097, Asc/TMPD + CCCP yARF1 vs yarf1-11 30 °C ****p = 0.000000000014, **p = 0.0186. Median and standard deviation are shown from n = 4 biological replicates. (J) Respiration coupled to oxygen respiration (P/O) and percentage of Rho 0 and Rho-minus were measured. Source numerical data are available in source data. Source data
Extended Data Fig. 9
Extended Data Fig. 9. yArf1 is present at organellar contact sites.
(AC) High-resolution microscopy of yArf1-CFP strain expressing Erg6-YFP as LD marker, Pex3-mCherry as peroxisomal marker and MitoTracker Deep Red FM to stain for mitochondria. Cells were grown at 23 °C or shifted to 37 °C for 30 min. Localizations of LD and yArf1 (A), peroxisomes and yArf1 (B), or LD-peroxisomes and yArf1 (C) at the vicinity of mitochondria were established by following individual fluorescent intensities of each markers on a 1.5-3 µm distance. Representative images are shown and fluorescent intensities measured along the dotted lines. Single planes of 0.2 µm thickness are shown. Scale bar: 2 µm.
Extended Data Fig. 10
Extended Data Fig. 10. mArf1 is present at organellar contact sites.
(AC) mArf1-GFP localization in ARF1 KO cells grown in complete media (A), shifted for 14 h in HBSS (B) or in the presence of oleate (C). Arrows indicate the presence of mArf1 at mitochondria-LD contact sites, mitochondria-peroxisomes contact sites or mitochondria-LD-peroxisomes contact sites. Scale bar: 10 µm, Scale bar inlays: 1 µm. (D) Schematic of Arf1 localization based on images taken in (AC) and in Extended Data Fig. 9A–C. Created with Biorender.com.

References

    1. Spang A. Means of intracellular communication: touching, kissing, fusing. Microb. Cell. 2021;8:87–90. doi: 10.15698/mic2021.05.747. - DOI - PMC - PubMed
    1. Zung N, Schuldiner M. New horizons in mitochondrial contact site research. Biol. Chem. 2020;401:793–809. doi: 10.1515/hsz-2020-0133. - DOI - PubMed
    1. Silva BSC, et al. Maintaining social contacts: the physiological relevance of organelle interactions. Biochim. Biophys. Acta Mol. Cell. Res. 2020;1867:118800. doi: 10.1016/j.bbamcr.2020.118800. - DOI - PMC - PubMed
    1. Tamura Y, Kawano S, Endo T. Organelle contact zones as sites for lipid transfer. J. Biochem. 2019;165:115–123. doi: 10.1093/jb/mvy088. - DOI - PubMed
    1. Wu H, Carvalho P, Voeltz GK. Here, there, and everywhere: the importance of ER membrane contact sites. Science. 2018;361:eaan5835. doi: 10.1126/science.aan5835. - DOI - PMC - PubMed

Publication types

LinkOut - more resources