Randomized Controlled Trial
. 2023 Jul 3;13(1):10697.
doi: 10.1038/s41598-023-37898-0.

Identification of cuproptosis-related lncRNA for predicting prognosis and immunotherapeutic response in cervical cancer

Affiliations
Randomized Controlled Trial

Identification of cuproptosis-related lncRNA for predicting prognosis and immunotherapeutic response in cervical cancer

Xiaoyu Kong et al. Sci Rep. .

Abstract

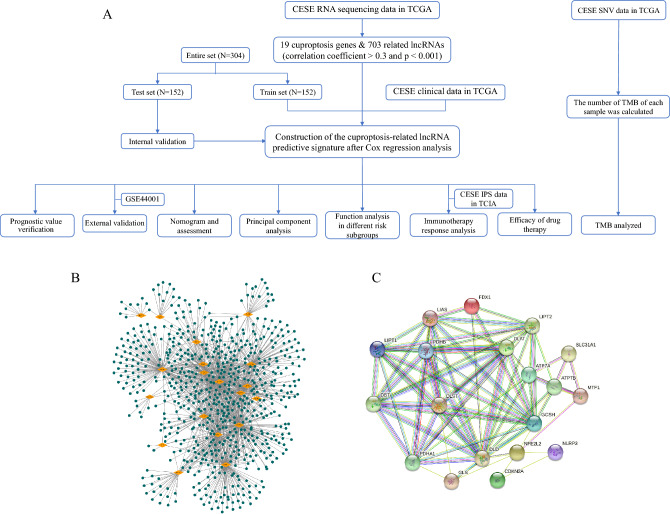
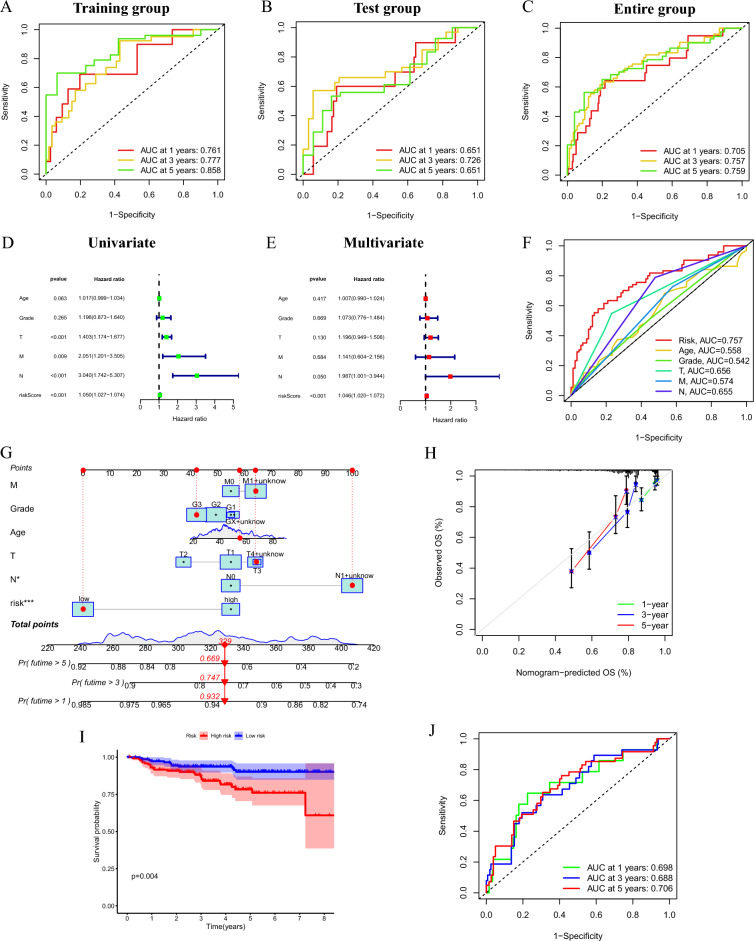
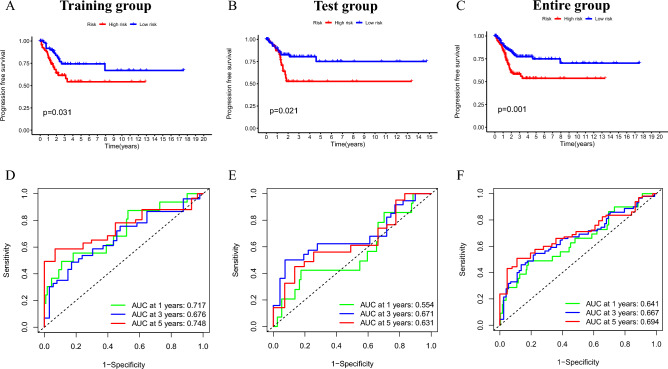
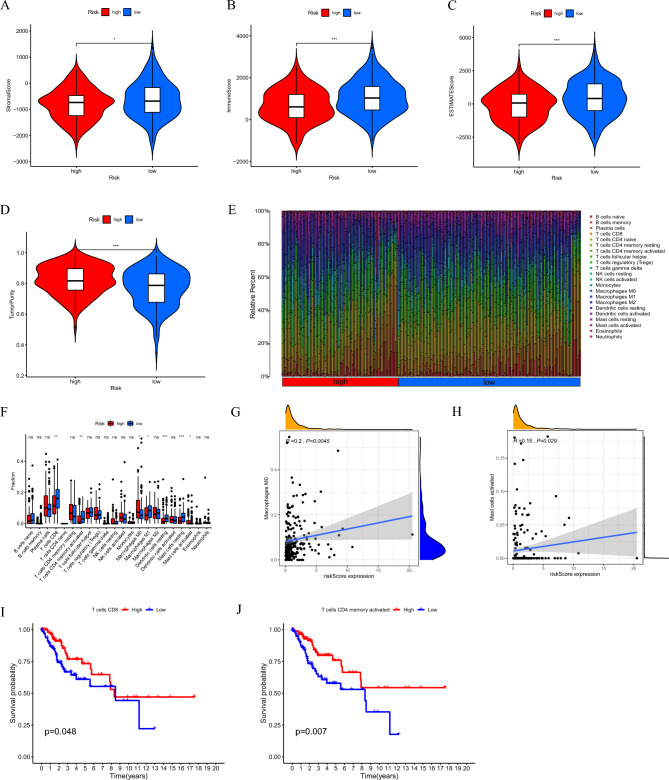
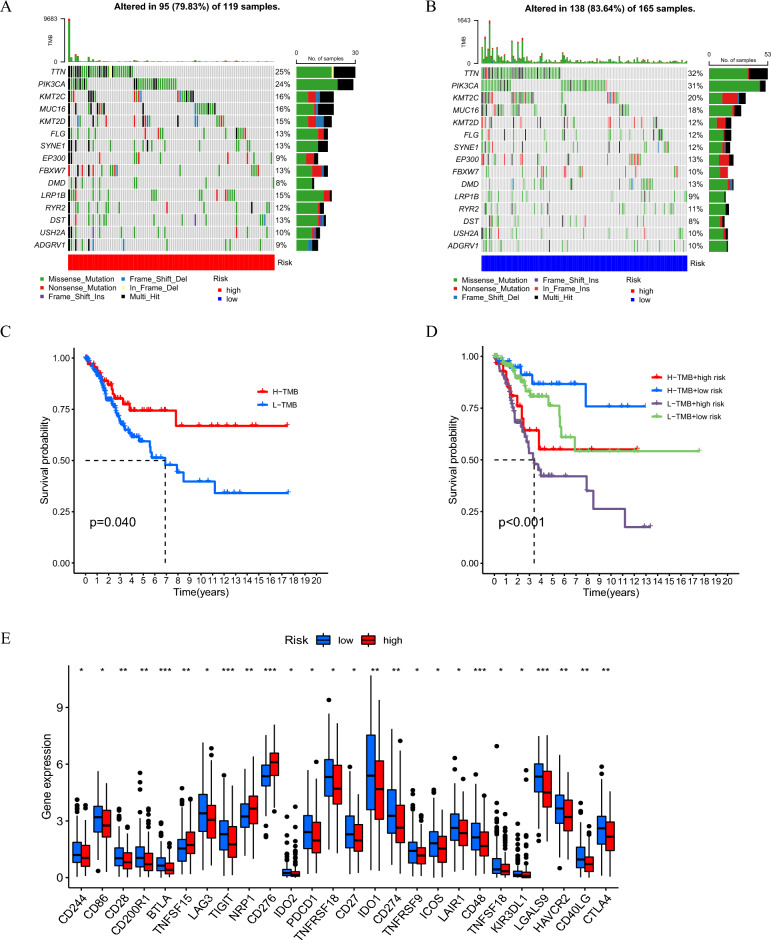
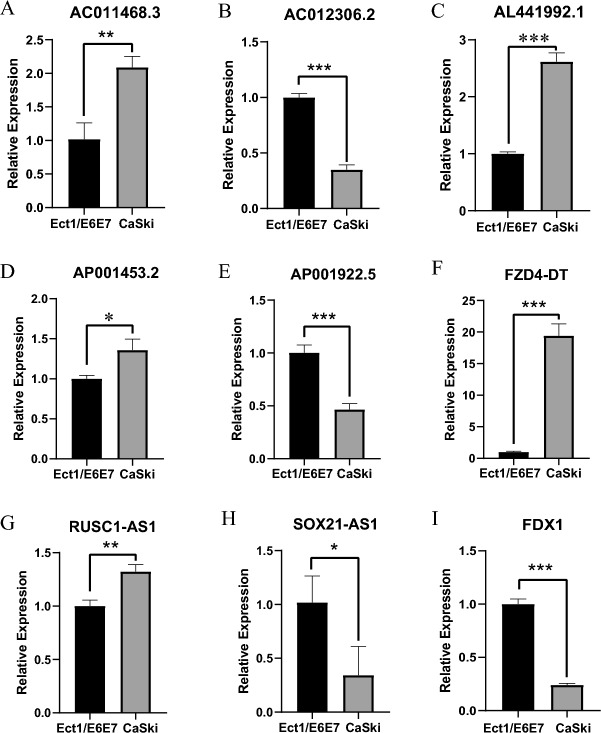
Patients diagnosed with advanced cervical cancer (CC) have poor prognosis after primary treatment, and there is a lack of biomarkers for predicting patients with an increased risk of recurrence of CC. Cuproptosis is reported to play a role in tumorigenesis and progression. However, the clinical impacts of cuproptosis-related lncRNAs (CRLs) in CC remain largely unclear. Our study attempted to identify new potential biomarkers to predict prognosis and response to immunotherapy with the aim of improving this situation. The transcriptome data, MAF files, and clinical information for CC cases were obtained from the cancer genome atlas, and Pearson correlation analysis was utilized to identify CRLs. In total, 304 eligible patients with CC were randomly assigned to training and test groups. LASSO regression and multivariate Cox regression were performed to construct a cervical cancer prognostic signature based on cuproptosis-related lncRNAs. Afterwards, we generated Kaplan-Meier curves, receiver operating characteristic curves and nomograms to verify the ability to predict prognosis of patients with CC. Genes for assessing differential expression among risk subgroups were also evaluated by functional enrichment analysis. Immune cell infiltration and the tumour mutation burden were analysed to explore the underlying mechanisms of the signature. Furthermore, the potential value of the prognostic signature to predict response to immunotherapy and sensitivity to chemotherapy drugs was examined. In our study, a risk signature containing eight cuproptosis-related lncRNAs (AL441992.1, SOX21-AS1, AC011468.3, AC012306.2, FZD4-DT, AP001922.5, RUSC1-AS1, AP001453.2) to predict the survival outcome of CC patients was developed, and the reliability of the risk signature was appraised. Cox regression analyses indicated that the comprehensive risk score is an independent prognostic factor. Moreover, significant differences were found in progression-free survival, immune cell infiltration, therapeutic response to immune checkpoint inhibitors, and IC50 for chemotherapeutic agents between risk subgroups, suggesting that our model can be well employed to assess the clinical efficacy of immunotherapy and chemotherapy. Based on our 8-CRLs risk signature, we were able to independently assess the outcome and response to immunotherapy of CC patients, and this signature might benefit clinical decision-making for individualized treatment.


Conflict of interest statement

The authors declare no competing interests.

Figures

Figure 1
Figure 1
Identification of CRLs. (A) Flowchart of the study. (B) The co-expression network between cuproptosis-related genes and lncRNAs. (C) The PPI network of cuproptosis-related genes.
Figure 2
Figure 2
Construction of prognostic signature. (A) The forest plot of univariate regression analysis. (B) Partial likelihood deviance for the lasso regression. (C) LASSO coefficient profiles. (D) Heat map. (E) Sankey diagram of prognostic CRLs. *P < 0.05, **P < 0.01 and ***P < 0.001.
Figure 3
Figure 3
Predictive value of prognostic model in the training, test, entire group. (A–C) Risk curve for patients with different RS in the training, test, entire group. (D–F) Scatterplots of patients with different survival status and survival time in the training, test, entire group. (G–I) Heatmap of the differences in expression of the 8 CRLs between the risk subgroups in the training, test, entire group. (J–L) Kaplan Meier survival curves of OS in different risk groups in the training, test, entire group.
Figure 4
Figure 4
Kaplan Meier survival curves of risk subgroups in patients stratified by different clinicopathological factors. (A–B) Age. (C–D) Grade. (E–F) M stage. (G–H) N stage M, metastasis; N, lymph node.
Figure 5
Figure 5
Evaluation of predictive performance, independent prognostic analysis and external verification. (A–C) ROC curves of training group, test group and entire group. (D) Forest plot of the results of the univariate Cox regression analysis. (E) Forest plot of the results of multivariate Cox regression analysis. (F) ROC curve of clinicopathological features and risk score, respectively. (G) Nomogram. (H) Calibration curves. (I) The Kaplan–Meier curves of OS in different riskgroups based on GSE44001. (J) ROC curves and AUCs at 1-, 3-, and 5-years survival based on GSE44001.
Figure 6
Figure 6
Performance evaluation of model forecast PFS. (A–C) Kaplan–Meier progression-free survival curves of training group, test group and entire group. (D–F) ROC curves of training group, test group and entire group.
Figure 7
Figure 7
PCA analysis and enrichment analysis. (A–D) Distribution of patients based on whole genome, cuproptosis-related gene sets, cuproptosis-related lncRNAs, predictive signature. (E) Analysis of DEGs for GO. (F) Analysis of DEGs for KEGG (www.kegg.jp/kegg/kegg1.html). Patients in red zone are at high risk, while those in blue zone are at low risk. PC1 first principal component, PC2 second principal component, PC3 third principal component.
Figure 8
Figure 8
TME and immune cell infiltration features in the risk subgroups. (A–D) Comparison of the stromal score, immune score, ESTIMATE score, and tumor purity in two risk subgroups, respectively. (E) The composition of 22 types of tumor-immune infiltration cells. (F) Immune cells fractions between high and low risk groups in boxplots. (G–H) Correlations between risk scores and immune infiltration cells. (I–J) Survival analysis of T cell CD8 and T cells memory activated in CC. *P < 0.05, **P < 0.01 and ***P < 0.001.
Figure 9
Figure 9
Analysis of TMB and immune checkpoints molecules. (A–B) The overall mutation burden of patients in the high- and low-risk groups. (C) Prognosis analysis between the low TMB and high TMB patients. (D) Stratified survival analyses of TMB-H, high tumor mutation burden; TMB-L, low tumor mutation burden. (E) Expression of common immune checkpoints molecules in different risk groups. *P < 0.05, **P < 0.01 and ***P < 0.001.
Figure 10
Figure 10
Response to immunotherapy and chemotherapy. (A–D) Response to treatment with CTLA-4 and PD-1 inhibitors. (E–J) Sensitivity of chemotherapeutic agents A-443654, DMOG, GSK690693, Navitoclax, Temozolomide, and ZSTK474 in the high- and low-risk groups.
Figure 11
Figure 11
Quantitative polymerase chain reaction detection of 8-CRLs and FDX1 expression in cervical normal cell line and CC cell line. (A) AC011468.3. (B) AC012306.2. (C) AL441992.1. (D) AP001453.2. (E) AP001922.5. (F) FZD4-DT. (G) RUSC1-AS1. (H) SOX21-AS1. (I) FDX1. *P < 0.05, **P < 0.01 and ***P < 0.001.

Similar articles

Cited by

References

    1. Arbyn M, et al. Estimates of incidence and mortality of cervical cancer in 2018: A worldwide analysis. Lancet Glob. Health. 2020;8:e191–e203. doi: 10.1016/S2214-109X(19)30482-6. - DOI - PMC - PubMed
    1. Vu M, Yu J, Awolude OA, Chuang L. Cervical cancer worldwide. Curr. Probl. Cancer. 2018;42:457–465. doi: 10.1016/j.currproblcancer.2018.06.003. - DOI - PubMed
    1. Wang R, et al. Human papillomavirus vaccine against cervical cancer: Opportunity and challenge. Cancer Lett. 2020;471:88–102. doi: 10.1016/j.canlet.2019.11.039. - DOI - PubMed
    1. Fu ZZ, et al. Value of apparent diffusion coefficient (ADC) in assessing radiotherapy and chemotherapy success in cervical cancer. Magn. Reson. Imaging. 2015;33:516–524. doi: 10.1016/j.mri.2015.02.002. - DOI - PubMed
    1. Hertlein L, et al. Cetuximab monotherapy in advanced cervical cancer: A retrospective study with five patients. Arch. Gynecol. Obstet. 2011;283:109–113. doi: 10.1007/s00404-010-1389-1. - DOI - PubMed

Publication types