. 2023 Aug;42(32):2428-2438.
doi: 10.1038/s41388-023-02759-7. Epub 2023 Jul 3.

Androgen-regulated stromal complement component 7 (C7) suppresses prostate cancer growth

Affiliations

Androgen-regulated stromal complement component 7 (C7) suppresses prostate cancer growth

Zhicheng Zhou et al. Oncogene. 2023 Aug.

Abstract

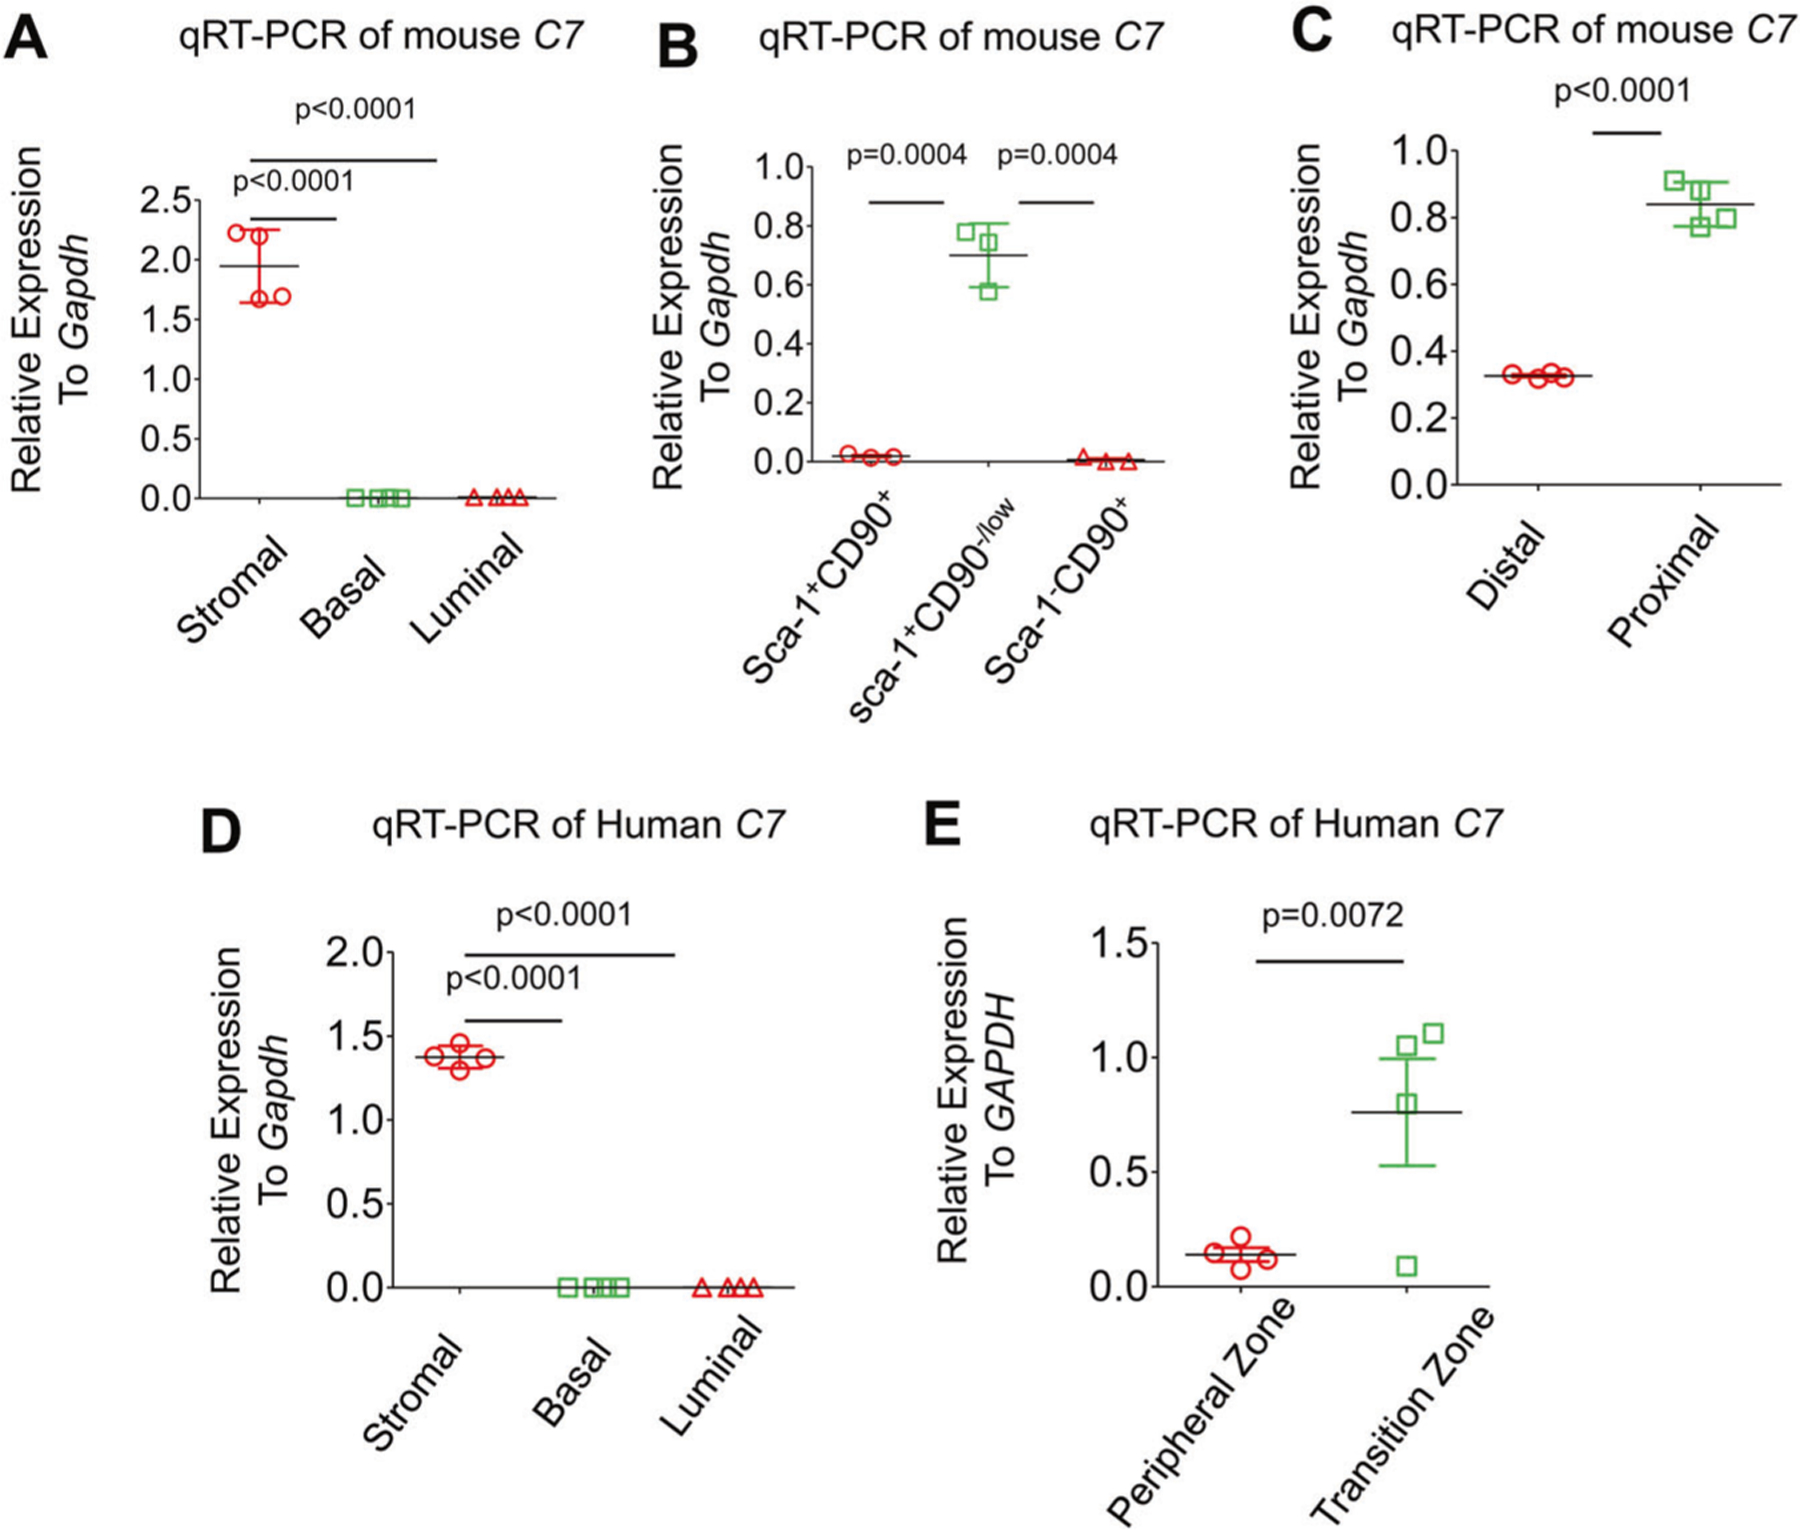
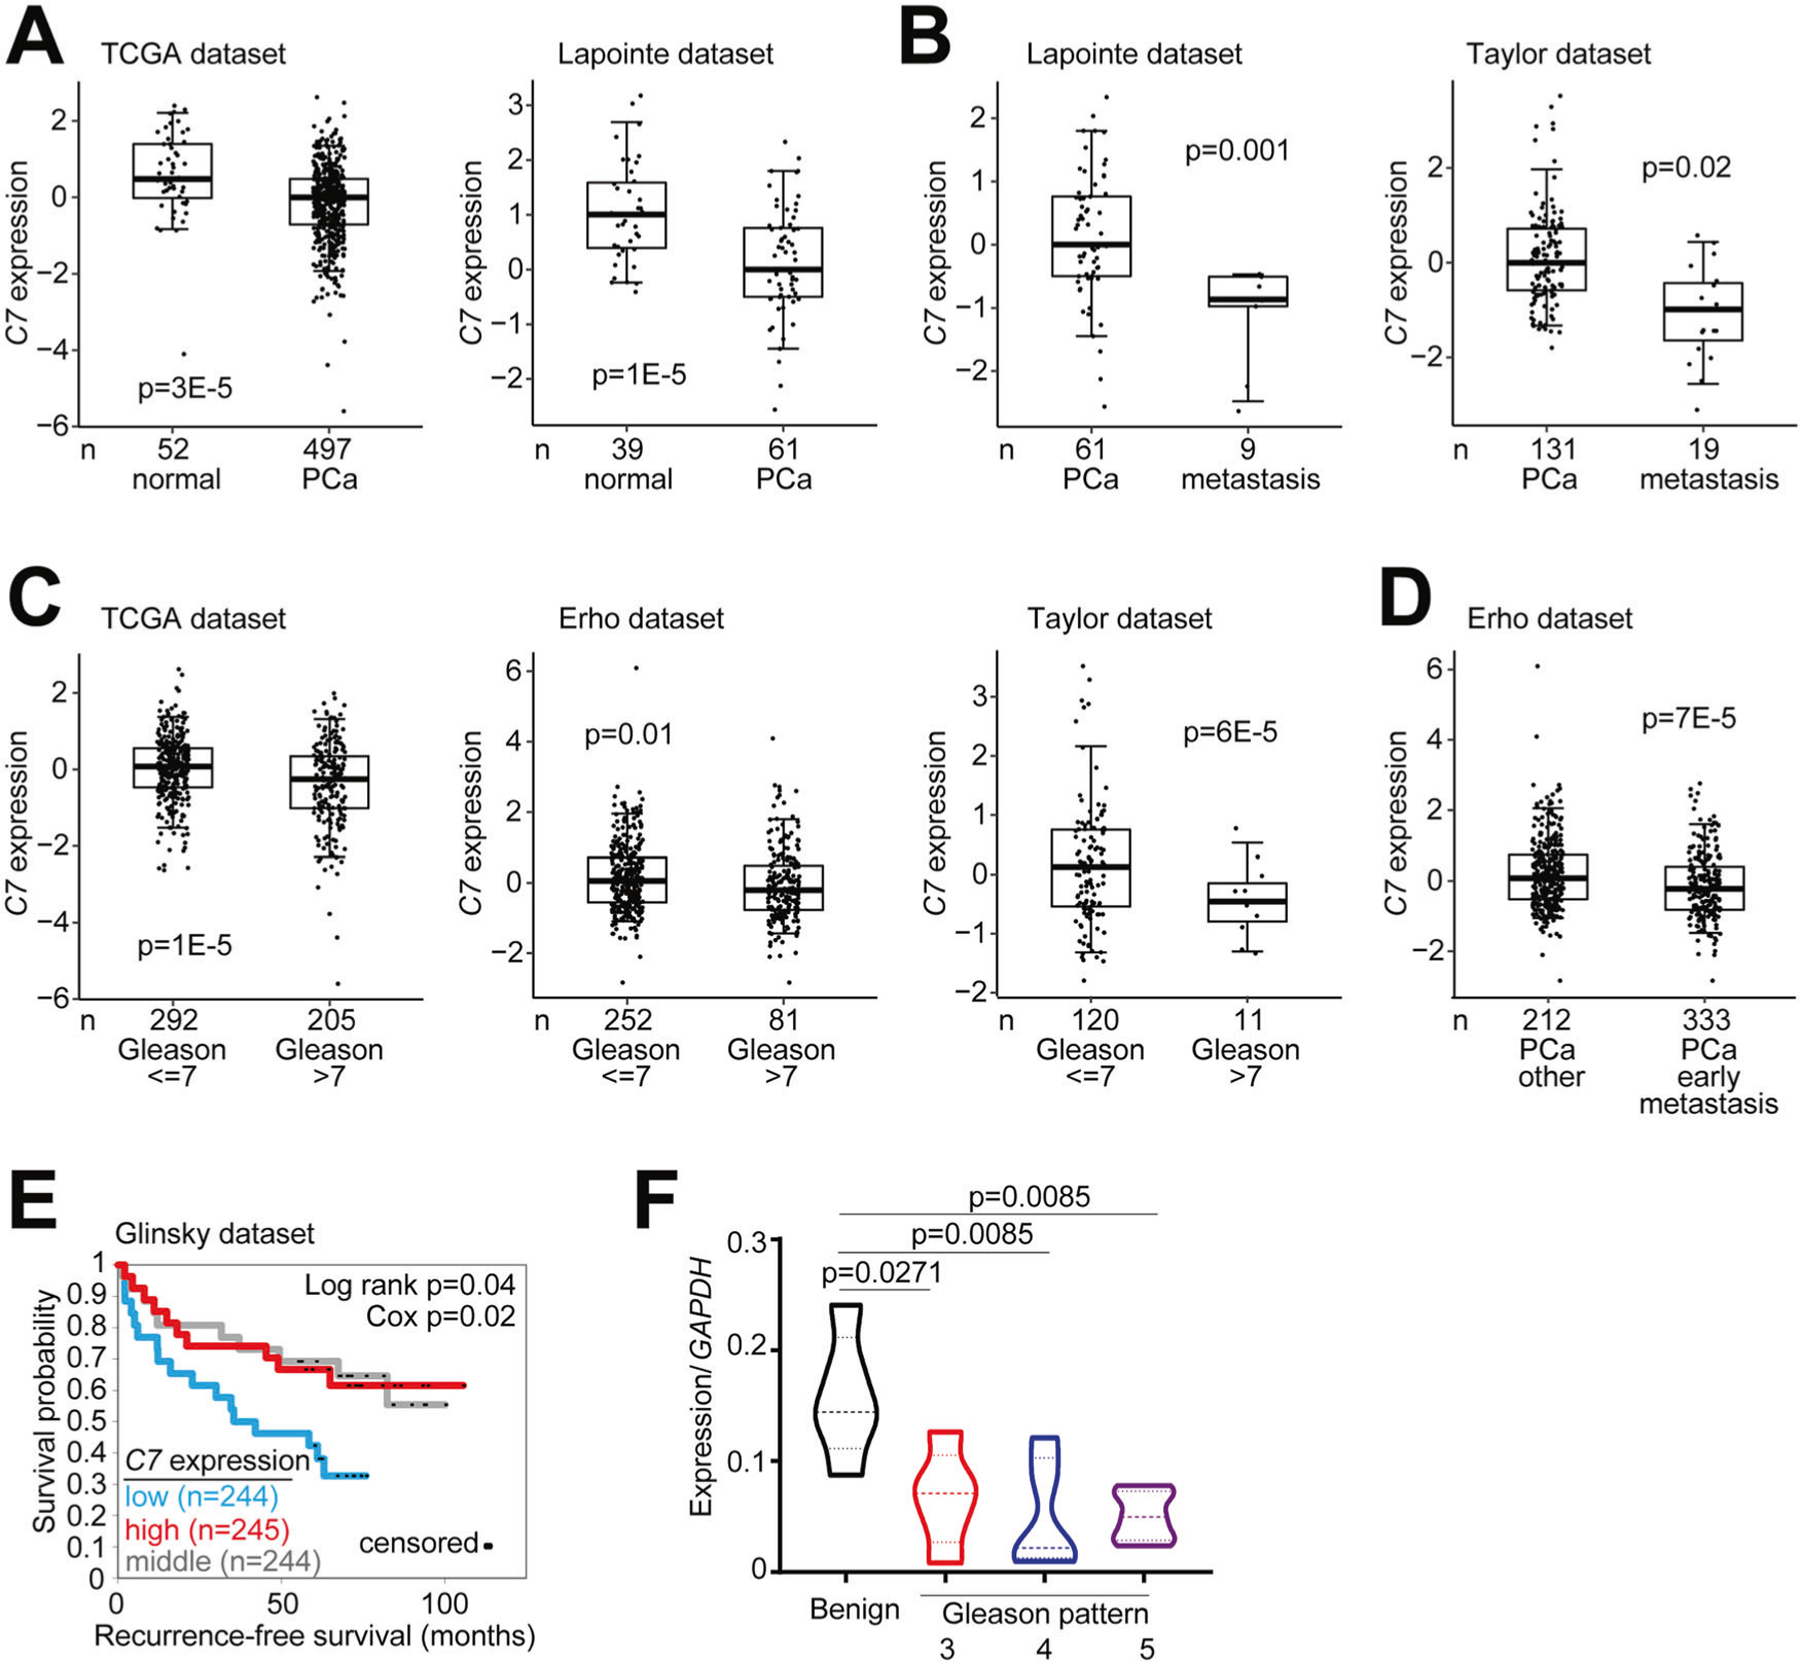
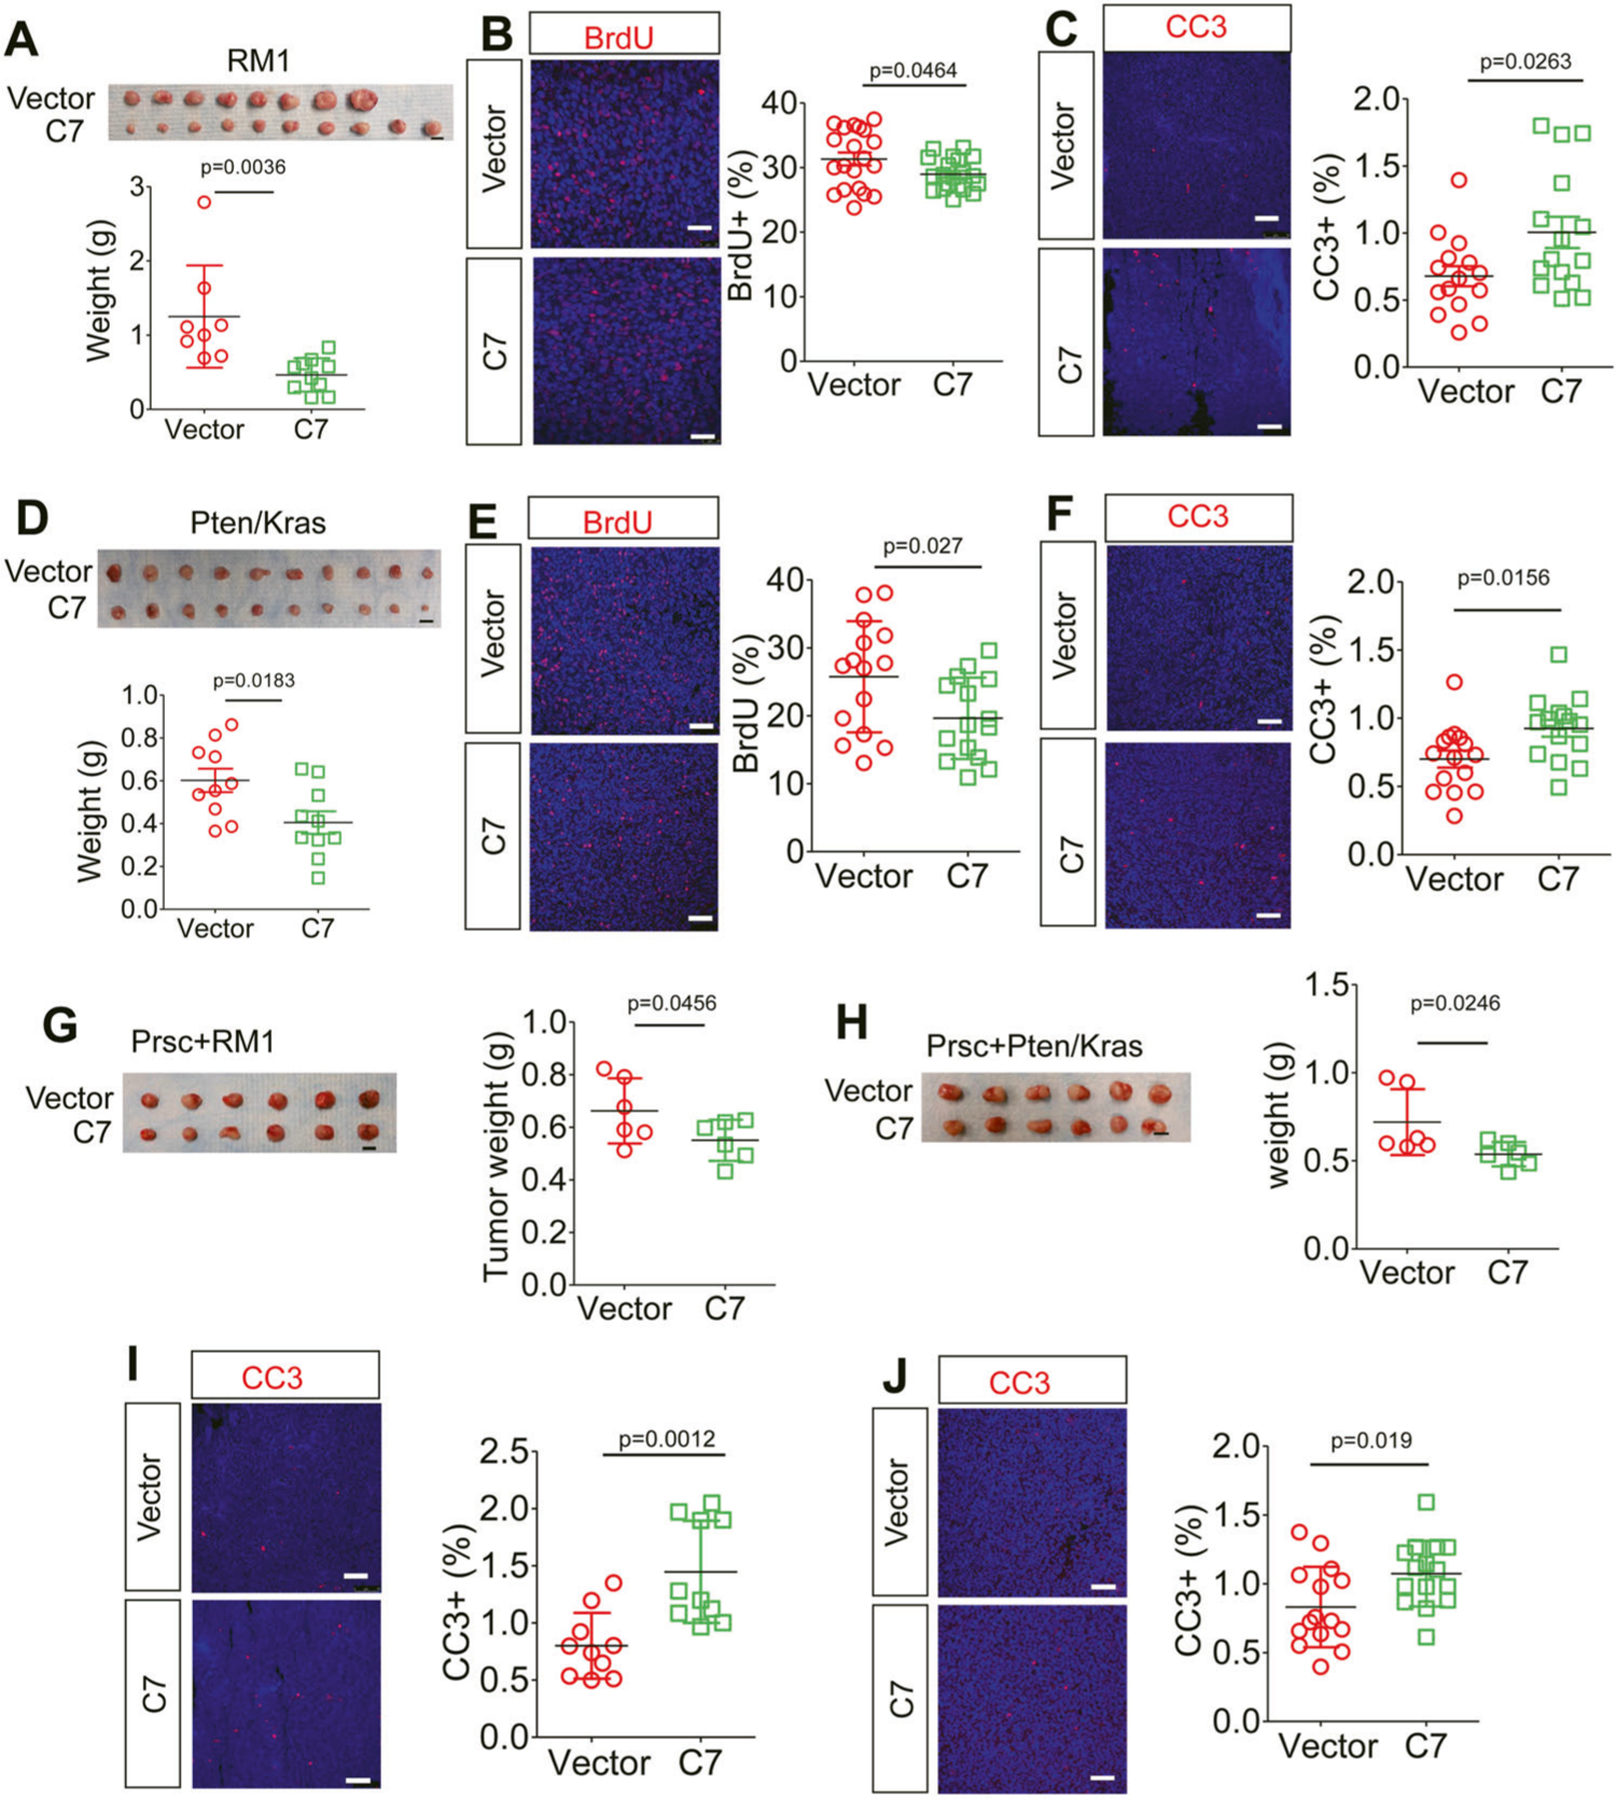
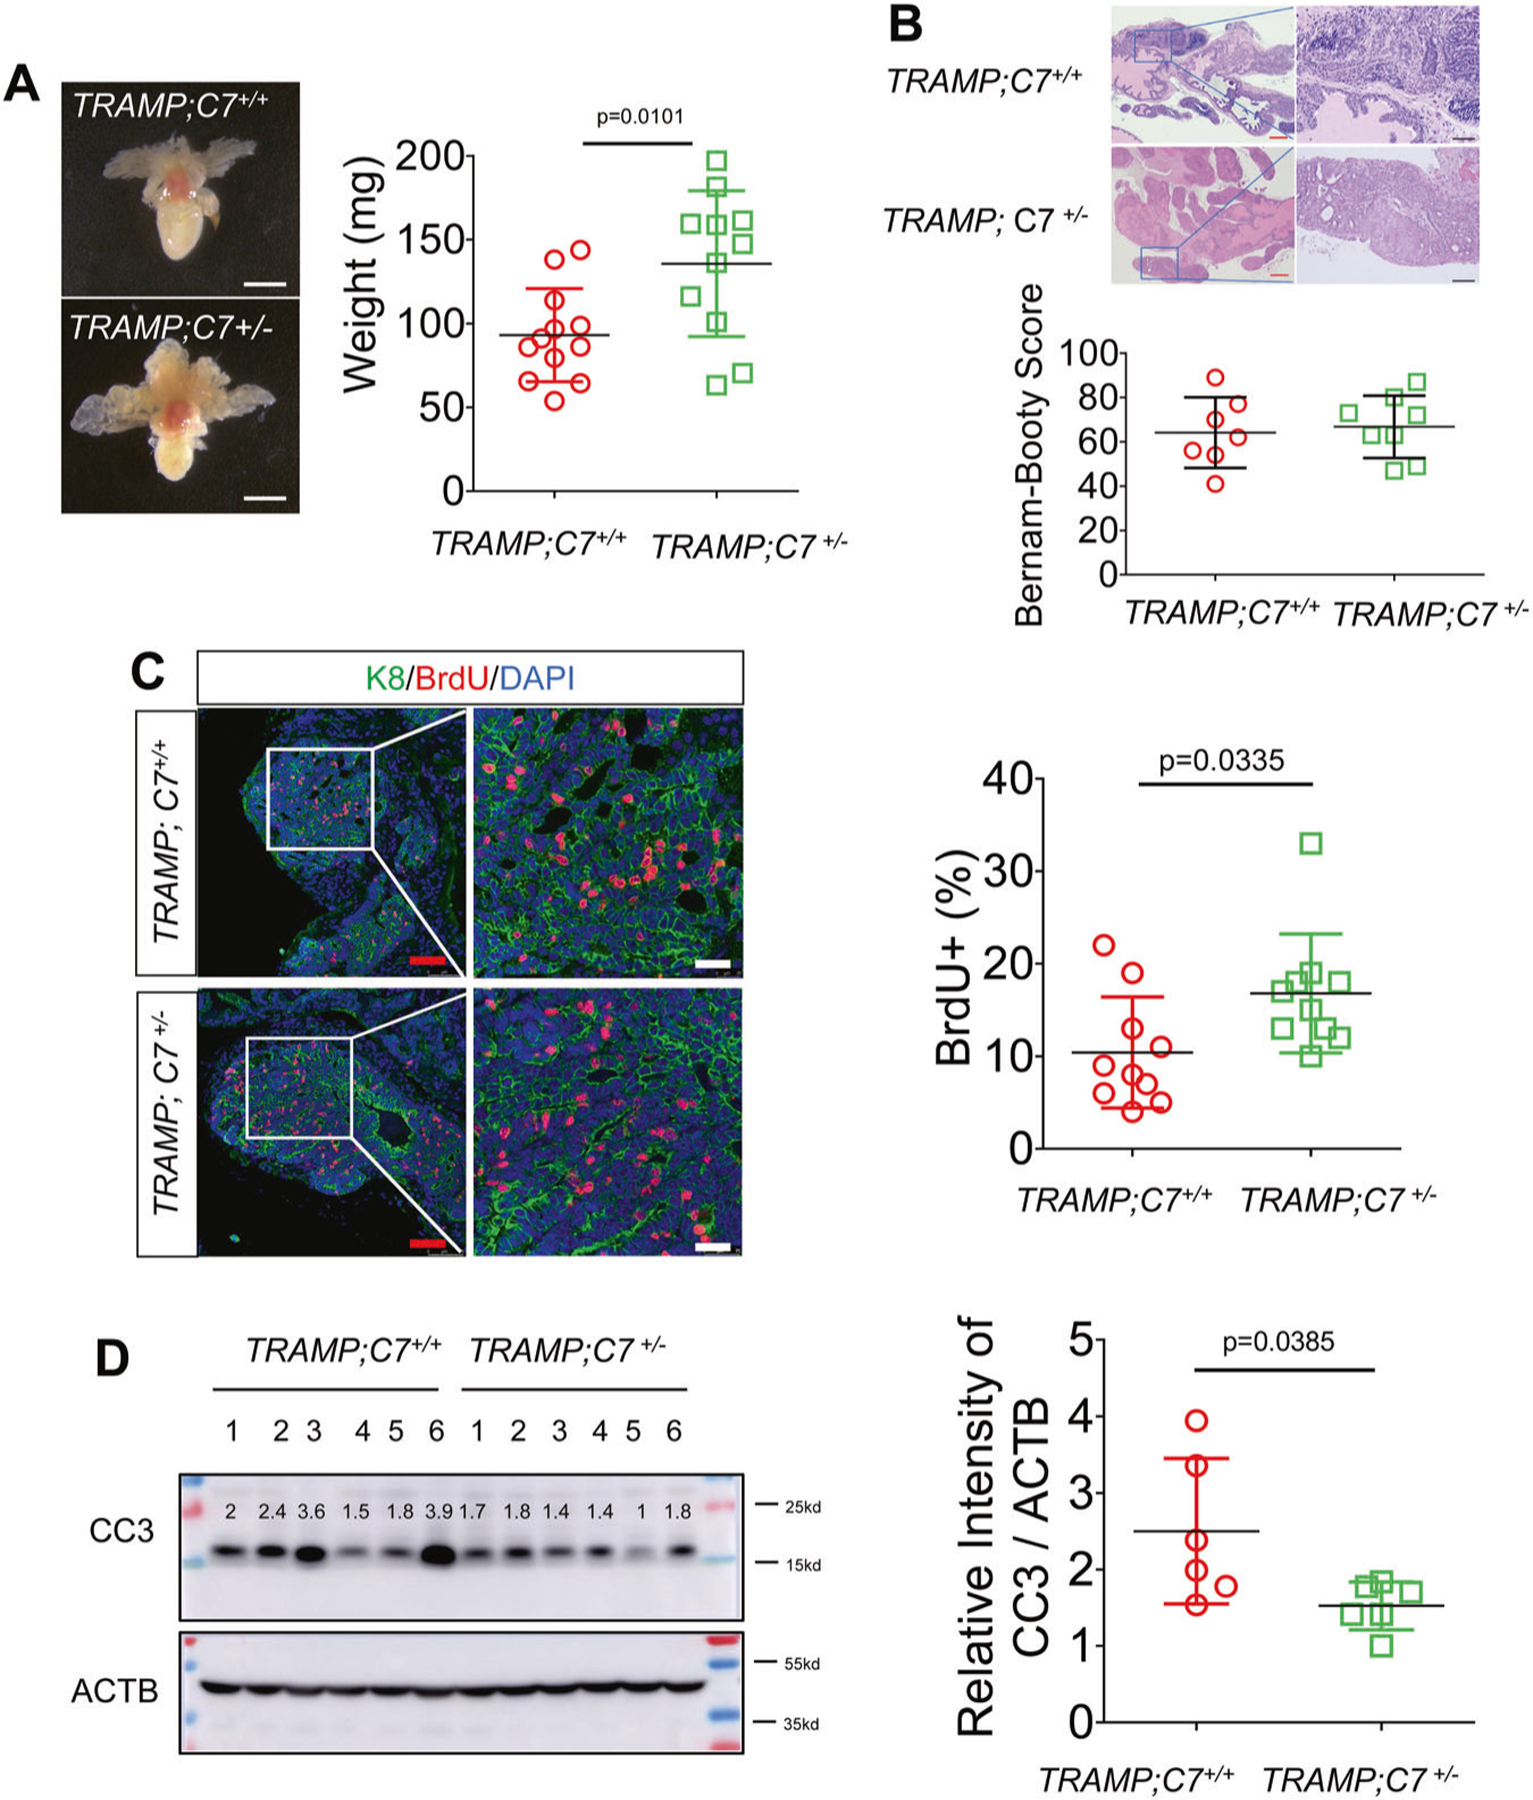
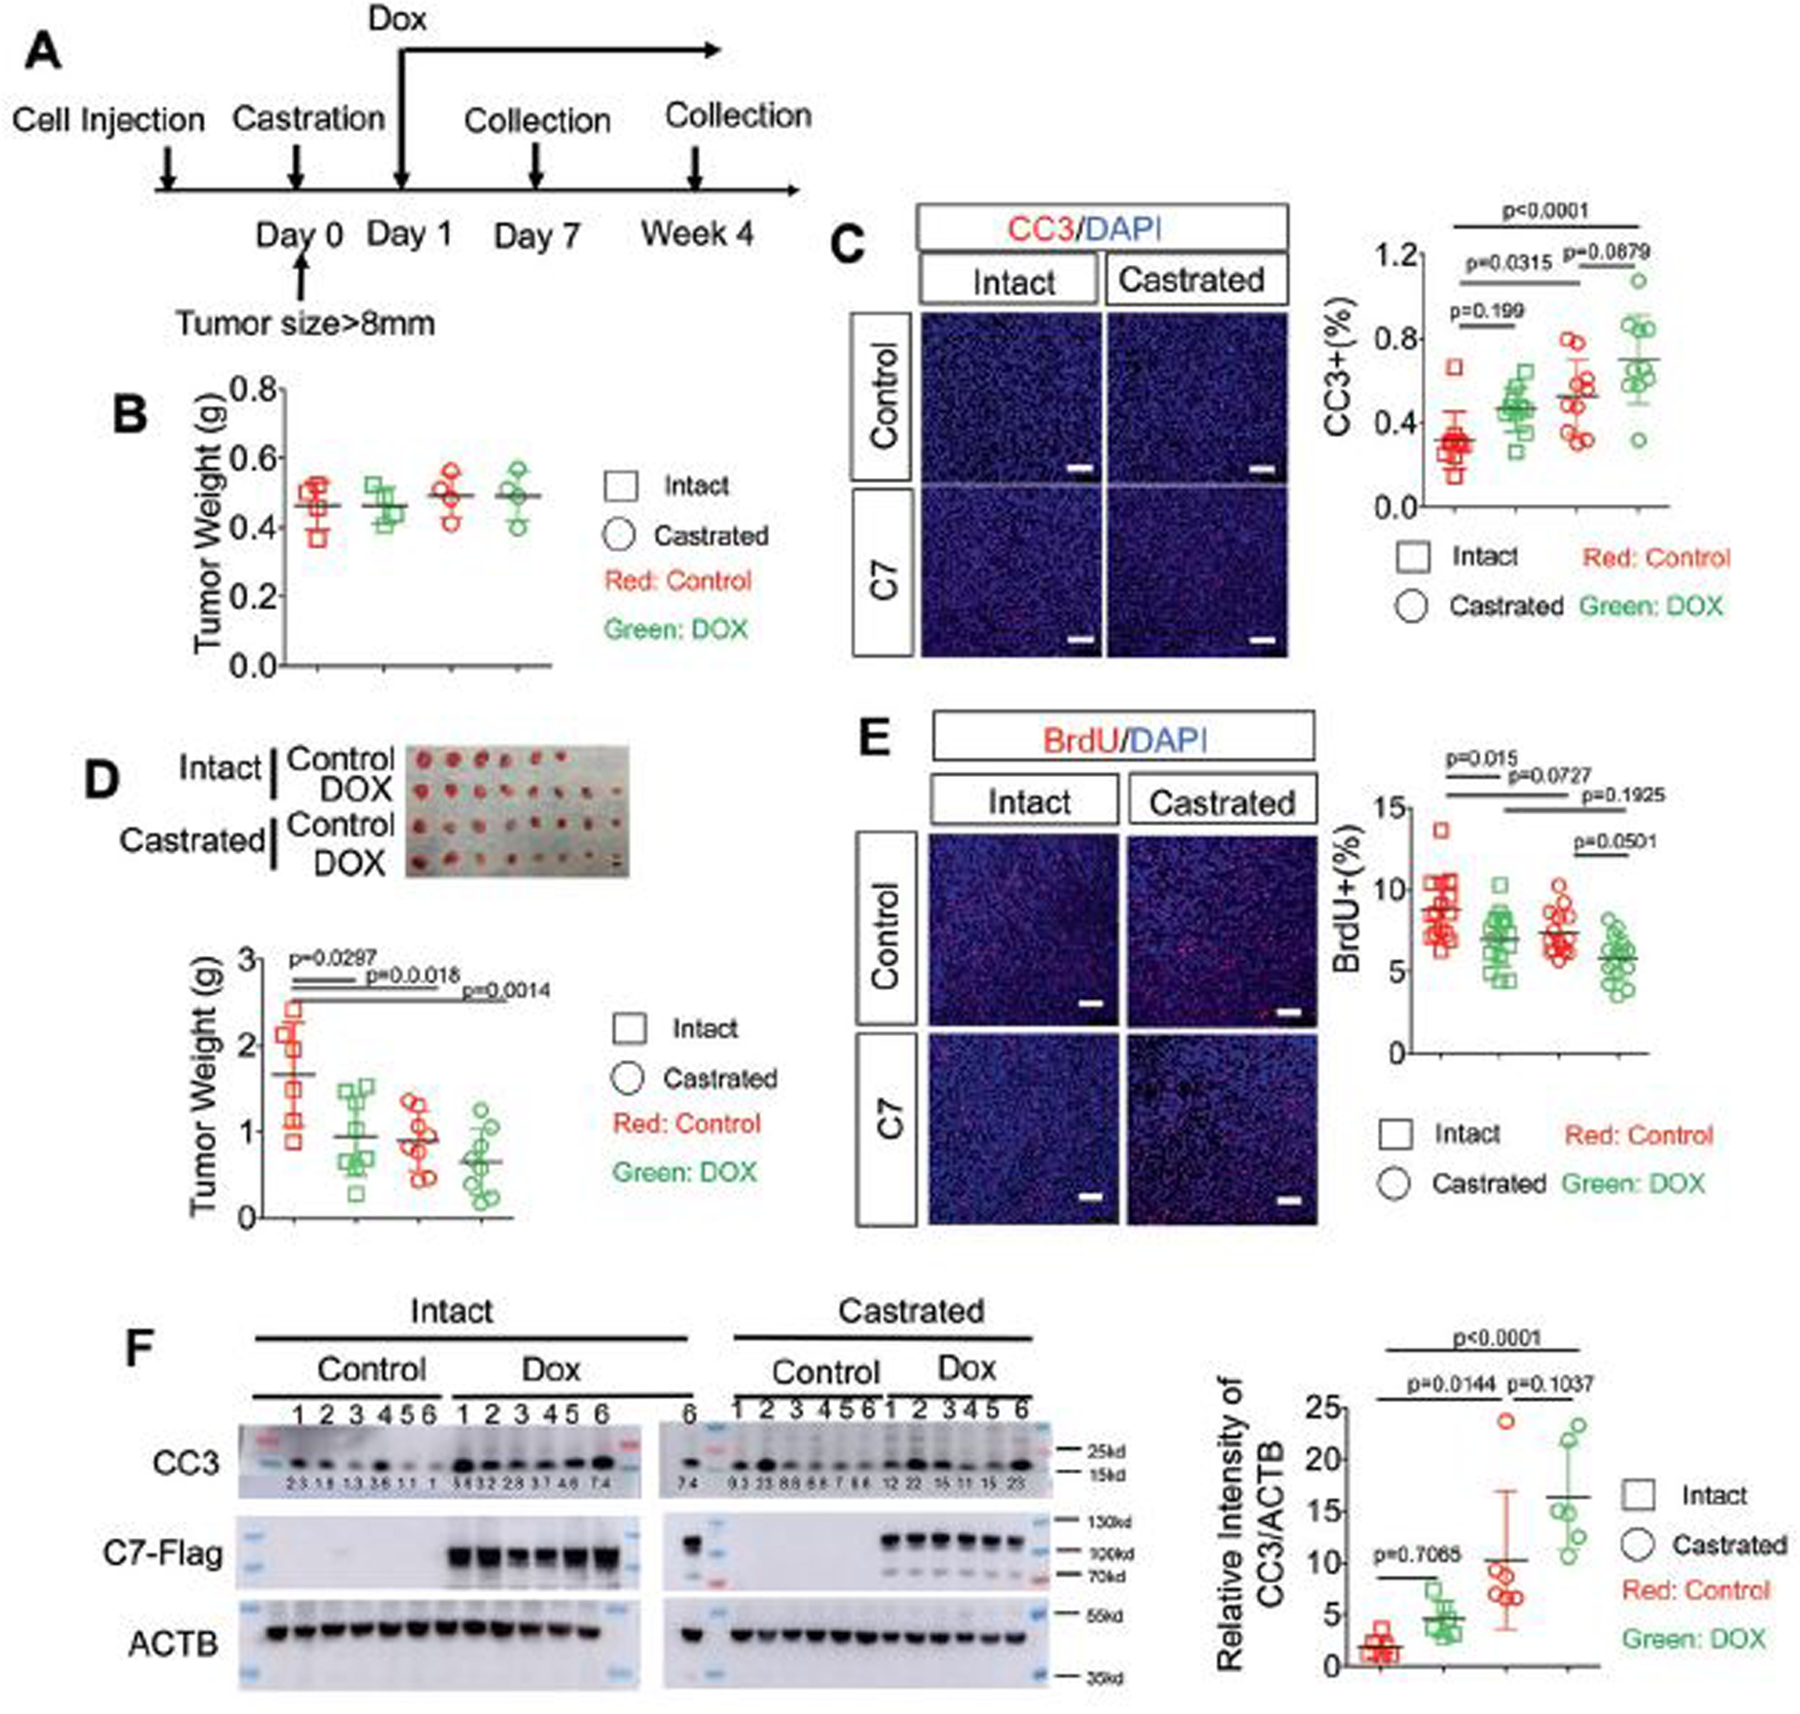
The complement system is a major component of the innate immune system that works through the cytolytic effect of the membrane attack complex (MAC). Complement component 7 (C7) is essential for MAC assembly and its precisely regulated expression level is crucial for the cytolytic activity of MAC. We show that C7 is specifically expressed by the stromal cells in both mouse and human prostates. The expression level of C7 inversely correlates with clinical outcomes in prostate cancer. C7 is positively regulated by androgen signaling in the mouse prostate stromal cells. The androgen receptor directly transcriptionally regulates the mouse and human C7. Increasing C7 expression in the C57Bl/6 syngeneic RM-1 and Pten-Kras allografts suppresses tumor growth in vivo. Conversely, C7 haploinsufficiency promotes tumor growth in the transgenic adenocarcinoma of the mouse prostate (TRAMP) model. Interestingly, replenishing C7 in androgen-sensitive Pten-Kras tumors during androgen depletion only slightly enhances cellular apoptosis, highlighting the diverse mechanisms employed by tumors to counteract complement activity. Collectively, our research indicates that augmenting complement activity could be a promising therapeutic approach to impede the development of castration resistance in prostate cancer.


Conflict of interest statement

COMPETING INTERESTS

The authors declare no competing interests.

Figures

Fig. 1
Fig. 1. C7 is expressed by stromal cells in mouse and human prostates.
A qRT-PCR of C7 in FACS-separated mouse prostate cell lineages. Dot plot shows ± s.d. from 4 experiments. B qRT-PCR analysis of C7 in FACS-isolated prostate stromal subpopulations. Dot plot shows ± s.d. from 3 experiments. C qRT-PCR analysis of C7 in FACS-isolated mouse proximal and distal prostate stromal cells. Data represent means ± s.d. from 4 independent experiments. D qRT-PCR analysis of C7 in FACS-isolated human prostate cell lineages. Data represent means ± s.d. from 4 independent experiments. E qRT-PCR analysis of human C7 in FACS-isolated stromal cells from human peripheral and transition prostate zones. Data represent means ± s.d. from 4 independent experiments.
Fig. 2
Fig. 2. Stromal C7 expression inversely correlates with prostate cancer progression.
A Box plots show C7 expression in prostate cancer specimens and normal tissues from two prostate datasets. B Box plot shows C7 expression in metastatic prostate cancer specimens and primary prostate cancer specimens in 2 prostate cancer datasets. C Box plots show that C7 expression correlations with Gleason scores in three human prostate cancer datasets. D Box plot shows a correlation of C7 expression with early metastasis after rising PSA in the Erho dataset. For parts (a–d), Boxplot P-values by heteroscedastic t-test. Box plots represent 5% (lower whisker), 25% (lower box), 50% (median), 75% (upper box), and 95% (upper whisker). E Kaplan-Meier plot for correlations of C7 expression with prostate cancer biochemical recurrence in the Glinsky dataset. Log-rank test: p = 0.04. Univariate Cox (treating C7 expression as a continuous variable): p = 0.02. F Expression of C7 in laser-captured stromal cells from prostate cancer of different Gleason patterns and adjacent benign tissues by qRT-PCR. Each dot in plot represents value calculated from one laser captured specimen. Data show values collected from 20 laser-captured samples from 13 prostate cancer specimens, analyzed by one-way ANOVA with Turkey’s multiple comparison test.
Fig. 3
Fig. 3. C7 is regulated by androgen receptor signaling.
A qRT-PCR analysis of C7 in FACS-isolated stromal cells from intact and castrated mice. Dot plot shows means ± s.d. from 3 intact and 2 castrated mice. B, C qRT-PCR analysis of C7 in embryonic urogenital sinus mesenchymal cells (B) and primarily cultured adult mouse prostate stromal cells (C) grown with fetal bovine sera, charcoal striped sera (CSS), and CSS supplemented with 10 nM dihydrotestosterone (DHT). Data represent means ± s.d. from 4 independent experiments. D qRT-PCR analysis of C7 in primarily adult mouse prostate stromal cells with or without ectopic AR expression. Data represents means ± s.d. from 4 independent experiments. E qRT-PCR analysis of C7 in FACS-isolated stromal cells from 12-wk-old C57Bl/6 wildtype (WT) and littermate Col1a2-CreERT2;ARFlox/Y (KO) mice at 1 month after treatment with tamoxifen. Each dot represents data from one mouse. N = 4 for WT and N = 8 for KO group. F Schematic illustration of experimental design for tissue slice culture. Bottom dot plot shows qRT-PCR analysis of C7 in benign tissues and prostate cancer specimens cultured with or without enzalutamide. Each dot represents data from one patient specimen. N = 6 for benign group and N = 5 for prostate cancer specimen. Luciferase assays determine activity of mouse (G) and human (H) C7 promoter reporter with and without mutations of all putative AR binding sites in control and AR-expressing mouse prostate stromal cells (G) and WPMY cells (H). Data represent means ± s.d. N = 3. TSS: transcription start site. I ChIP analysis of AR binding at C7 promoter in mouse prostate stromal cells. Dot plot shows means ± s.d. of relative enrichment from 3 independent experiments. Loci at Ch.5 and intergenic control serve as negative and Srd5a2 serves as positive control. J ChIP analysis of AR binding at C7 promoter in human WPMY-1 cells. Dot plot shows means ± s.d. of relative enrichment. GAPDH and COL1A1 serve as negative and positive controls, respectively. UD undetectable.
Fig. 4
Fig. 4. C7 suppresses prostate tumor growth in vivo.
A Image of subcutaneous RM-1 tumors with and without C7 overexpression. Dot plot shows means ± s.d. of tumor weight. N = 8 for control group and N = 10 for C7 overexpression group. Statistical analysis by Student’s t-test. Scale bar = 1 cm. Immunostaining of BrdU (B) and CC3 (C). Dot plots show means ± s.d. of BrdU+ and CC3+ cells. Individual dots represent results from 15 random images from 5 different tumors per group. Scale bars = 75 μm. D Image of subcutaneous Pten-Kras tumors with or without C7 overexpression. Dot plot shows means ± s.d. of tumor weight. N = 10 for each group. Statistical analysis by Student’s t-test. Scale bar = 1 cm. Immunostaining of BrdU (E) and CC3 (F). Dot plots show means ± s.d. of BrdU+ and CC3+ cells. Individual dots represent results from 15 random images from 5 different tumors per group. Scale bars = 75 μm. G Image of RM-1 tumors grown subcutaneously with control (Vector) and C7-expressing mouse prostate stromal cells. Dot plot shows means ± s.d. of tumor weight. Bar = 1 cm. N = 6 tumors per group. One-sided unpaired t-test. H Image of Pten-Kras tumors grown subcutaneously with control (Vector) and C7-expressing mouse prostate stromal cells. Dot plot shows means ± s.d. of tumor weight. Bar = 1 cm. N = 6 tumors per group. One-sided unpaired t-test. I Immunostaining of CC3 of RM1 tumors. Scale bar= 75μm. Dot plots show means ± s.d. of CC3+ cells. Individual dots represent data of 10 images from 5 tumors per group. J Immunostaining of CC3 of Pten-Kras tumors. Scale bar= 75μm. Dot plots show means ± s.d. of CC3+ cells. Individual dots represent data of 10 images from 5 tumors per group.
Fig. 5
Fig. 5. C7 haploinsufficiency promotes tumor growth in TRAMP model.
A Transillumination images of prostates of 22-wk-old control (TRAMP) and TRAMP;C7 +/− mice. Dot plot shows means ± s.d. of prostate weight. N = 12 for control and N = 11 for TRAMP;C7 +/− . Bars = 2 mm. B H&E staining of prostates of 22-wk-old control (TRAMP) and TRAMP;C7 +/− mice. Red scale bars = 250 μm, black scale bar =75 μm. Dot plot shows Berman-Booty scores of histology. Each dot represents a score calculated from one tissue slide from one mouse. Scores were collected from 7 control and 8 TRAMP;C7 +/−. Statistical analysis by unpaired t-test. C Coimmunostaining of luminal cell marker Keratin 8 (K8) and BrdU. Dot plots show means ± s.d. of BrdU+ cells from 10 tumors per group. D Western blot analysis of CC3 in prostate tumors. Dot plots show means ± s.d. of relative CC3 intensity normalized by internal control (ACTB) intensity from 6 tumors per group. Statistical analysis by Student’s t-test.
Fig. 6
Fig. 6. Restoring C7 expression enhances the response of Pten-Kras to androgen deprivation.
A Schematic illustration of experimental design. DOX: doxycycline. B Dot plot shows means ± s.d. of prostate tumor weight at day 7 after Dox treatment. C Immunostaining of CC3. Dot plots show means ± s.d. of CC3+ cells. Scale bars = 75 μm. D Image of Pten-Kras tumors at 4-weeks after Dox treatment. Dot plot shows means ± s.d. of tumor weight. Scale bar = 1 cm. E Immunostaining of BrdU. Dot plots show means ± s.d. of BrdU+ cells. Scale bars = 75 μm. F Western blot analysis of CC3 in xenograft tumor samples. N = 6 per group. Dot plots shows means ± s.d. of relative CC3 intensity normalized by β-Actin expression. Sample #6 in Dox group of intact mice was included in gel on the right to serve as a control to normalize densitometric intensity. All statistical analyses by two-way ANOVA with Turkey’s multiple comparison test.

Similar articles

Cited by

References

    1. Watson PA, Arora VK, Sawyers CL. Emerging mechanisms of resistance to androgen receptor inhibitors in prostate cancer. Nat Rev Cancer 2015;15:701–11. - PMC - PubMed
    1. Ricklin D, Reis ES, Lambris JD. Complement in disease: a defence system turning offensive. Nat Rev Nephrol 2016;12:383–401. - PMC - PubMed
    1. Revel M, Daugan MV, Sautes-Fridman C, Fridman WH, Roumenina LT. Complement system: promoter or suppressor of cancer progression? Antibodies 2020;9:57. - PMC - PubMed
    1. Rutkowski MJ, Sughrue ME, Kane AJ, Mills SA, Parsa AT. Cancer and the complement cascade. Mol Cancer Res 2010;8:1453–65. - PubMed
    1. Reis ES, Mastellos DC, Ricklin D, Mantovani A, Lambris JD. Complement in cancer: untangling an intricate relationship. Nat Rev Immun 2018;18:5–18. - PMC - PubMed

Publication types