. 2024 Jan;20(1):30-41.
doi: 10.1038/s41589-023-01368-5. Epub 2023 Jul 3.

Discovery of VH domains that allosterically inhibit ENPP1

Affiliations

Discovery of VH domains that allosterically inhibit ENPP1

Paige E Solomon et al. Nat Chem Biol. 2024 Jan.

Abstract

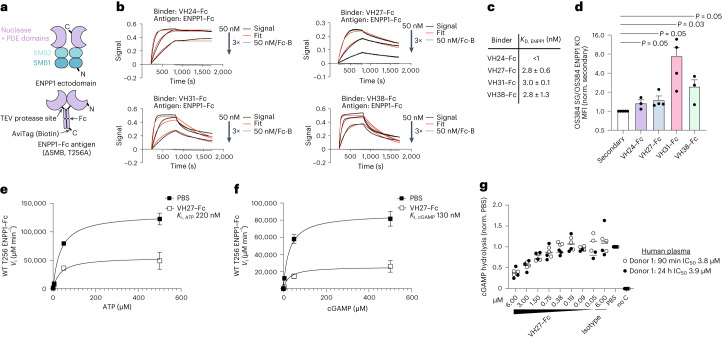
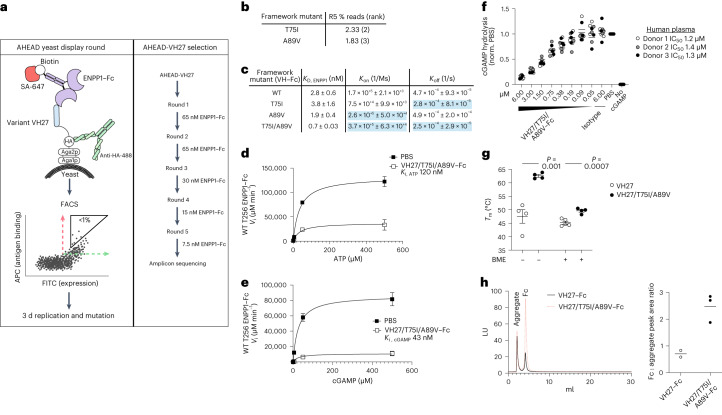
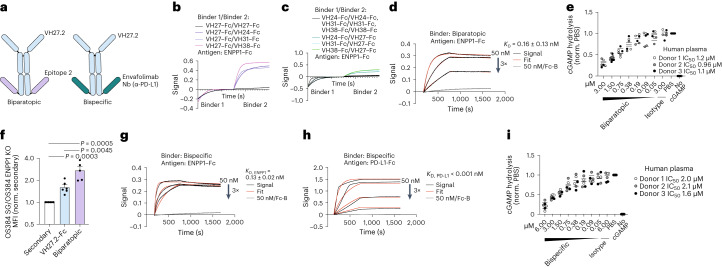
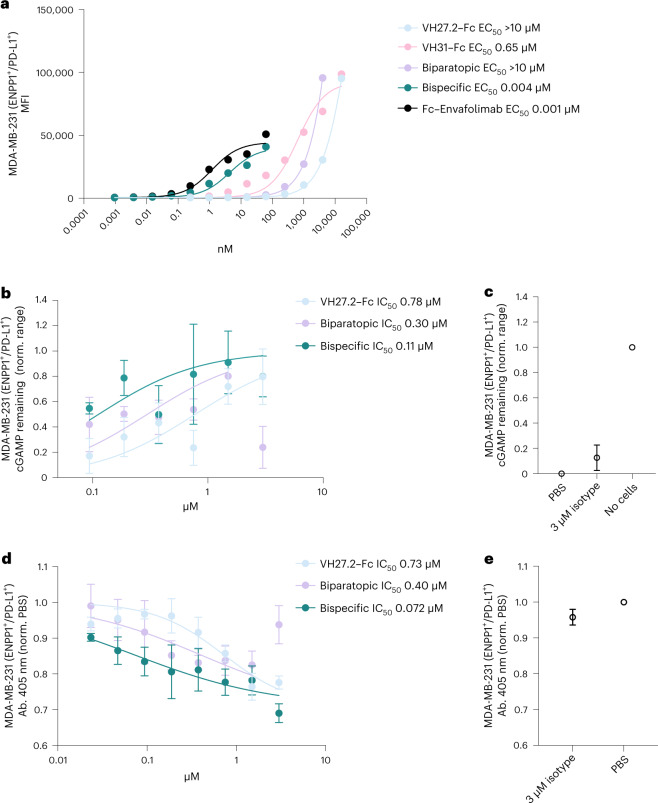
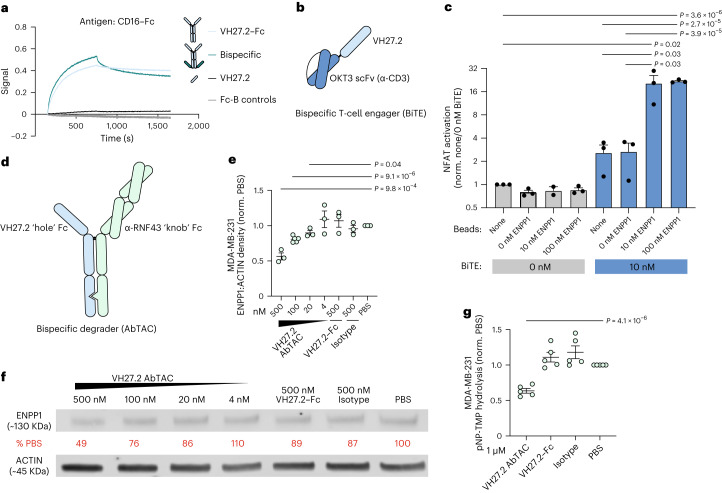
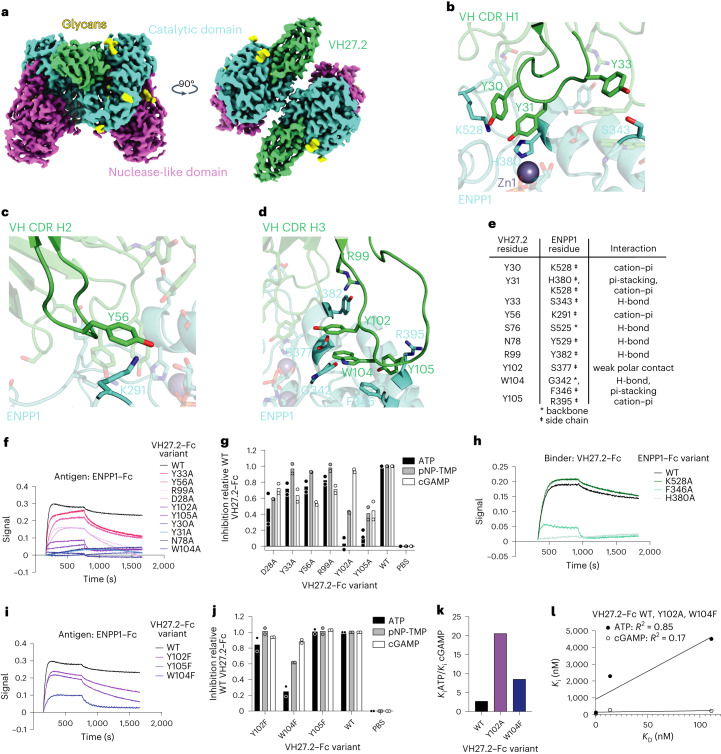
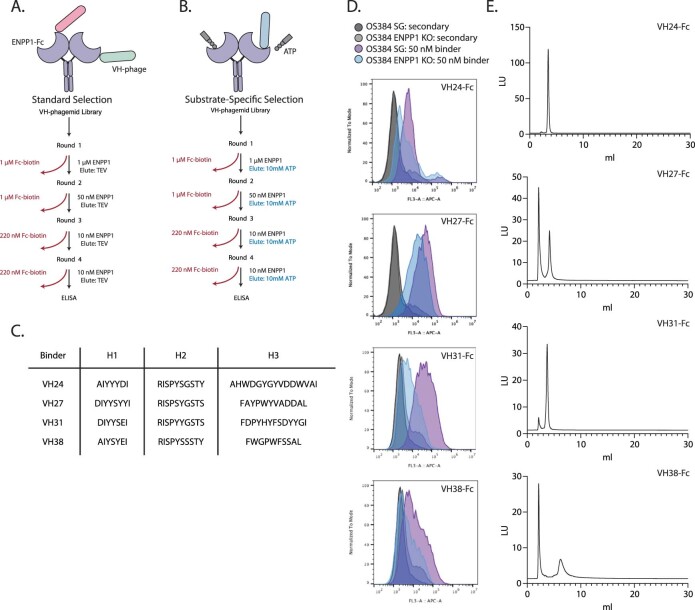
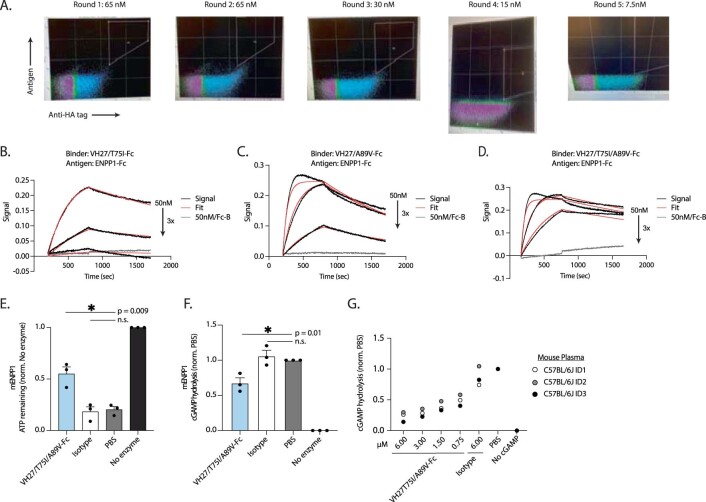
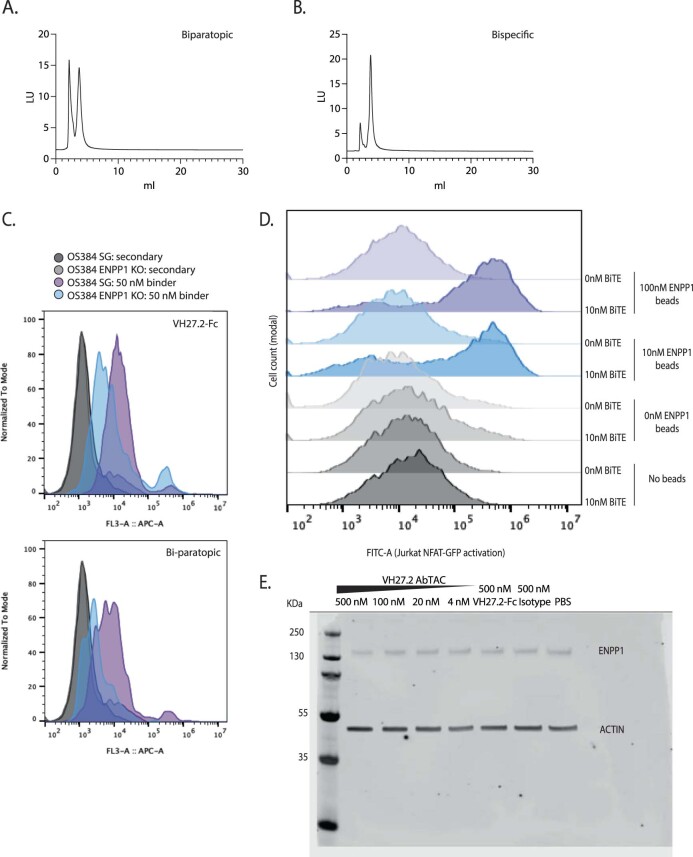
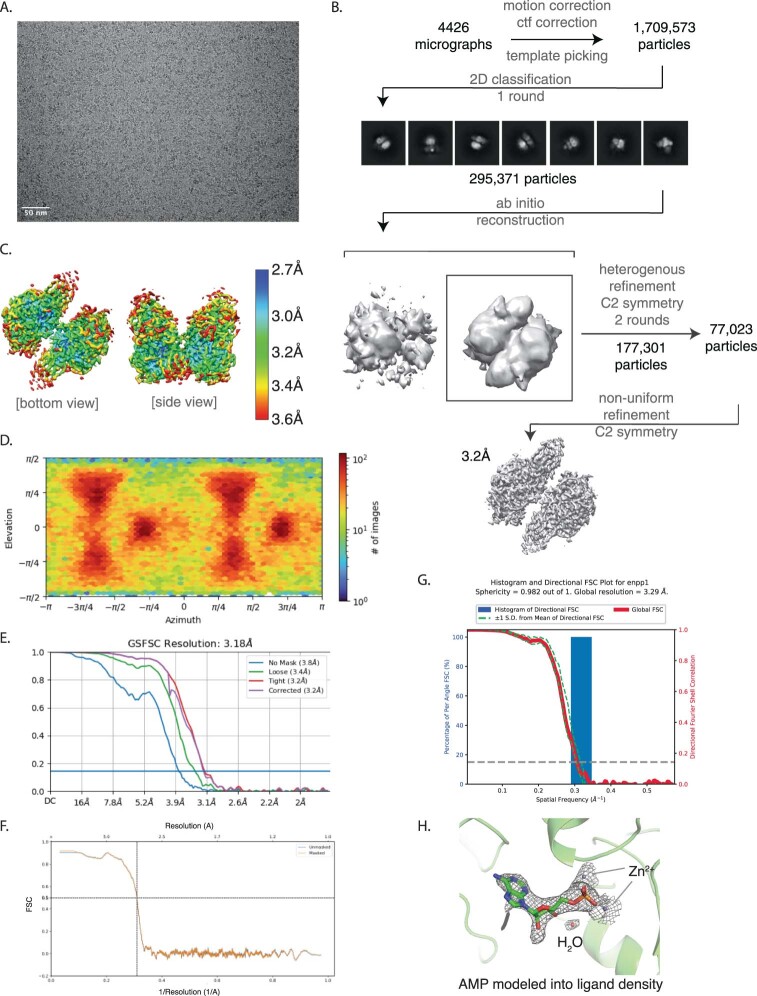
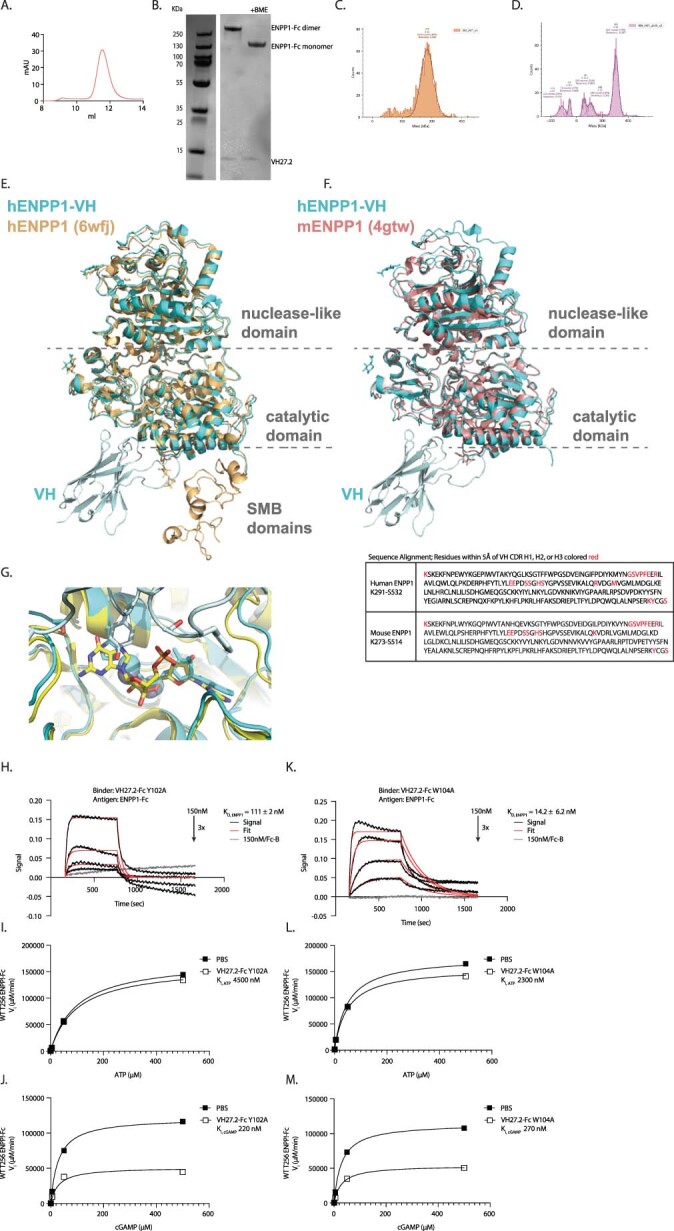
Ectodomain phosphatase/phosphodiesterase-1 (ENPP1) is overexpressed on cancer cells and functions as an innate immune checkpoint by hydrolyzing extracellular cyclic guanosine monophosphate adenosine monophosphate (cGAMP). Biologic inhibitors have not yet been reported and could have substantial therapeutic advantages over current small molecules because they can be recombinantly engineered into multifunctional formats and immunotherapies. Here we used phage and yeast display coupled with in cellulo evolution to generate variable heavy (VH) single-domain antibodies against ENPP1 and discovered a VH domain that allosterically inhibited the hydrolysis of cGAMP and adenosine triphosphate (ATP). We solved a 3.2 Å-resolution cryo-electron microscopy structure for the VH inhibitor complexed with ENPP1 that confirmed its new allosteric binding pose. Finally, we engineered the VH domain into multispecific formats and immunotherapies, including a bispecific fusion with an anti-PD-L1 checkpoint inhibitor that showed potent cellular activity.


Conflict of interest statement

P.E.S., J.A.W. and E.A.S.C. and the Reagents of the University of California have filed a provisional patent application related to this project.

Figures

Fig. 1
Fig. 1. Phage display generated high-affinity VH domains recognizing native ENPP1 on PDX-derived osteosarcoma cells, and VH27–Fc inhibited ATP and cGAMP hydrolysis.
a, Structure of extracellular domain of ENPP1 and recombinant ENPP1 C-terminal Fc-fusion antigen for phage display (ENPP1–Fc). b, Representative biolayer interferometry signals and fits for each VH–Fc binding ENPP1–Fc antigen or Fc-biotin control. c, Table of KD values (mean for n = 2). d, VH–Fc binding to PDX-derived OS384 cell line engineered with ENPP1 KO or SG. The bar graph reports mean and s.e.m. of the fold-change (SG/KO) in the median fluorescence intensity (n = 3 or 4 independent replicates). Statistics were calculated using a one-tailed Student’s t test. e,f, Michaelis–Menten kinetics were determined for VH27–Fc using ATP (e) or cGAMP (f) substrates (mean and s.d. for n = 3 independent replicates). g, Inhibition of secreted ENPP1 activity in ex vivo human plasma by VH27-Fc. Plasma was supplemented with 1 mM cGAMP and hydrolysis was assayed over 90 min and 24 h time courses. Fc isotype treatment and condition with no cGAMP added (no cGAMP) were included as controls (n = 3 for donor 1). Source data
Fig. 2
Fig. 2. Affinity maturation of VH27 improved affinity, inhibitory potency and stability.
a, Schema of AHEAD yeast-display selection rounds. b, Next-generation sequencing (NGS) read frequencies and ranks for T75I and A89V mutants. c, Association and dissociation rates and affinity constants for VH27–Fc, VH27/T75I–Fc, VH27/A89V–Fc and VH27/T75I/A89V–Fc binding to ENPP1–Fc antigen were determined by biolayer interferometry (mean and s.d. for n = 2 independent replicates). d,e, Michaelis–Menten enzyme kinetics for VH27/T75I/A89V–Fc using ATP (d) and cGAMP (e) substrates (mean and s.d. for n = 3 independent replicates). f. Inhibition of secreted ENPP1 activity in ex vivo human plasma by VH27/T75I/A89V-Fc (1 mM cGAMP, 90 min). Fc isotype treatment and condition with no cGAMP added (no cGAMP) were included as controls (n = 3 for each donor). g, Differential scanning fluorimetry was used to measure Tm of VH27 and VH27/T75I/A89V as single-domain VHs in nonreducing and reducing (6.25% BME) conditions. Bar graph reports mean and s.e.m. for n = 4 or 5 independent replicates, and statistics were calculated using two-tailed Student’s t test. h, VH27–Fc and VH27/T75I/A89V–Fc were analyzed by SEC, and peak area ratios between ‘aggregate peak’ and ‘Fc peak’ were analyzed. Bar graph reports the mean for n = 2 or 3 independent replicates. Source data
Fig. 3
Fig. 3. VH27.2 was formatted into biparatopic and bispecific constructs.
a, Structures of biparatopic and bispecific tetravalent Fc inhibitors. b,c, Biolayer interferometry mapping the epitopes of the VH panel with respect to the VH27 epitope when VH27–Fc was preloaded on the sensor (b), and when VH24–Fc, VH31–Fc or VH38–Fc was preloaded on the sensor (c). d, Representative biolayer interferometry signals and fits for biparatopic VH27.2/VH31 inhibitor binding ENPP1–Fc antigen or Fc-biotin control (mean and s.d. for n = 2 independent replicates). e, Inhibition of secreted ENPP1 activity in ex vivo human plasma by biparatopic molecule (1 mM cGAMP, 90 min). Fc isotype treatment and condition with no cGAMP added (no cGAMP) were included as controls (n = 2 independent replicates for each donor). f, Binding of VH27.2–Fc and biparatopic molecule to OS384 SG and ENPP1 KO cells. The bar graph reports mean and s.e.m. of the fold-change (SG/KO) in the median fluorescence intensity (n = 5 or 6 independent replicates). Statistics were calculated using a one-tailed Student’s t test. g,h, Representative biolayer interferometry signals and fits for bispecific inhibitor binding ENPP1–Fc antigen (g), PD-L1–Fc antigen (h) and Fc-biotin control (mean and s.d. for n = 2 independent replicates). i. Inhibition of secreted ENPP1 activity in ex vivo human plasma by bispecific molecule (1 mM cGAMP, 90 min). Fc isotype treatment and condition with no cGAMP added (no cGAMP) were included as controls (n = 2 independent replicates for each donor). Source data
Fig. 4
Fig. 4. Biparatopic and bispecific constructs improved localization on tumor cells and increased inhibition of ENPP1 on-cell membranes.
a, MDA-MB-231 cells were stained with a titration of VH27.2–Fc, VH31–Fc, biparatopic molecule, bispecific molecule or Fc–Envafolimab, and median fluorescence intensity values were used to fit EC50 curves (mean for n = 2 or 3 independent replicates). b, MDA-MB-231 cells were treated with cGAMP and the indicated concentration of VH27.2–Fc, biparatopic inhibitor or bispecific inhibitor. cGAMP remaining in the media was measured by cGAMP ELISA. c, Data were normalized to the range between the media treated without cells and cells treated with PBS. Fc isotype treated at 3 µM was also included as a control. d, MDA-MB-231 cells were treated with pNP-TMP, and the indicated concentration of VH27.2–Fc, biparatopic inhibitor or bispecific inhibitor and pNP-TMP hydrolysis was measured. e, Data were normalized to the PBS condition. Fc isotype treated at 3 µM was also included as a control. Data in b–e represent mean and s.e.m. for n = 3–5 biological replicates. Source data
Fig. 5
Fig. 5. VH27.2 was recombinantly engineered into immunotherapy scaffolds and next-generation protein degraders.
a, Representative biolayer interferometry signals for bivalent VH27.2–Fc, tetravalent bispecific Fc and single-domain VH27.2 (no Fc) binding to CD16–Fc antigen or Fc-biotin control (n = 2). b, Structure of bispecific T-cell engager (BiTE) combining VH27.2 with arm recognizing CD3 (OKT3 scFv). c, Jurkat cells expressing NFAT–GFP reporter were incubated with beads coated with Fc–ENPP1 or no bead control and were treated with 10 nM BiTE or PBS control. GFP expression driven by NFAT activation was measured by flow cytometry. Data were normalized to the no bead/no BiTE condition. Bar graph reports mean and s.e.m. for n = 3 independent replicates. Statistics were calculated using two-tailed Student’s t test. d, Structure of ‘knob-into-hole’ bispecific AbTAC degrader combining anti-ENPP1 VH with RNF43-recruiting IgG arm. e,f, MDA-MB-231 cells were treated with PBS or a titration of VH27.2 AbTAC, and ENPP1 levels were measured by immunoblot. Cells were additionally treated with 500 nM VH27.2–Fc and Fc isotype controls. ENPP1 densities were normalized to ACTIN loading control. The percent of ENPP1 remaining relative to the PBS treatment was calculated. e, Graph summarizes the mean and s.e.m. for n = 3–5 independent replicates. Statistics were calculated using two-tailed Student’s t test. f, A representative immunoblot for one experiment. g, MDA-MB-231 cells were pretreated with VH27.2 AbTAC, indicated control molecules or PBS for 24 h. After removing the molecules and washing the cells, pNP-TMP hydrolysis was measured. Data were normalized to PBS condition, and the graph represents mean and s.e.m. for n = 3 independent replicates with 1 or 2 technical replicates. Statistics were calculated using two-tailed Student’s t test. Source data
Fig. 6
Fig. 6. Cryo-EM reveals VH domain binding ENPP1 proximal to the catalytic site.
a, Cryo-EM 3D reconstruction of VH27.2 bound to ENPP1 ectodomain. b, View of the CDR H1 epitope. c, View of the CDR H2 epitope. d, View of the CDR H3 epitope. e, Table summarizing interactions between VH and ENPP1 residues. f, Biolayer interferometry comparing binding kinetics of VH27.2–Fc alanine variants. Traces are representative of n = 2 independent experiments. g, Inhibitory potencies of VH27.2–Fc alanine variants relative to WT VH27.2–Fc treated at 500 nM for ATP, pNP-TMP and cGAMP substrates. Bar graph reports the mean for n = 2 independent replicates. h, Biolayer interferometry comparing affinity of VH27.2–Fc to WT, K528A, F346A and H380A ENPP1–Fc. Traces are representative of n = 2 independent experiments. i, Biolayer interferometry comparing binding kinetics of VH27.2–Fc phenylalanine variants. Traces are representative of n = 2 independent experiments. j, Inhibitory potencies of VH27.2–Fc phenylalanine variants relative to WT VH27.2–Fc treated at 500 nM for ATP, pNP-TMP and cGAMP substrates. Bar graph reports mean for n = 2 independent replicates. k, ATP/cGAMP Ki fold-change value for WT, Y102A and W104F VH27.2–Fc. l, Linear regression and R2 values correlating KD and Ki values for ATP and cGAMP substrates for WT, Y102A and W104F VH27.2–Fc variants. Source data
Extended Data Fig. 1
Extended Data Fig. 1. Sequences, cellular binding, and stability of VH panel.
a, b. Schema of phage display selection and elution by TEV protease treatment (a) or 10 mM ATP treatment (b). c. CDR H1-3 sequences for VH panel. d. Representative flow cytometry histograms used to generate bar graph summarizing fold-changes for binding to OS384 SG and ENPP1 KO in Fig. 1d. e. SEC traces for VH24-Fc, VH27-Fc, VH31-Fc, and VH38-Fc.
Extended Data Fig. 2
Extended Data Fig. 2. AHEAD yeast display campaign to affinity mature VH27.
a. FACS gating used for sorting less than 1% AHEAD yeast cell population based on expression (HA-tag) and antigen binding. In round 4 the fluorophores were switched (SA-488 and anti-HA-647). b–d. Biolayer interferometry signals and fits to determine KD, kassociation, and kdissociation for VH27-Fc with scaffold mutations T75I (b), A89V (c), and T75I/A89V (d). Data are representative of two independent experiments. e, f. Mouse ENPP1 (mENPP1) was treated with 500 nM VH27/T75I/A89V-Fc, Fc isotype, or PBS to evaluate cross-reactivity using ATP (e) and cGAMP (f) substrates. Bar graphs reports mean and SEM for n = 3 independent replicates and statistics were calculated using two-tailed Student’s t test. g. Dose titration of VH27/T75I/A89V-Fc or indicated controls were tested for ENPP1 inhibition in C57BL/6J mouse plasma supplemented with 1 mM cGAMP for 90 min (n = 3 mice, 1 experiment per mouse). Source data
Extended Data Fig. 3
Extended Data Fig. 3. Additional data for multivalent constructs.
a,b. SEC traces for bi-paratopic inhibitor (a) and bispecific inhibitor (b). c. Representative flow cytometry histograms used to generate bar graph summarizing fold-changes for binding to OS384 SG and ENPP1 KO in Fig. 3f. d. Representative flow cytometry histograms for NFAT-GFP Jurkat activation assays when treated with indicated concentrations of ENPP1-coupled beads or no beads and 10 nM BiTE or PBS. e. Unformatted immunoblot with visible ladder used for image in Fig. 5f.
Extended Data Fig. 4
Extended Data Fig. 4. Additional data for cryo-EM data collection and processing.
a. Representative unprocessed micrograph. b. Single-particle cryo-EM image processing workflow. c. ENPP1-VH complex colored by local resolution. d. Orientation angle distribution of particles in the final reconstruction. e. Gold-standard FSC of the final non-uniform refinement. (resolution = 3.2 Å at gold-standard FSC = 0.143). f. FSC curves between the experimental map and model. g. Histogram and Directional FSC Plot from 3DFSC. h. Experimental density for ligand in ENPP1 active site (mesh) with AMP modeled in (green sticks) and two zinc atoms (gray spheres).
Extended Data Fig. 5
Extended Data Fig. 5. Additional data for structural and mechanistic analyses.
a–d. Validation of VH-ENPP1 complex. Complex was purified by SEC (a) and co-elution of VH and ENPP1-Fc was analyzed by SDS-PAGE gel (representative of n = 3 independent experiments) (b). Mass photometry of antigen alone (c) and SEC-eluted complex peak (d) demonstrated mass shift of approximately 30 KDa suggesting 2:1 VH:antigen stoichiometry. e. Cryo-EM structure of VH-ENPP1 complex aligned to PDB 6wjf. f. Cryo-EM structure of VH-ENPP1 complex aligned to PDB 4gtw with sequence alignment of human and mouse ENPP1. Residues colored red were within 5Å of VH CDR H1, H2, or H3. g. Close-up of clashing with pApG when VH-ENPP1 complex (cyan) is aligned to PDB 6aek (yellow). h. Representative biolayer interferometry signals and fits for VH27.2-Fc Y102A (n = 2 independent replicates). i, j. Michaelis-Menten kinetic analysis for VH27.2-Fc Y102A for ATP (i) and cGAMP (j) (mean for n = 2 independent replicates). k. Representative biolayer interferometry signals and fits for VH27.2-Fc W104A (n = 2 independent replicates). l, m. Michaelis-Menten kinetic analysis for VH27.2-Fc W104A for ATP (l) and cGAMP (m) (mean for n = 2 independent replicates). Source data

Similar articles

Cited by

References

    1. Carozza JA, et al. Extracellular cGAMP is a cancer-cell-produced immunotransmitter involved in radiation-induced anticancer immunity. Nat. Cancer. 2020;1:184–196. doi: 10.1038/s43018-020-0028-4. - DOI - PMC - PubMed
    1. Carozza JA, et al. Structure-aided development of small-molecule inhibitors of ENPP1, the extracellular phosphodiesterase of the immunotransmitter cGAMP. Cell Chem. Biol. 2020;27:1347–1358. doi: 10.1016/j.chembiol.2020.07.007. - DOI - PMC - PubMed
    1. Carozza JA, et al. ENPP1’s regulation of extracellular cGAMP is a ubiquitous mechanism of attenuating STING signaling. Proc. Natl Acad. Sci. USA. 2022;119:e2119189119. doi: 10.1073/pnas.2119189119. - DOI - PMC - PubMed
    1. Li J, et al. Metastasis and immune evasion from extracellular cGAMP hydrolysis. Cancer Discov. 2021;11:1212–1227. doi: 10.1158/2159-8290.CD-20-0387. - DOI - PMC - PubMed
    1. Lau WM, et al. Enpp1: a potential facilitator of breast cancer bone metastasis. PLoS ONE. 2013;8:e66752. doi: 10.1371/journal.pone.0066752. - DOI - PMC - PubMed

Publication types

MeSH terms

Substances