. 2023 Oct;149(13):11517-11530.
doi: 10.1007/s00432-023-04947-0. Epub 2023 Jul 3.

Integrative analysis of lactylation-related genes and establishment of a novel prognostic signature for hepatocellular carcinoma

Affiliations

Integrative analysis of lactylation-related genes and establishment of a novel prognostic signature for hepatocellular carcinoma

Diankui Cai et al. J Cancer Res Clin Oncol. 2023 Oct.

Abstract

Background: Lactylation has been found to involve in regulating many types of biological process in cancers. However, research on lactylation-related genes in predicting the prognosis of hepatocellular carcinoma (HCC) remains limited.

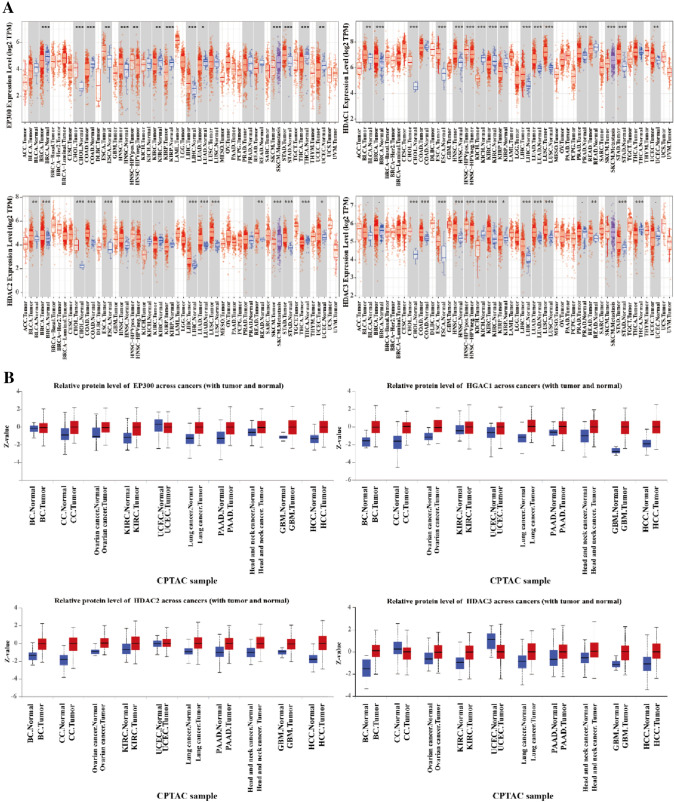
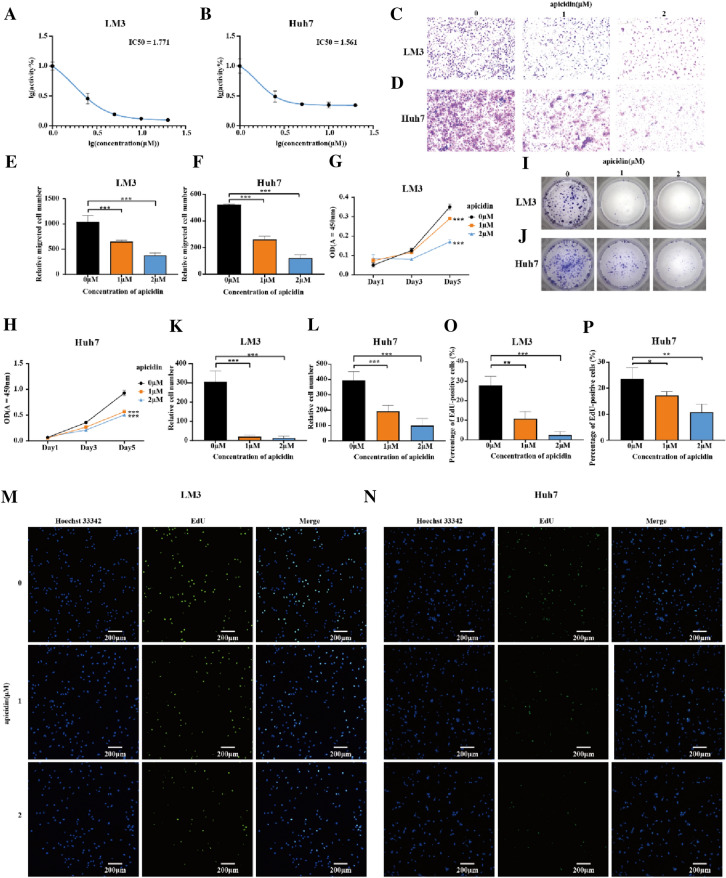
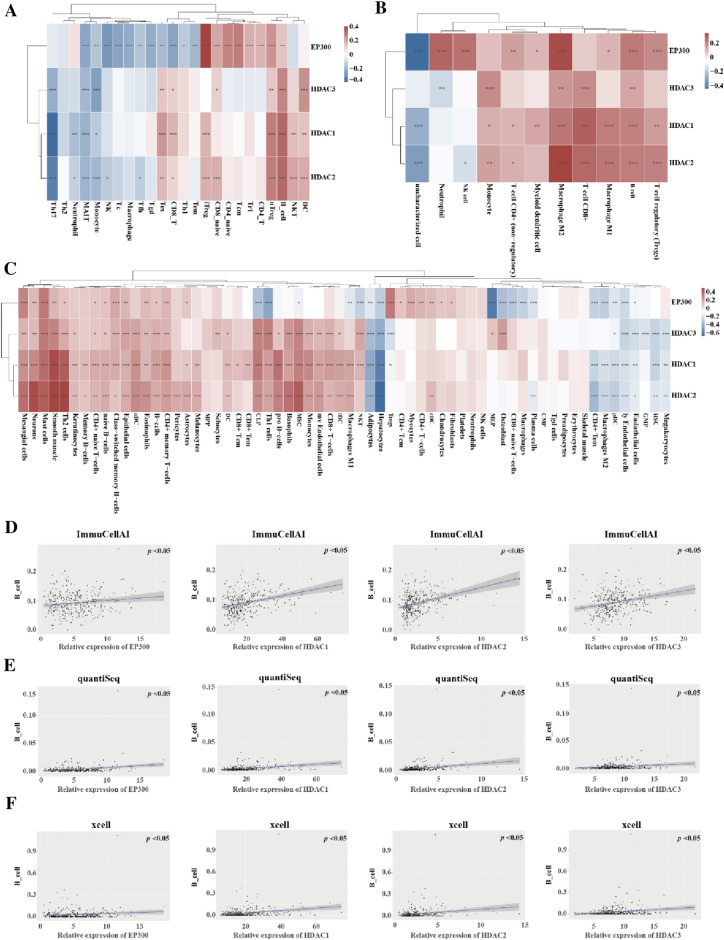
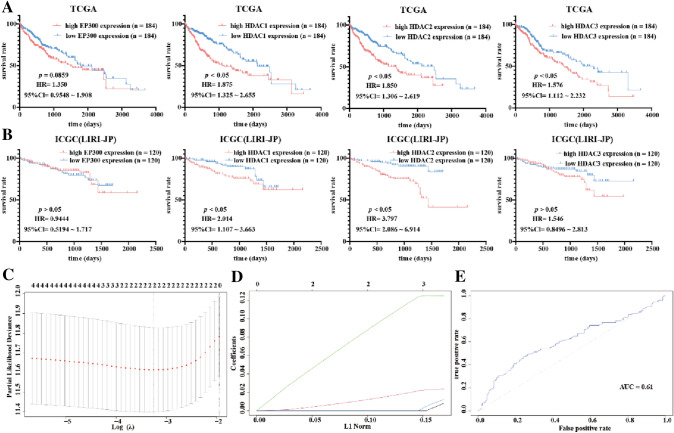
Methods: The differential expression of lactylation-related genes (EP300 and HDAC1-3) in pan-cancer were examined in public databases. HCC patient tissues were obtained for mRNA expression and lactylation level detection by RT-qPCR and western blotting. Transwell migration assay, CCK-8 assay, EDU staining assay and RNA-seq were performed to verify the potential function and mechanisms in HCC cell lines after lactylation inhibitor apicidin treatment. lmmuCellAI, quantiSeq, xCell, TIMER and CIBERSOR were used to analyze the correlation between transcription levels of lactylation-related genes and immune cell infiltration in HCC. Risk model of lactylation-related genes was constructed by LASSO regression analysis, and prediction effect of the model was evaluated.

Result: The mRNA levels of lactylation-related genes and lactylation levels were higher in HCC tissues than normal samples. The lactylation levels, cell migration, and proliferation ability of HCC cell lines were suppressed after apicidin treatment. The dysregulation of EP300 and HDAC1-3 was associated with proportion of immune cell infiltration, especially B cell. Upregulation of HDAC1 and HDAC2 was closely associated with poorer prognosis. Finally, a novel risk model, based on HDAC1 and HDAC2, was developed for prognosis prediction in HCC.

Conclusion: HDAC1 and HDAC2 are expected to become new biomarkers for HCC. Risk scoring model based on HDAC1 and HDAC2 can be used to predict the prognosis of HCC patients.

Keywords: Hepatocellular carcinoma; Immune; Lactylation; Prognosis.


Conflict of interest statement

The authors have not disclosed any competing interests.

Figures

Fig. 1
Fig. 1
mRNA and protein levels of EP300 and HDAC1–3 present in pan-cancer tissues. A mRNA levels of EP300 and HDAC1–3 present in pan-cancer tissues from the TCGA database. B Protein levels of EP300 and HDAC1–3 present in pan-cancer tissues from the CPTAC database. ACC Adrenocortical carcinoma, BLCA Bladder urothelial carcinoma, BC Breast cancer, BRCA Breast invasive carcinoma, CC Colon cancer, CESC Cervical and endocervical cancers, CHOL Cholangiocarcinoma, COAD Colon adenocarcinoma, DLBC Diffuse large B-cell lymphoma, ESCA Esophageal carcinoma, GBM Glioblastoma multiforme, HNSC Head and Neck squamous cell carcinoma, KICH Kidney Chromophobe, KIRC Kidney renal clear cell carcinoma, KIRP Kidney renal papillary cell carcinoma, LAML Acute myeloid leukemia, LGG Brain lower grade glioma, LIHC Liver hepatocellular carcinoma, LUAD Lung adenocarcinoma, LUSC Lung squamous cell carcinoma, MESO Mesothelioma, OV Ovarian serous cystadenocarcinoma, PAAD Pancreatic adenocarcinoma, PCPG Pheochromocytoma and Paraganglioma, PRAD Prostate adenocarcinoma, READ Rectum adenocarcinoma, SARC Sarcoma, SKCM Skin cutaneous melanoma, STAD Stomach adenocarcinoma, TGCT Testicular germ cell tumors, THCA Thyroid carcinoma, THYM Thymoma, UCEC Uterine corpus endometrial carcinoma, UCS Uterine carcinosarcoma, UVM Uveal melanoma, RCC renal cell carcinoma. The data are expressed as the mean ± SD. *p < 0.05; **p < 0.01; ***p < 0.001
Fig. 2
Fig. 2
The expression levels of EP300 and HDAC1–3 present in patients with HCC. The mRNA expression of EP300 and HDAC1–3 in HCC patients from TCGA (A), ICGC (B) and GEO (C, D) databases. The mRNA expression of EP300 and HDAC1–3 in paired samples of HCC patients from TCGA (E), ICGC (F) and GEO (G) databases. H Protein content of EP300 and HDAC1–3 in HCC patients from CPTAC. The data are expressed as the mean ± SD
Fig. 3
Fig. 3
The mRNA levels of lactylation-related genes and lactylation levels in HCC and para-carcinoma tissues. A The mRNA levels of HDAC1–3 in HCC tissues and paired para-carcinoma tissues; B western blotting showed protein levels of lactylation in HCC tissues and paired para-carcinoma tissues. NL normal liver, HCC hepatocellular carcinoma. The data are expressed as the mean ± SD
Fig. 4
Fig. 4
Effect of lactylation on cell migration and proliferation in HCC. IC50 of apicidin in LM3 (A) and Huh7 (B). A transwell assay showed the cell migration ability of LM3 (C) and Huh7 (D) treated by 0, 1, or 2 µM of apicidin for 48 h; correlative statistical results data of the results in LM3 (E) and Huh7 (F). A CCK-8 assay showed the cell proliferation ability of LM3 (G) and Huh7 (H) cultured by 0, 1, or 2 µM of apicidin for 48 h. A colony formation assay showed the cell proliferation ability of LM3 (I) and Huh7 (J) cultured by 0, 1, or 2 µM of apicidin for 48 h; correlative statistical results data of the results in LM3 (K) and Huh7 (L). An EdU assay showed the cell proliferation ability of LM3 (M) and Huh7 (N) cultured by 0, 1, or 2 µM of apicidin for 48 h; correlative statistical results data of the results in LM3 (O) and Huh7 (P). The data are expressed as the mean ± SD. *p < 0.05; **p < 0.01; ***p < 0.001
Fig. 5
Fig. 5
Pathway analysis of lactylation in two HCC cell lines. A A Venn diagram showed a total of 919 differentially expressed genes with |log2 (experimental group /control group) |≥ 1 and Q value < 0.05, shared between LM3 and Huh7 after using apicidin. A volcano plot showed upregulated genes, downregulated genes, and unchanged genes in LM3 (B) and Huh7 (C) after using apicidin. GSEA enrichment analysis showed different function pathways in LM3 (D) and Huh7 (E) after using apicidin. The data are expressed as the mean ± SD
Fig. 6
Fig. 6
Correlation between mRNA levels of lactylation-related genes and immune cell infiltration in HCC patients. A Relationship between mRNA levels of EP300, HDAC1–3, and immune cell abundance in ImmuCellAI. B Relationship between mRNA levels of EP300, HDAC1–3, and immune cell abundance in quantiSeq. C Relationship between mRNA levels of EP300, HDAC1–3, and immune cell abundance in xCell algorithm. Correlation between mRNA levels of EP300, HDAC1–3, and B-cell infiltration in ImmuCellAI (D), quantiSeq (E) and xcell (F). The data are expressed as the mean ± SD. *p < 0.05; **p < 0.01; ***p < 0.001
Fig. 7
Fig. 7
Survival analysis and risk model of lactylation-related genes in HCC. A, B Survival Analysis of EP300 and HDAC1–3 in HCC patients. C, D The selection of EP300 and HDAC1–3 for risk model by LASSO analysis in HCC patients. E ROC curve of OS in HCC patients. The data are expressed as the mean ± SD
Fig. 8
Fig. 8
Construction and validation of hepatocellular carcinoma risk model. The risk score distribution in different risk groups, OS statuses, and mRNA level of lactylation-related genes in HCC patients in training set (A) and validating set (B). Relationship between risk score and OS statuses in HCC patients in training set (C) and validating set (D). Survival analysis of high-risk group and low-risk group in HCC patients in training set (E) and validating set (F). Column diagram predicting OS in HCC patients (G). Calibration curves predicting 1-year, 3-year, and 5-year overall survival in the training set (H)

References

    1. Aran D, Hu Z, Butte AJ (2017) xCell: digitally portraying the tissue cellular heterogeneity landscape. Genome Biol 18(1):220 - PMC - PubMed
    1. Barneda-Zahonero B, Parra M (2012) Histone deacetylases and cancer. Mol Oncol 6(6):579–589 - PMC - PubMed
    1. Buurman R, Gurlevik E, Schaffer V, Eilers M, Sandbothe M, Kreipe H, Wilkens L, Schlegelberger B, Kuhnel F, Skawran B (2012) Histone deacetylases activate hepatocyte growth factor signaling by repressing microRNA-449 in hepatocellular carcinoma cells. Gastroenterology 143(3):811-820.e815 - PubMed
    1. Chandrashekar DS, Karthikeyan SK, Korla PK, Patel H, Shovon AR, Athar M, Netto GJ, Qin ZS, Kumar S, Manne U et al (2022) UALCAN: an update to the integrated cancer data analysis platform. Neoplasia 25:18–27 - PMC - PubMed
    1. Chen B, Khodadoust MS, Liu CL, Newman AM, Alizadeh AA (2018) Profiling tumor infiltrating immune cells with CIBERSORT. Methods Mol Biol 1711:243–259 - PMC - PubMed

LinkOut - more resources