. 2023 Jul;55(7):1210-1220.
doi: 10.1038/s41588-023-01434-7. Epub 2023 Jul 3.

Potent and uniform fetal hemoglobin induction via base editing

Affiliations

Potent and uniform fetal hemoglobin induction via base editing

Thiyagaraj Mayuranathan et al. Nat Genet. 2023 Jul.

Abstract

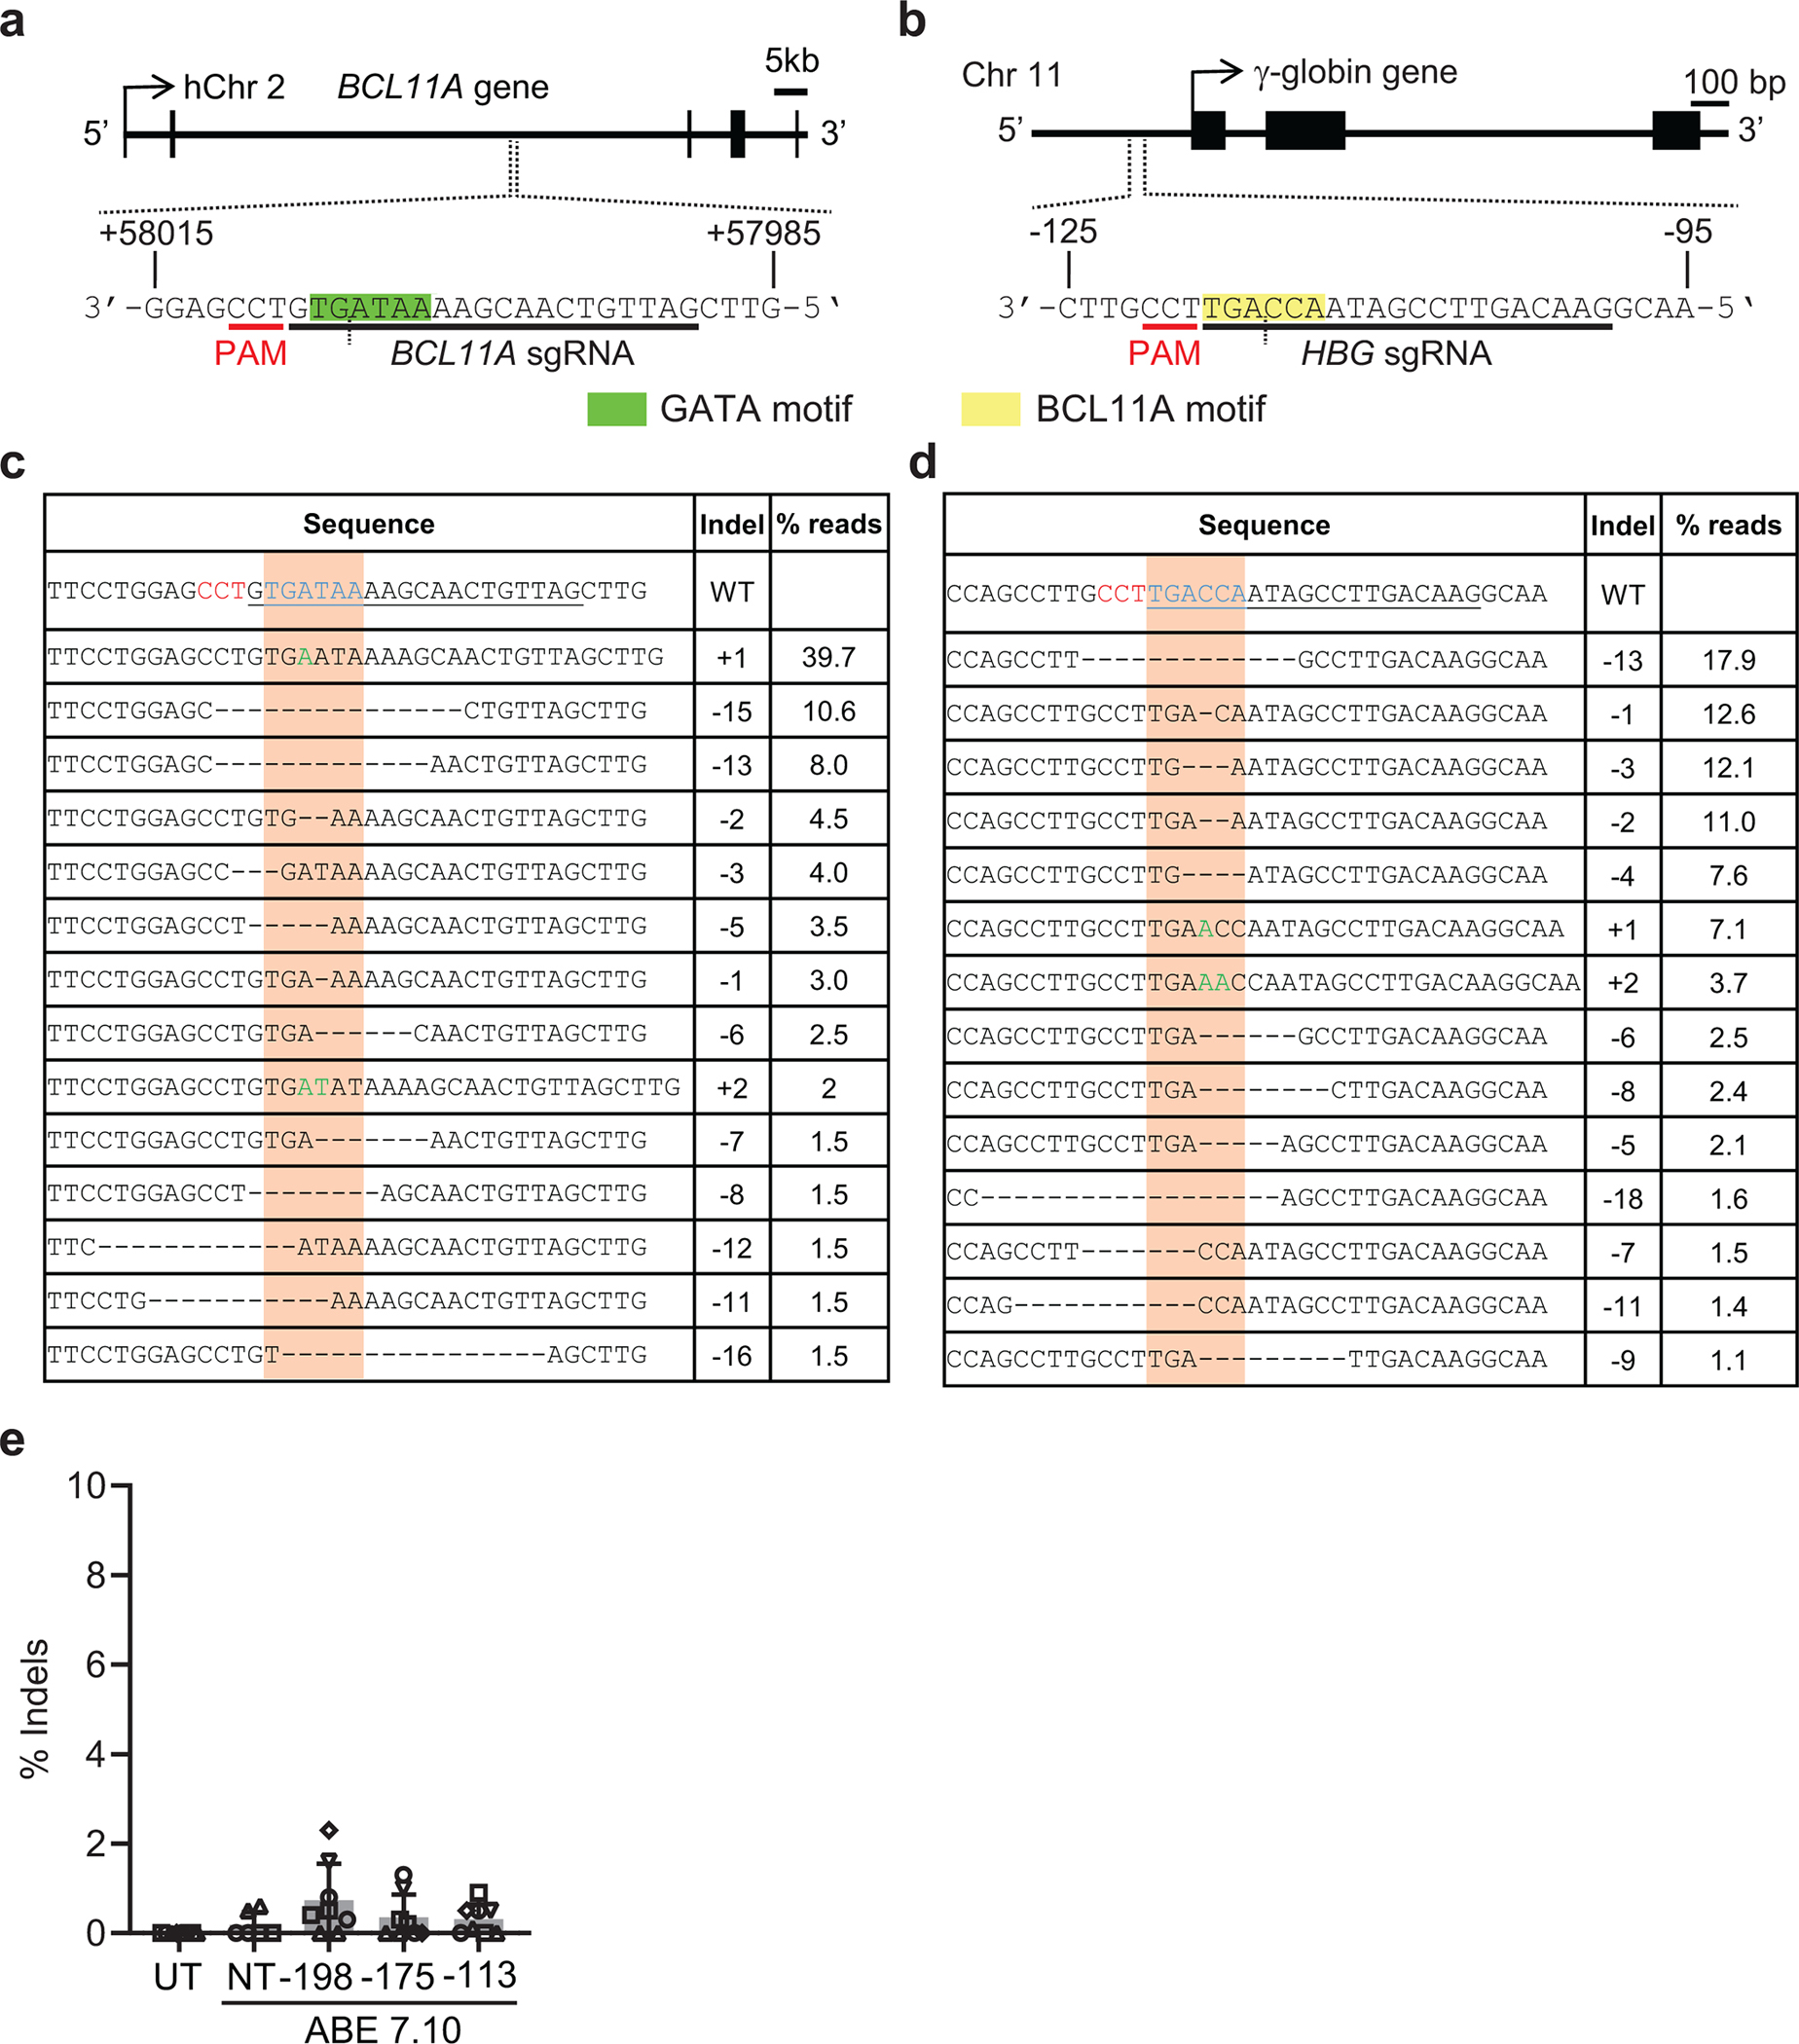
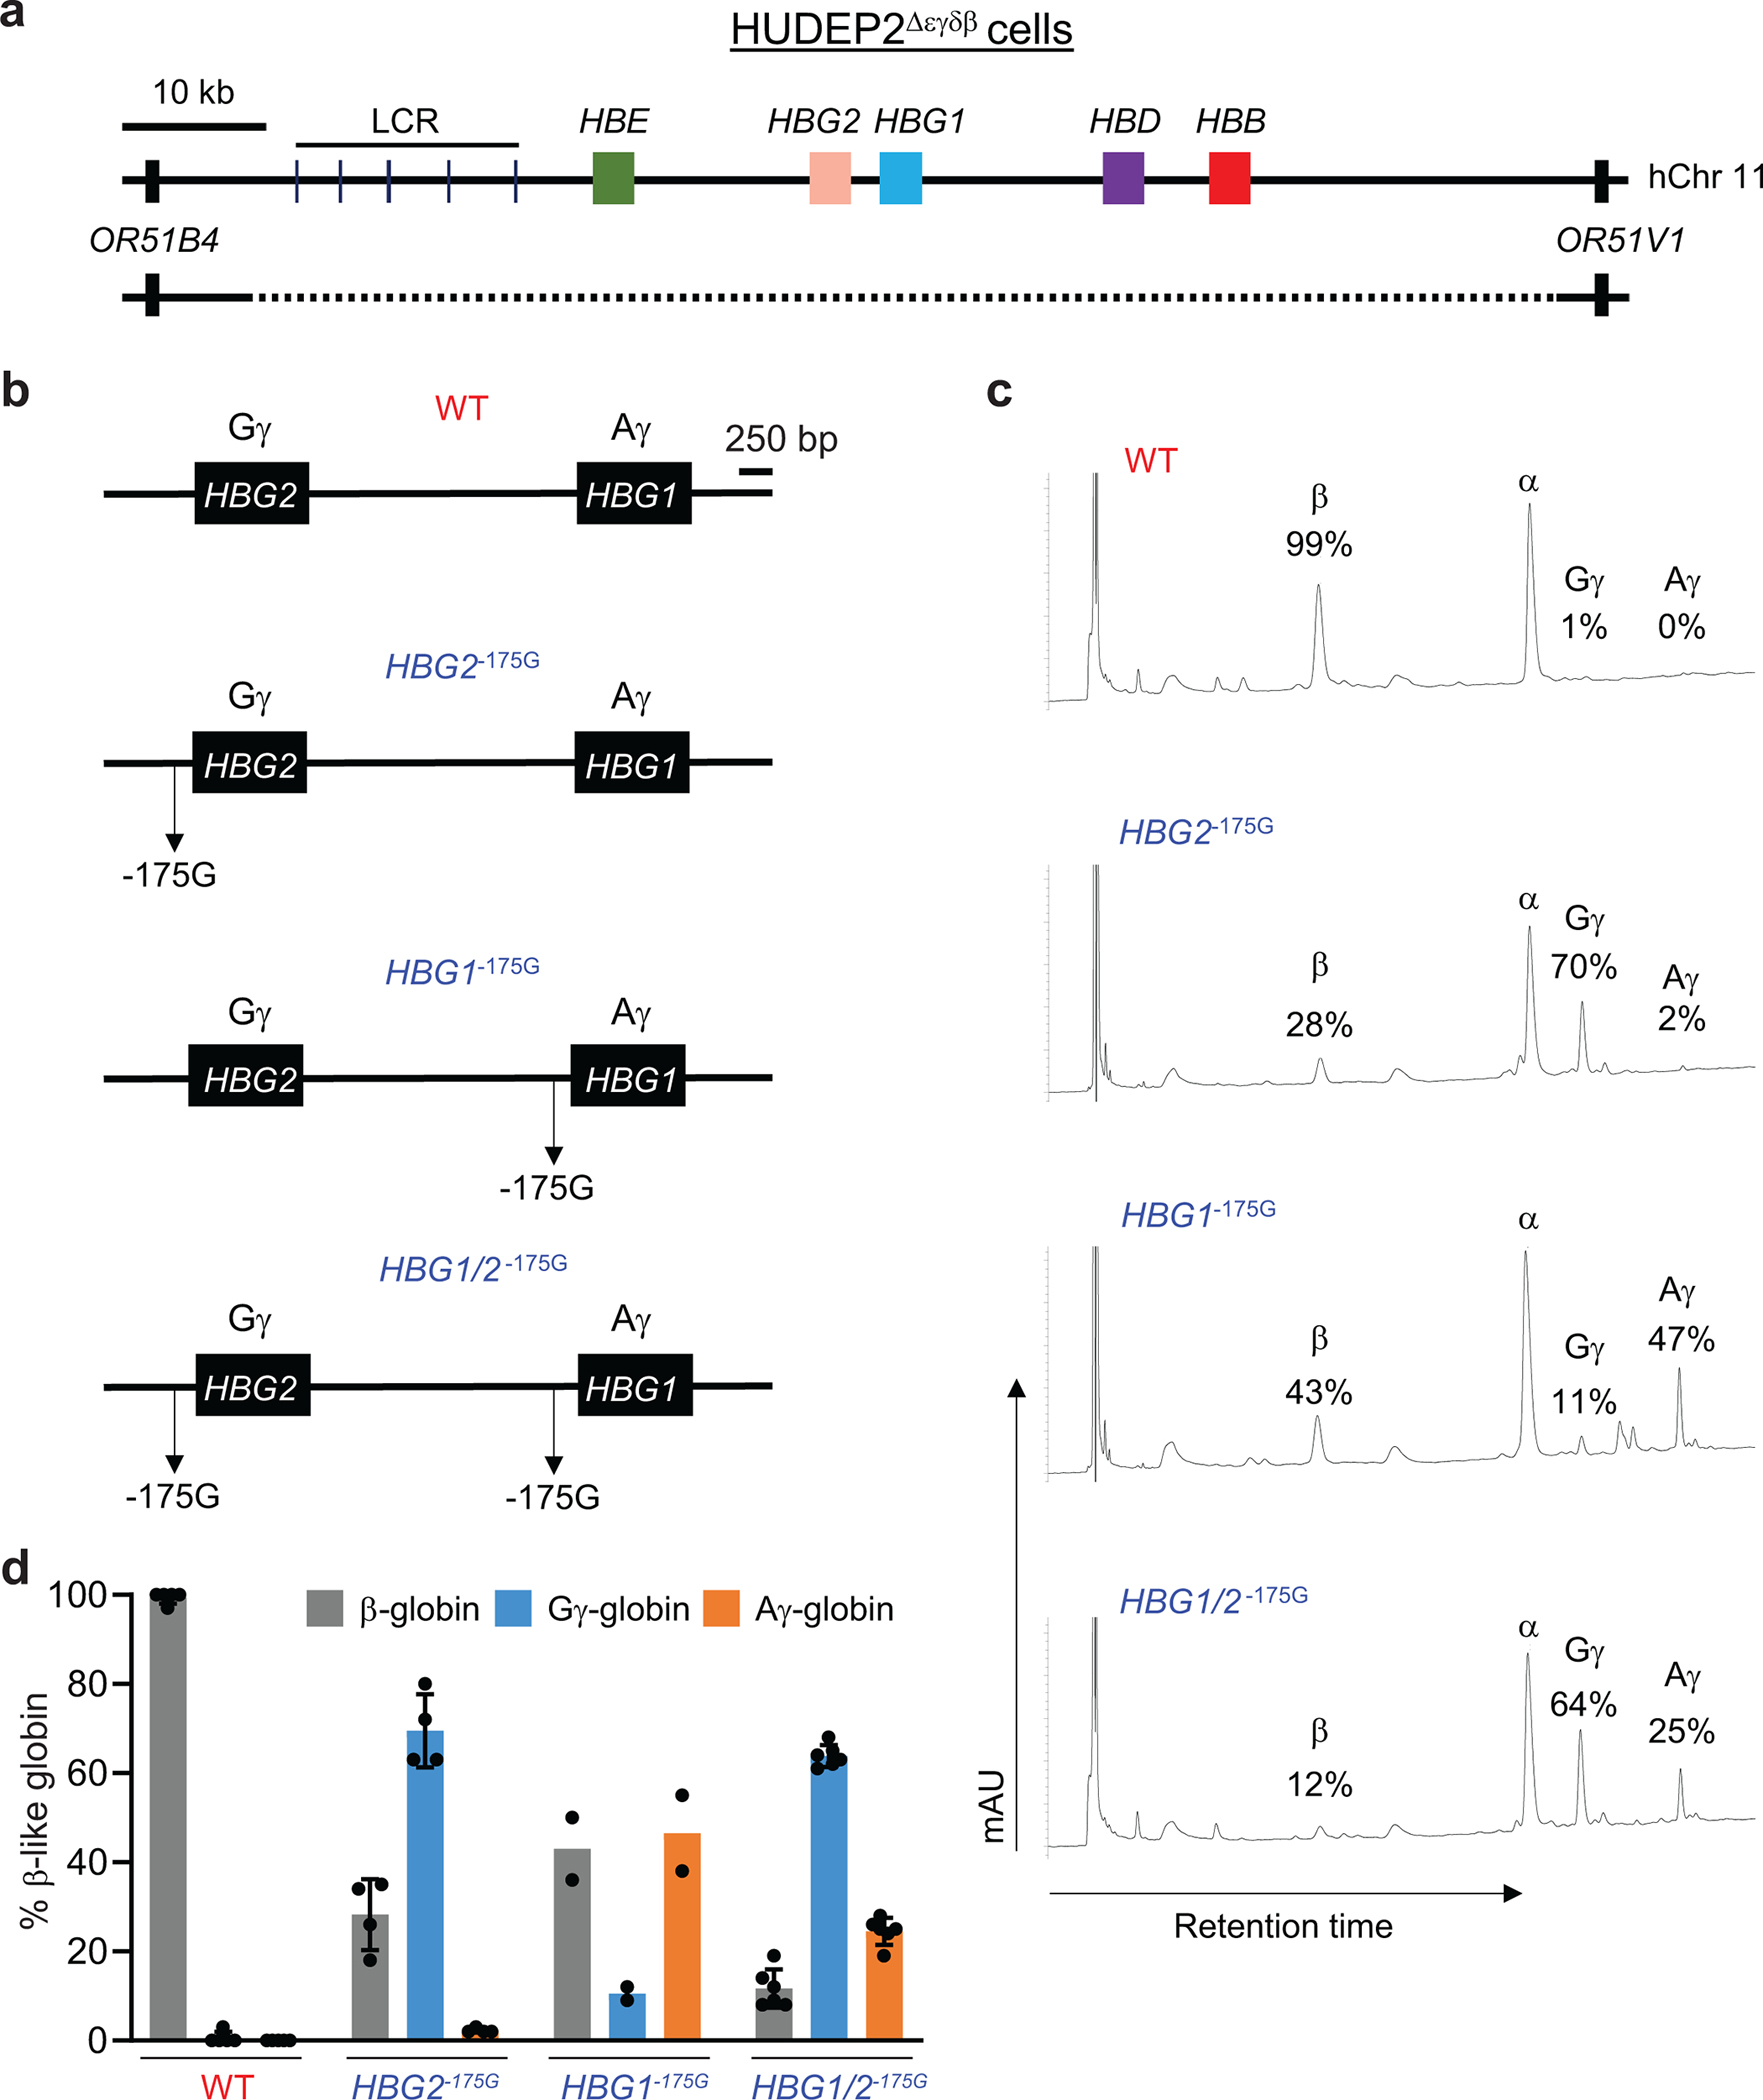
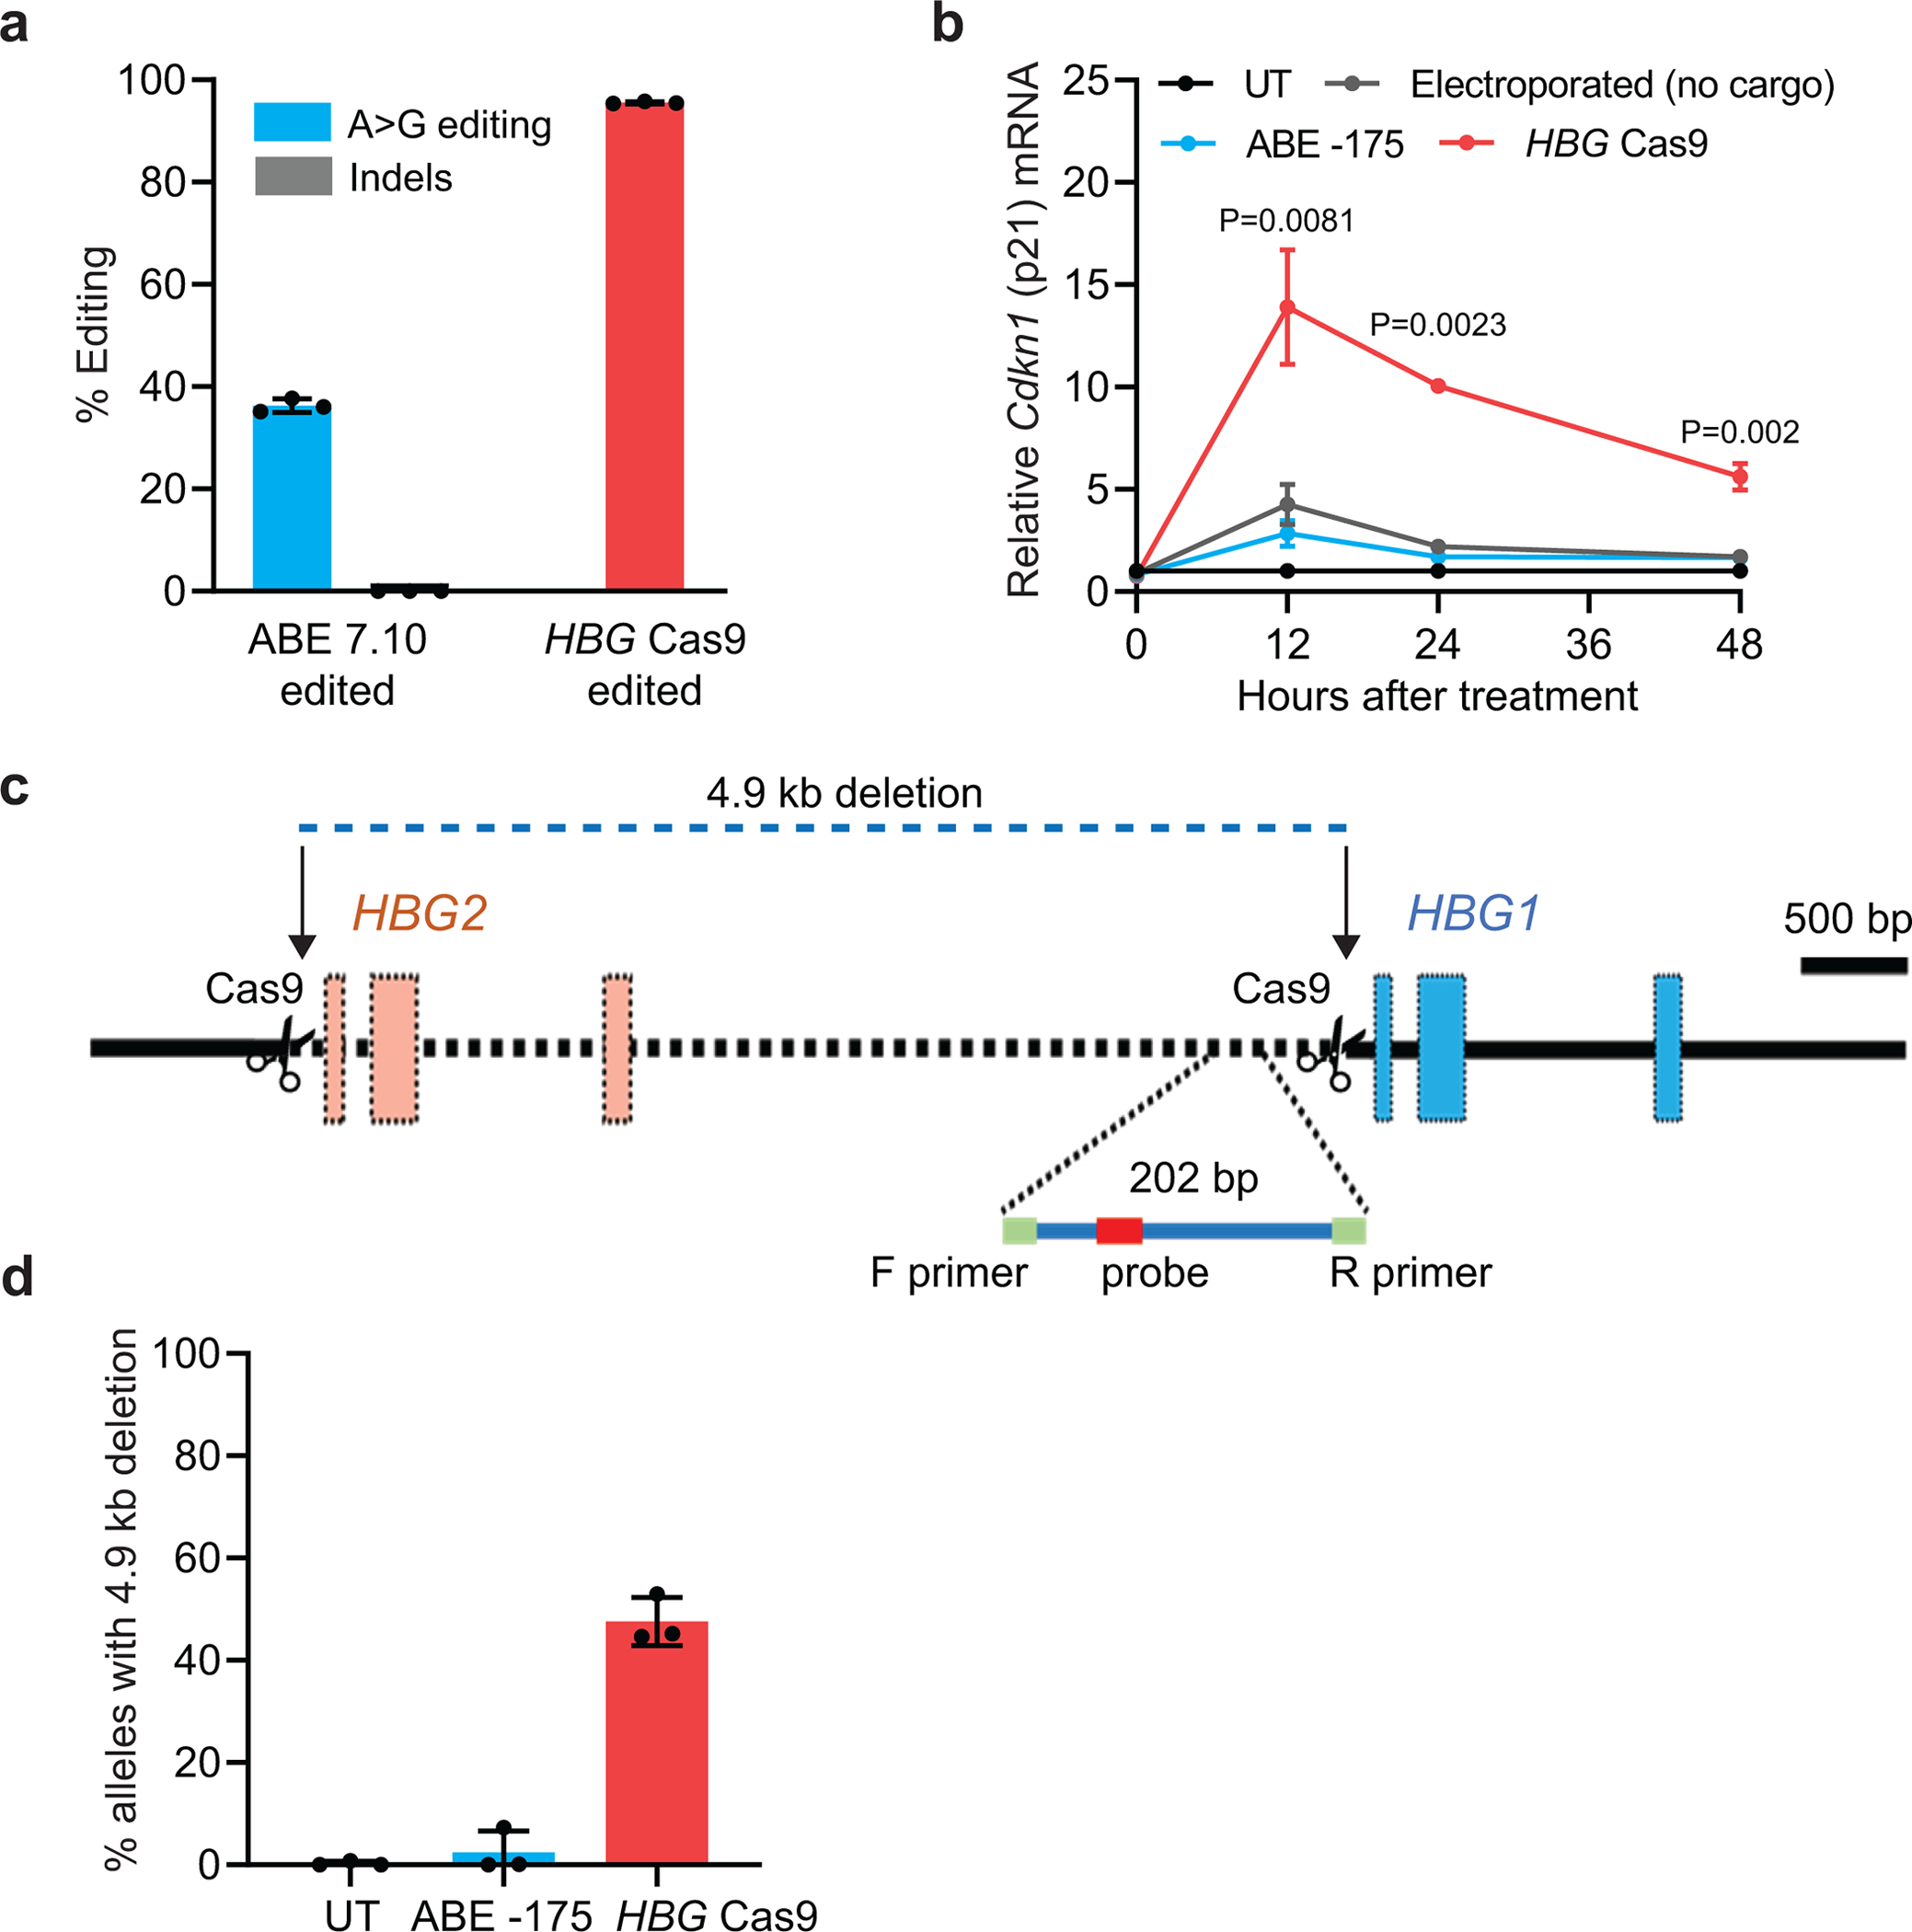
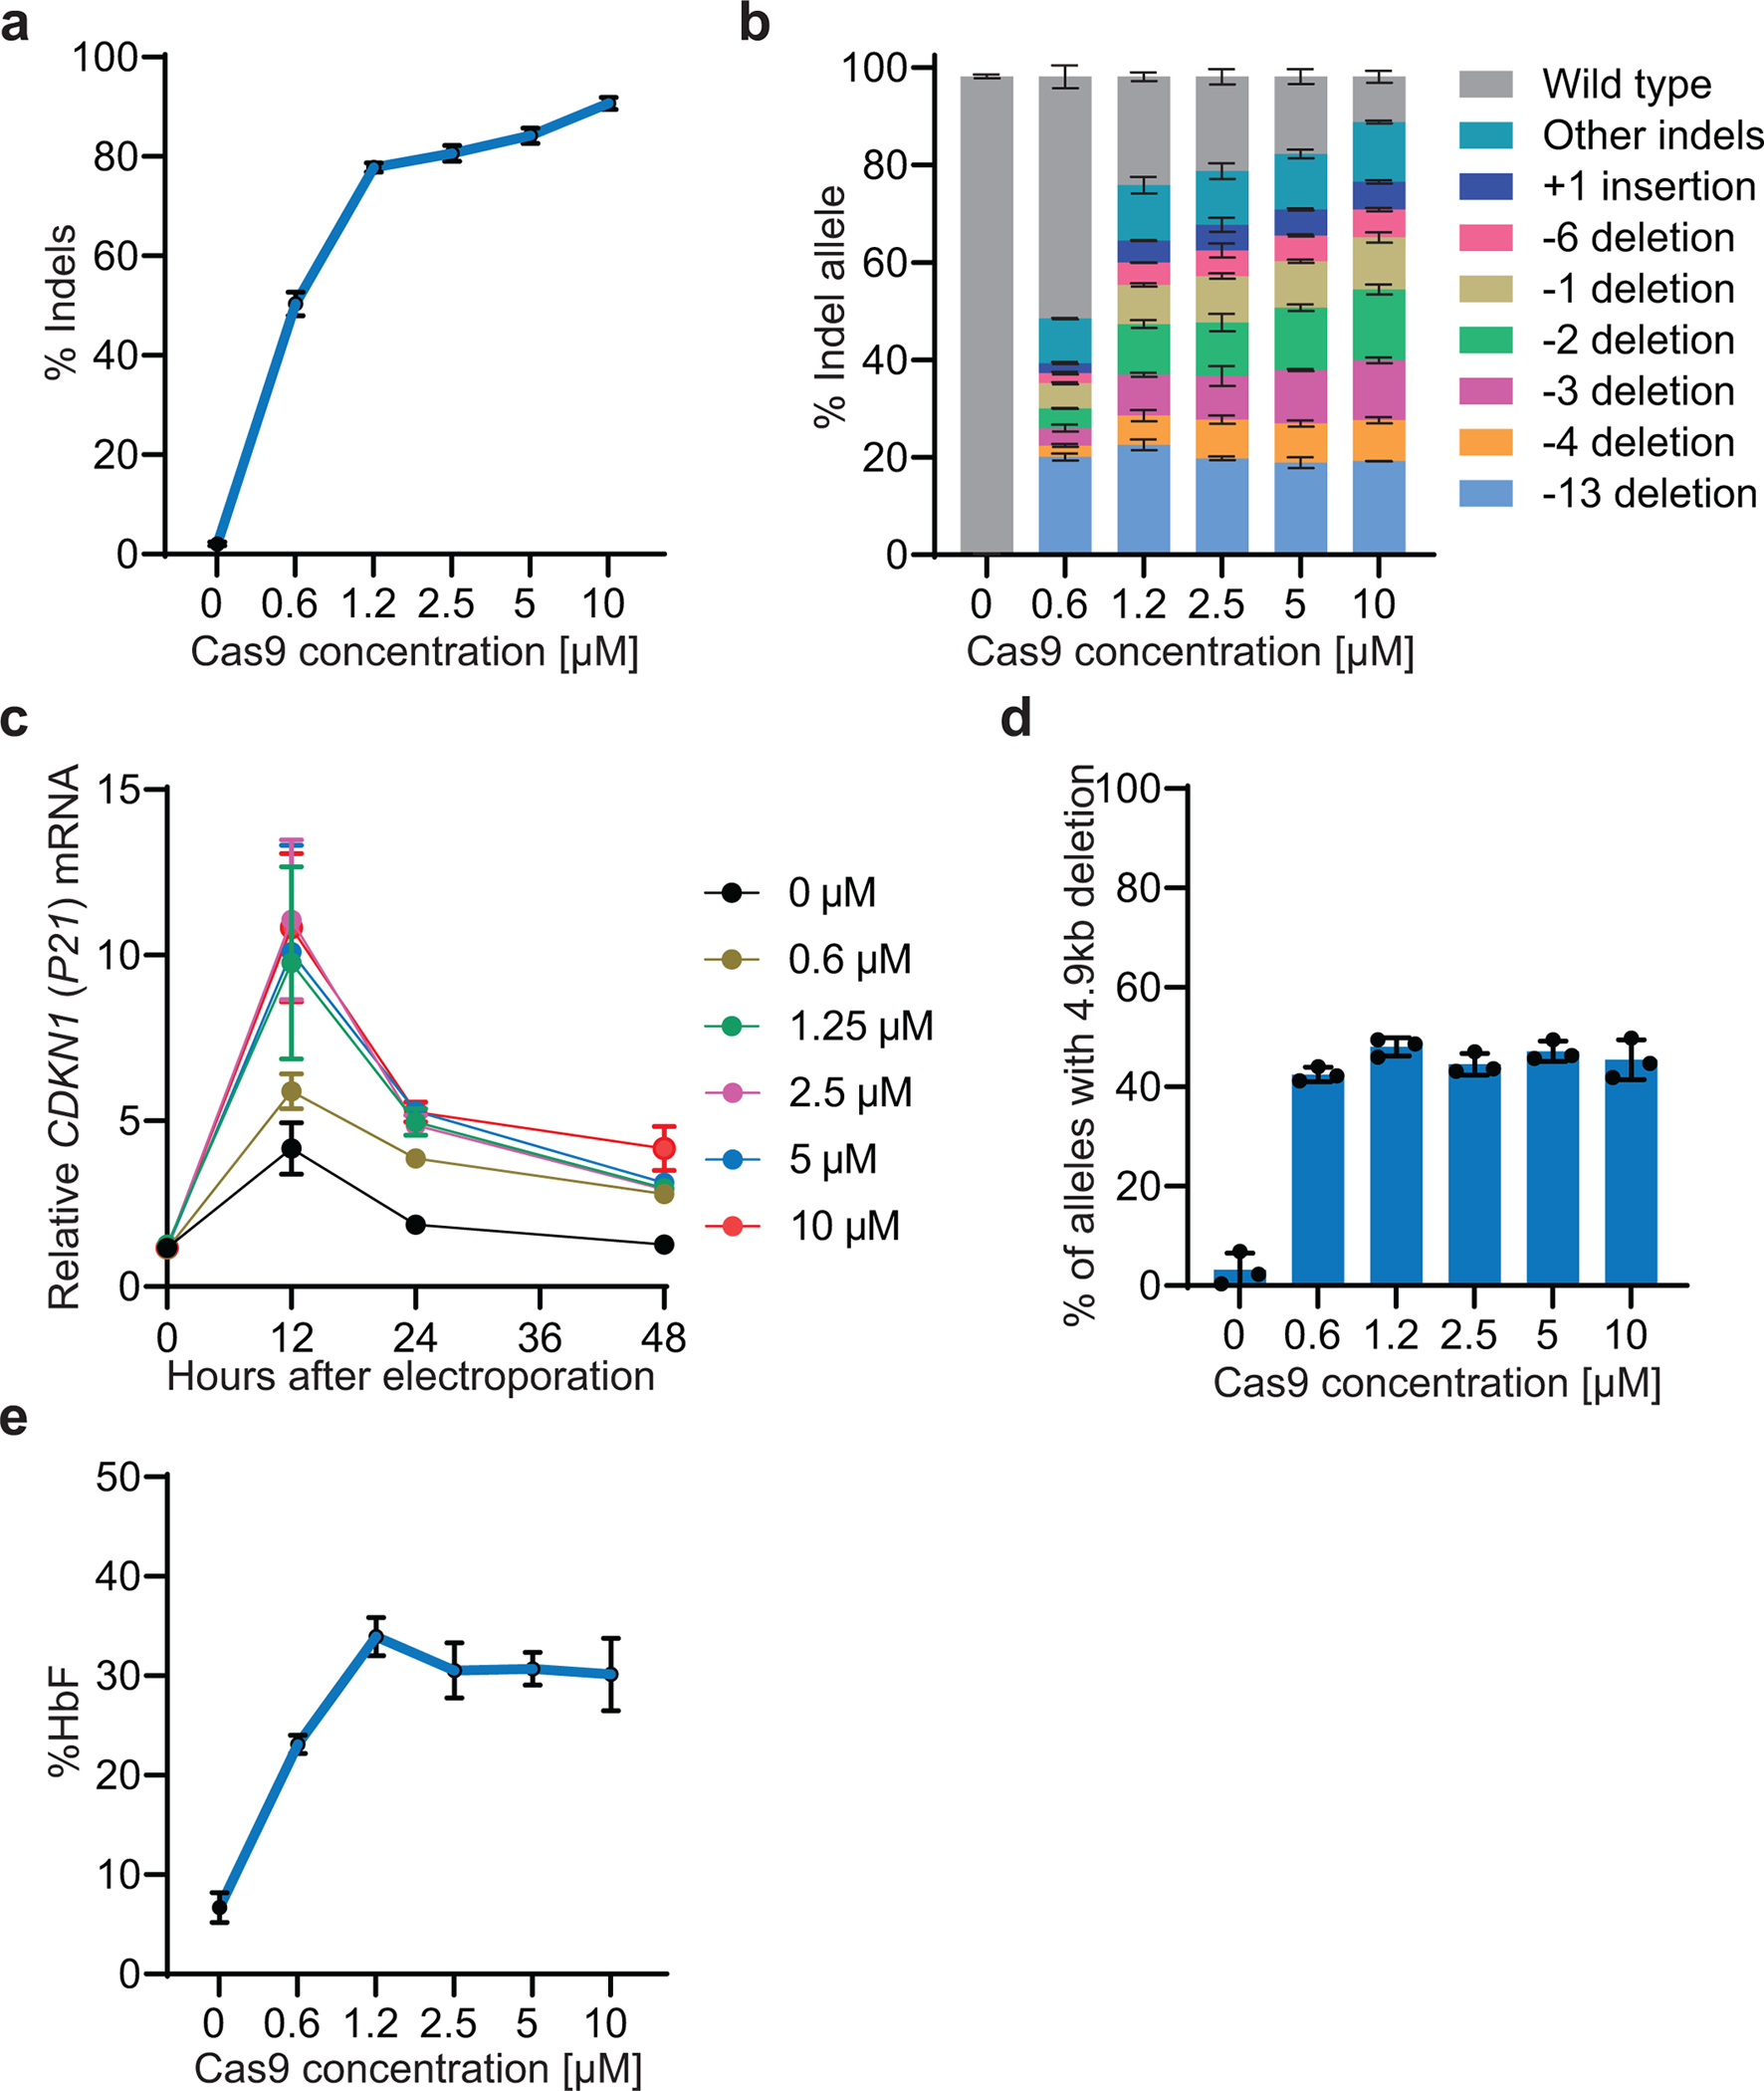
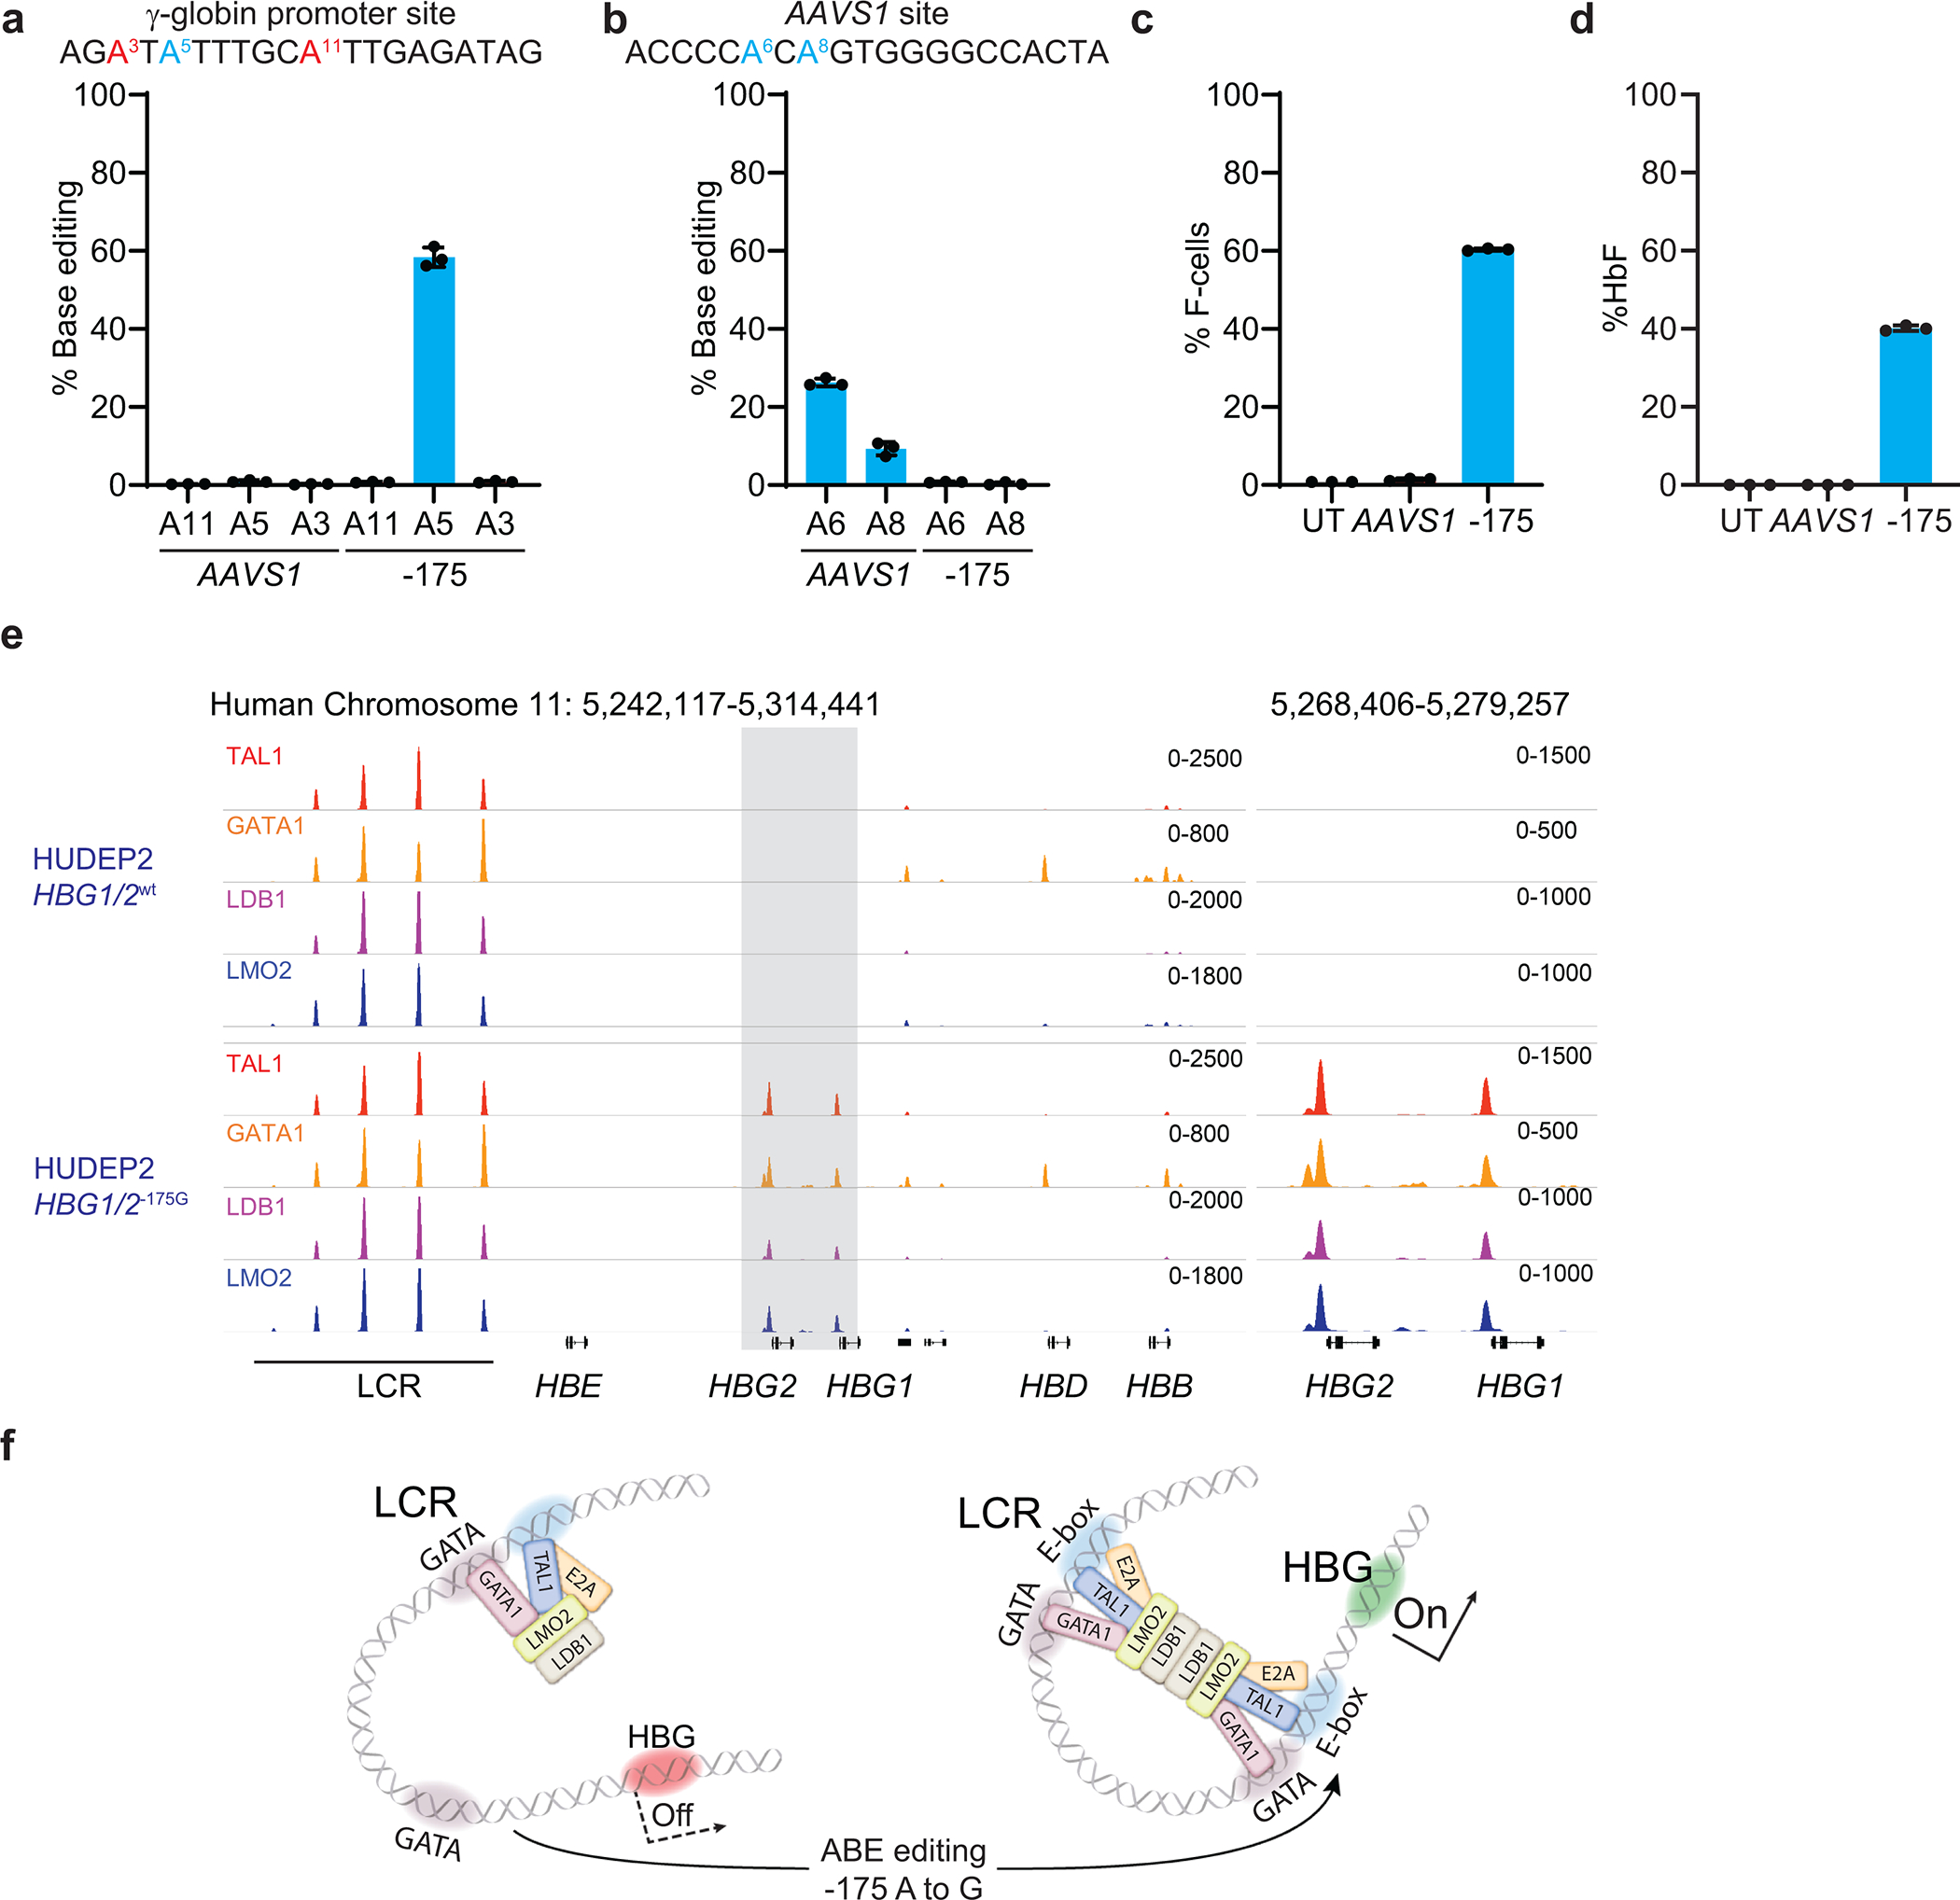
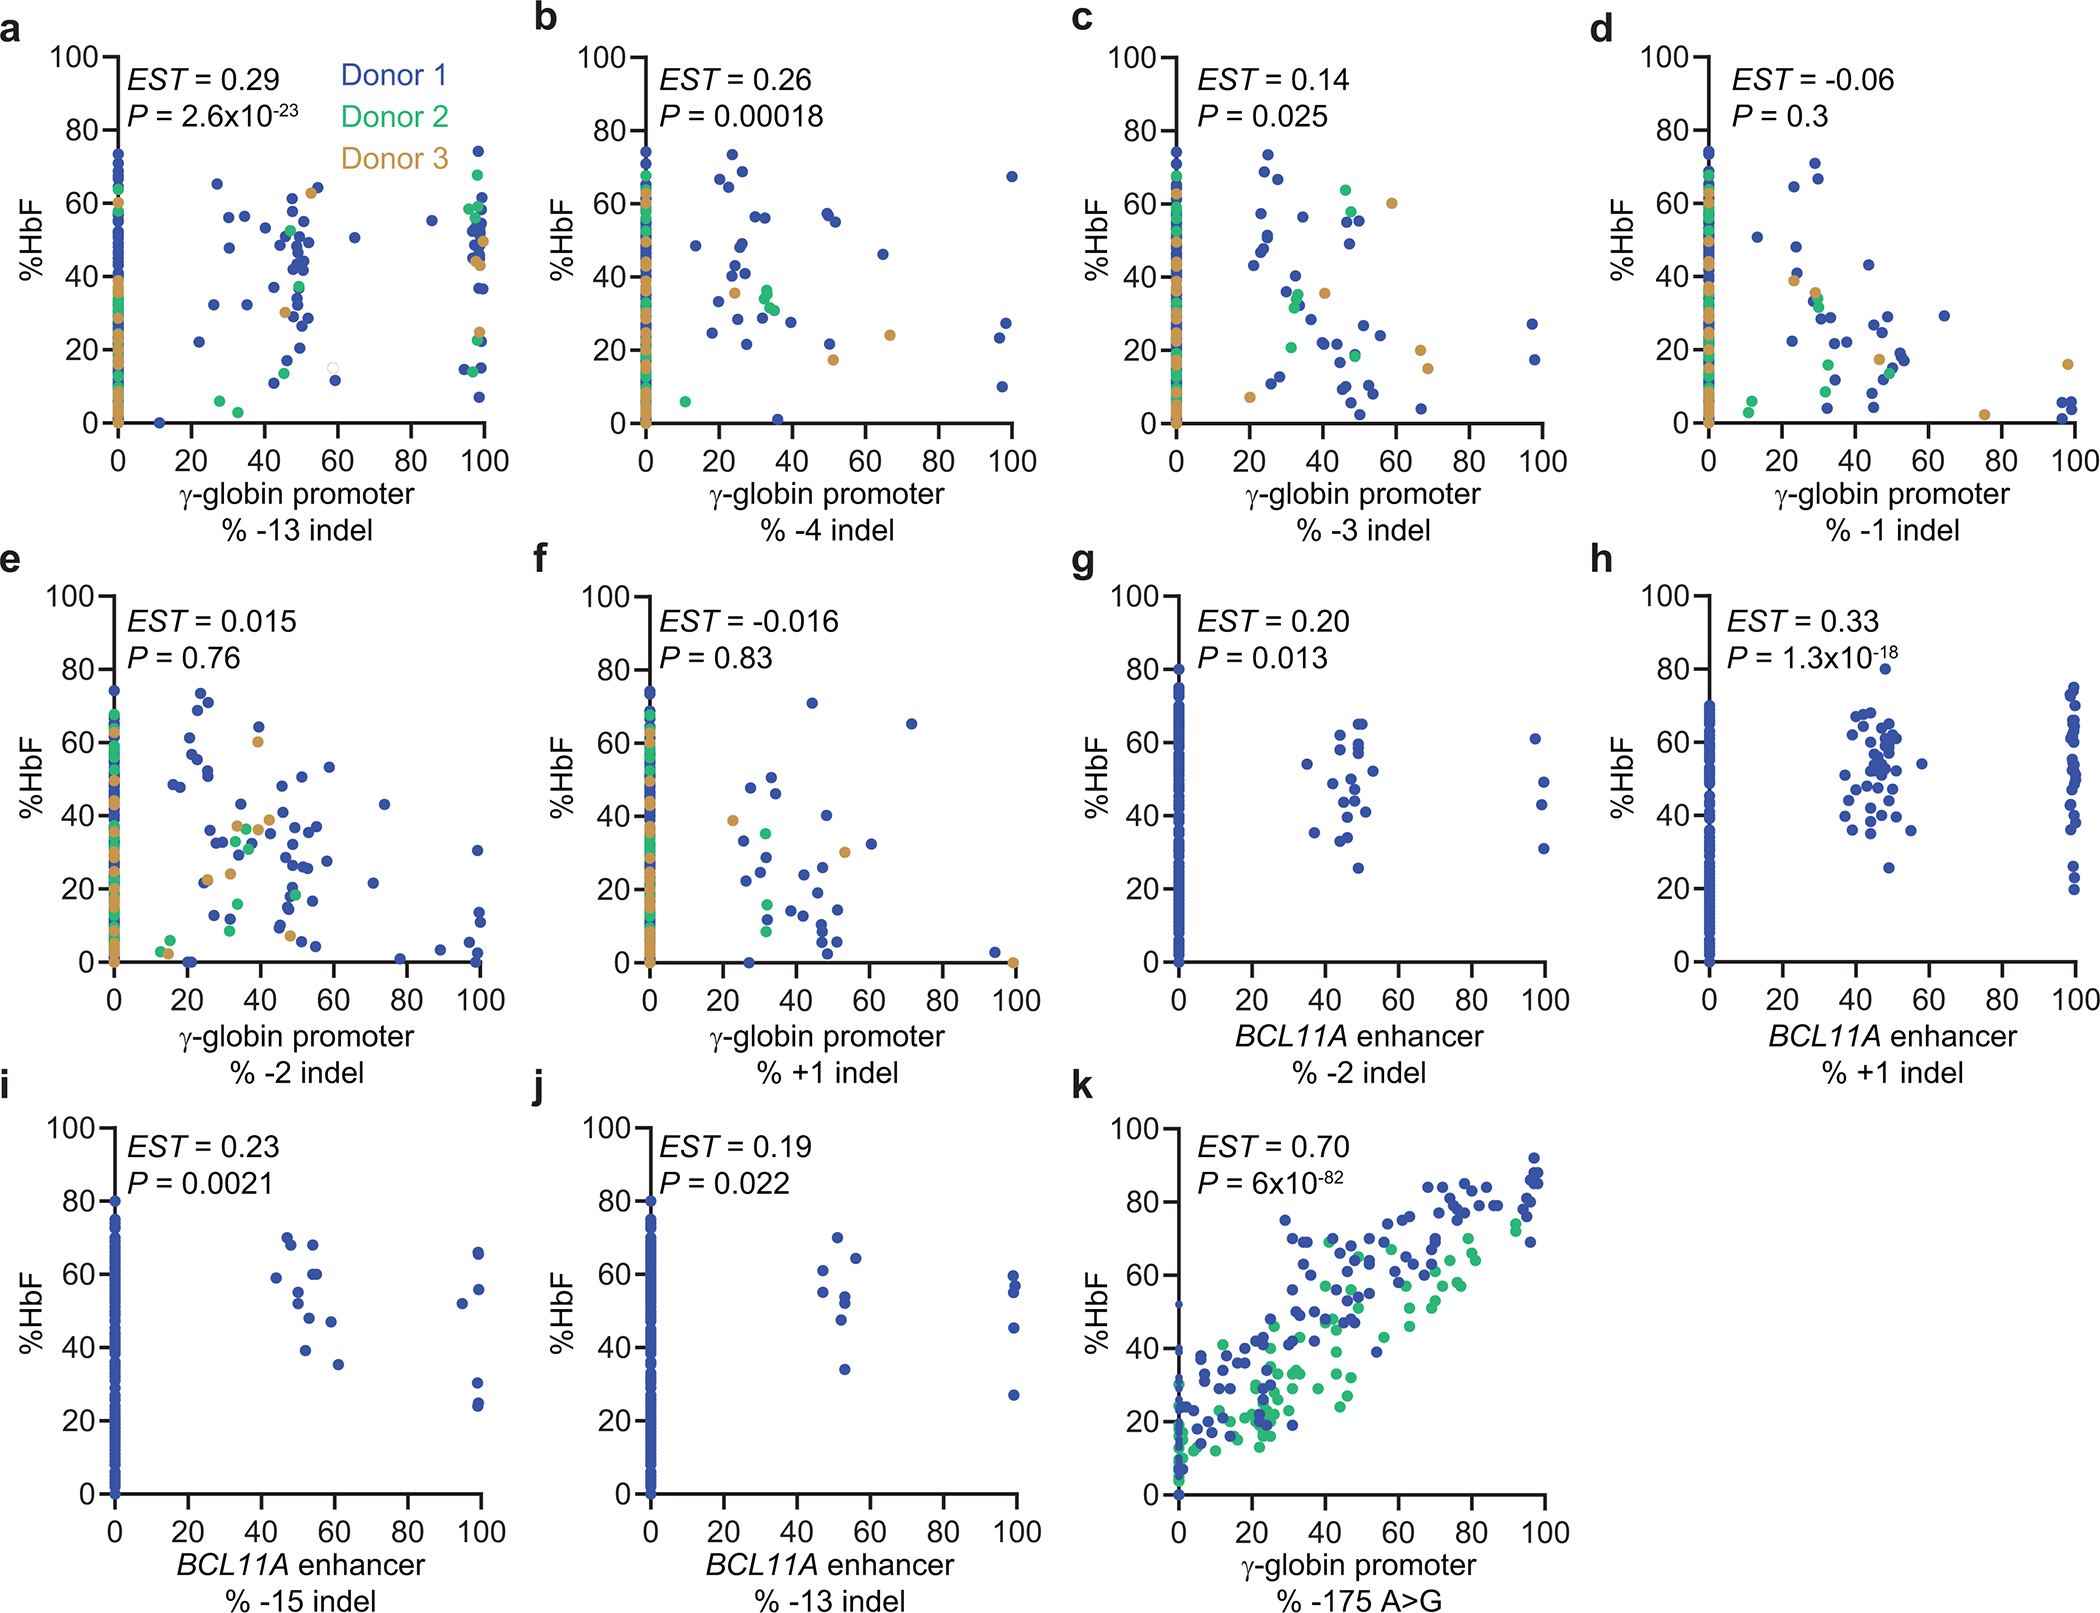
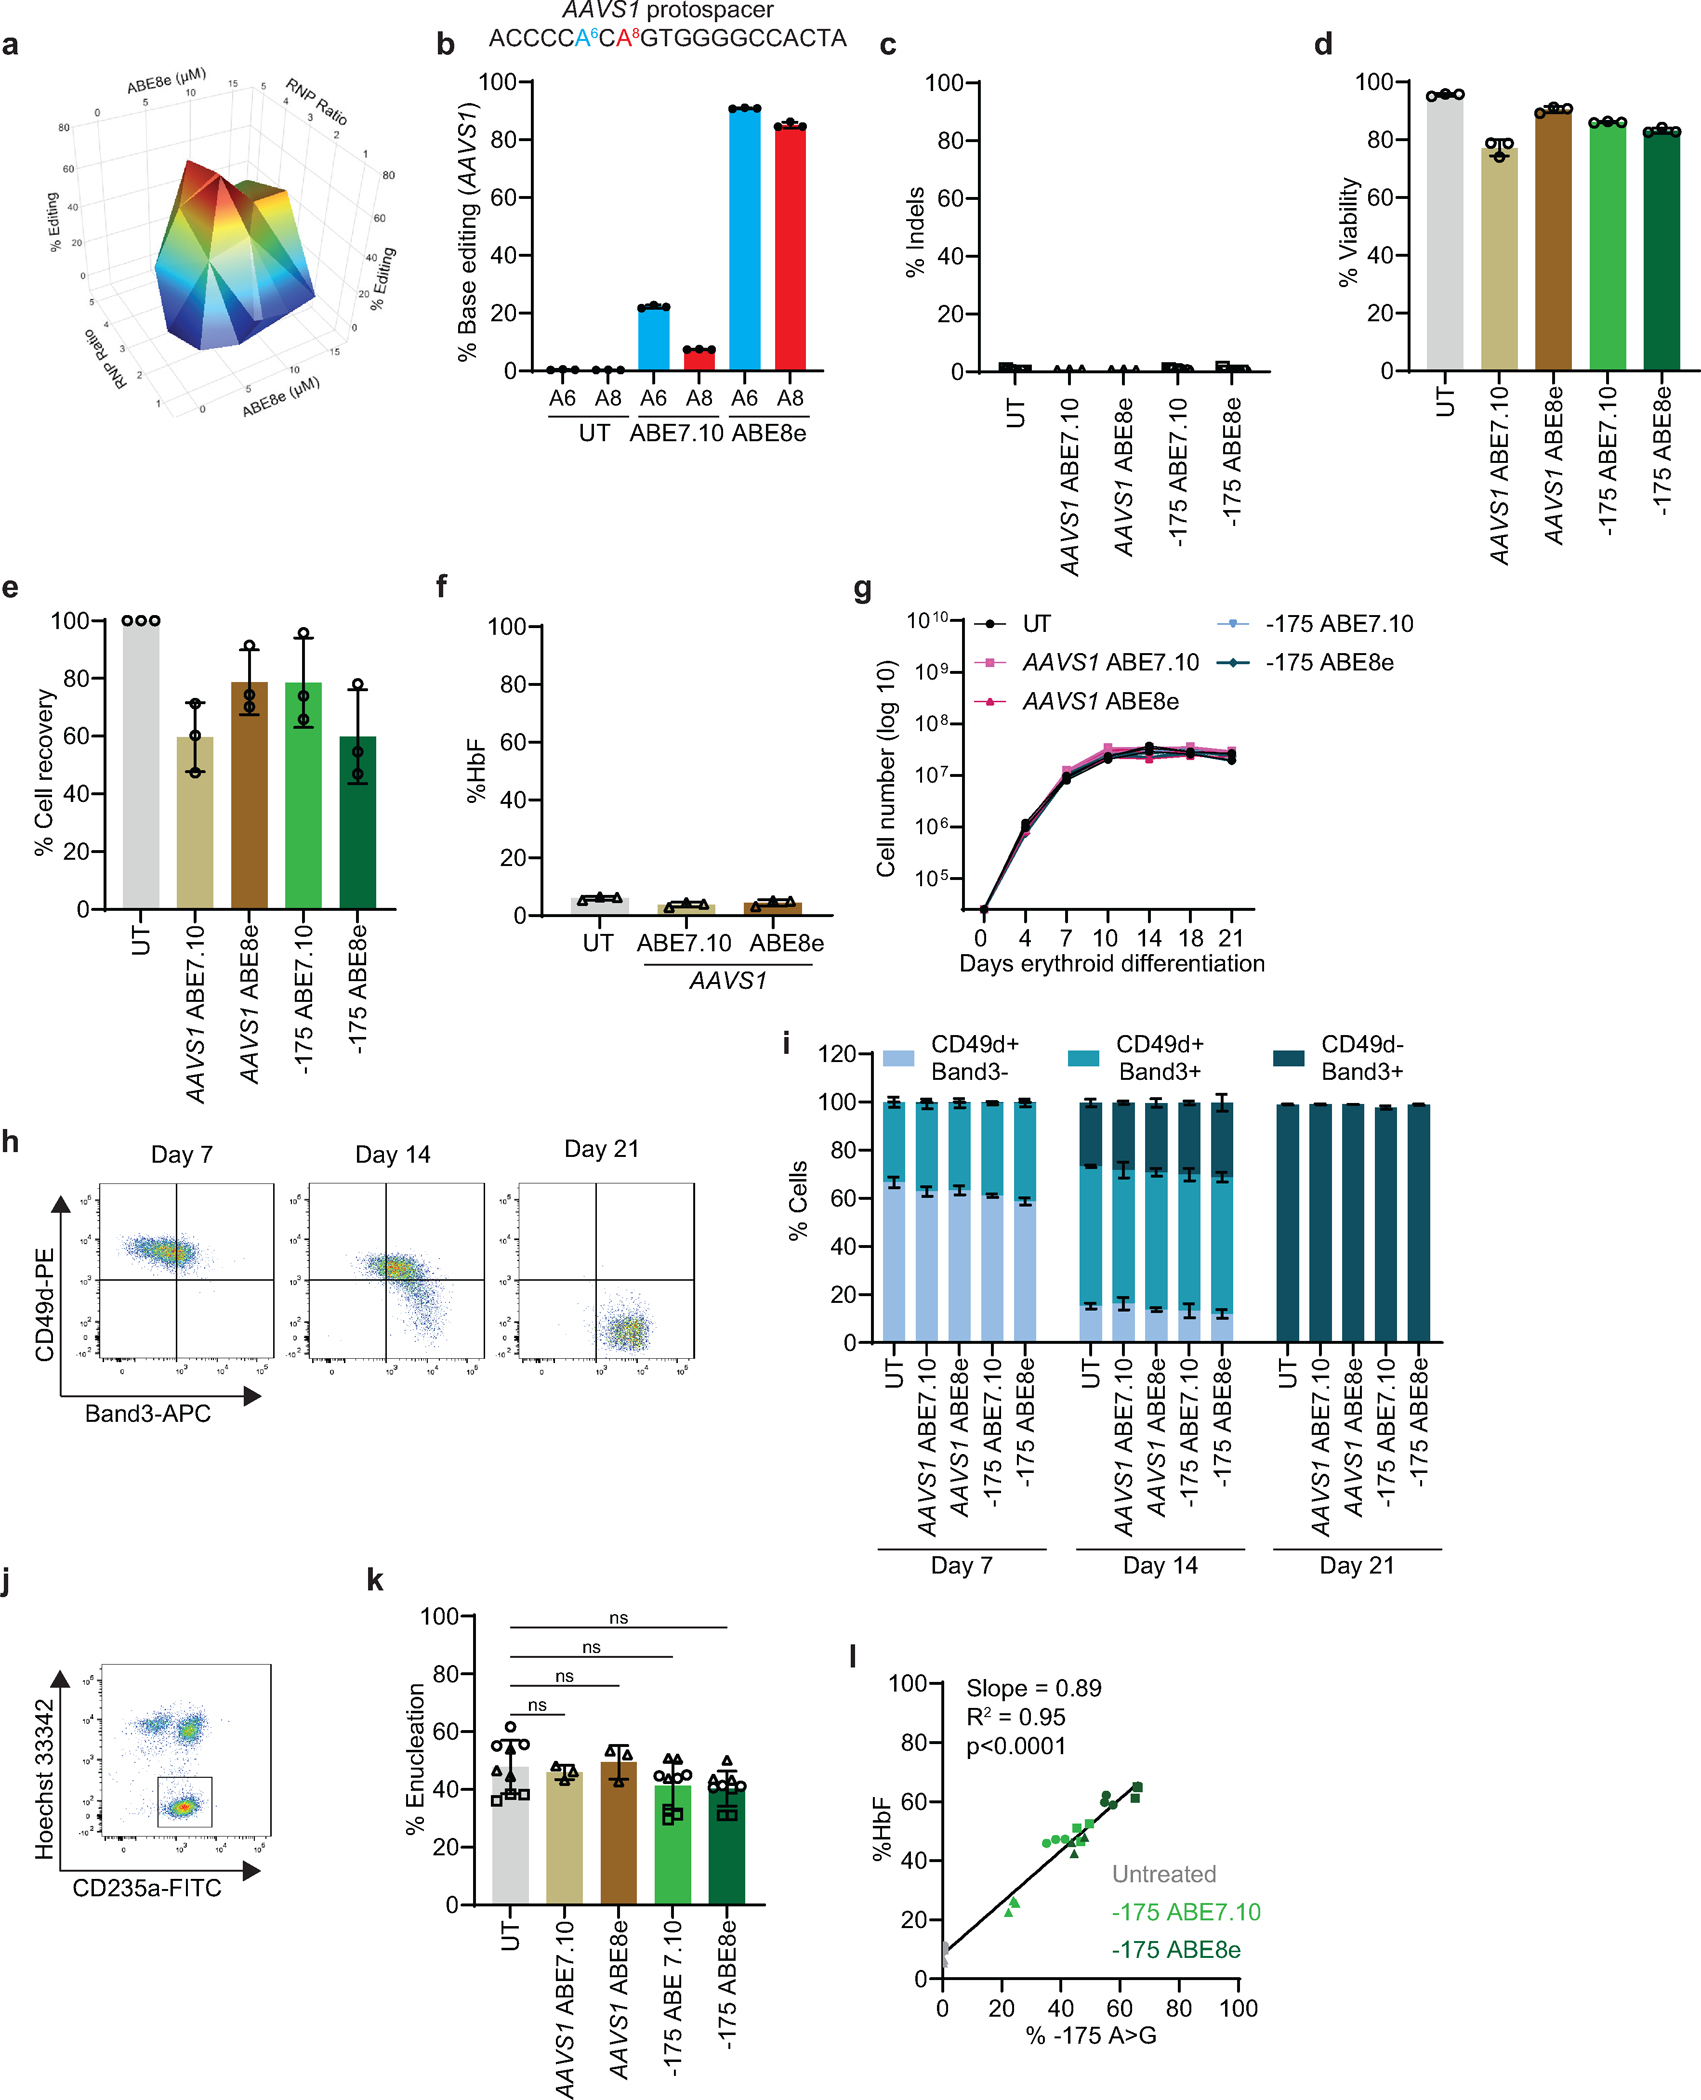
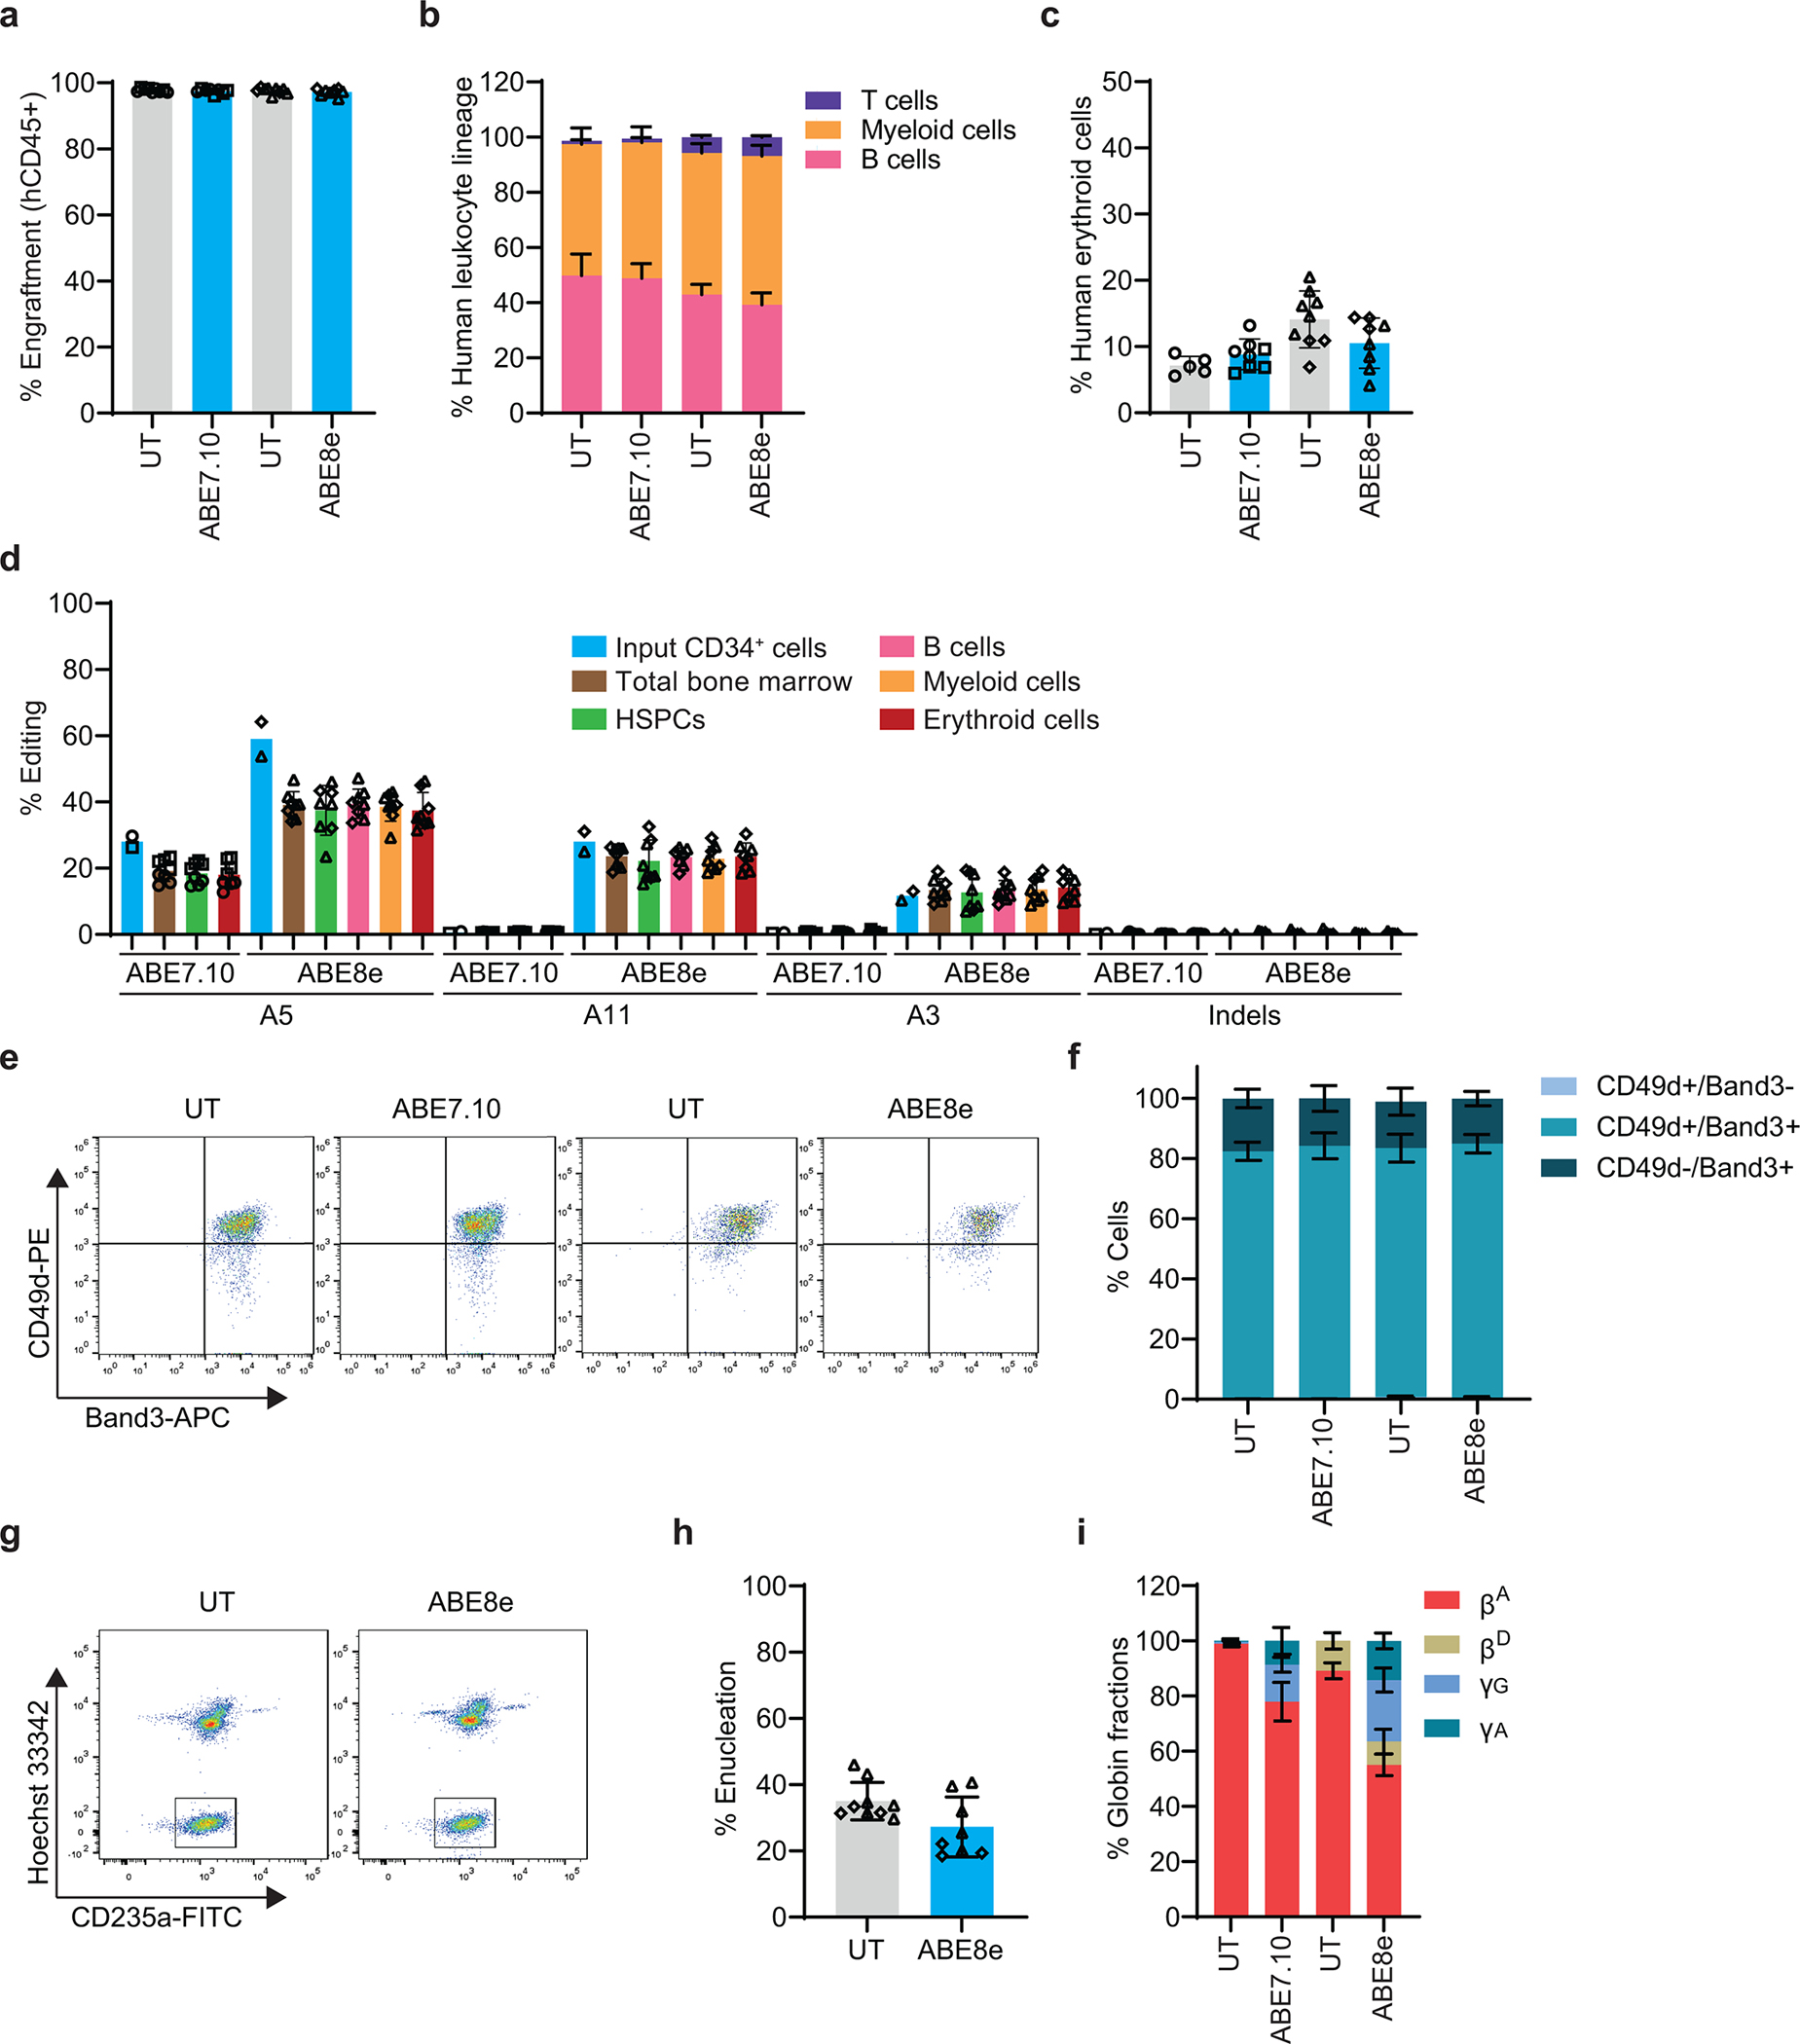
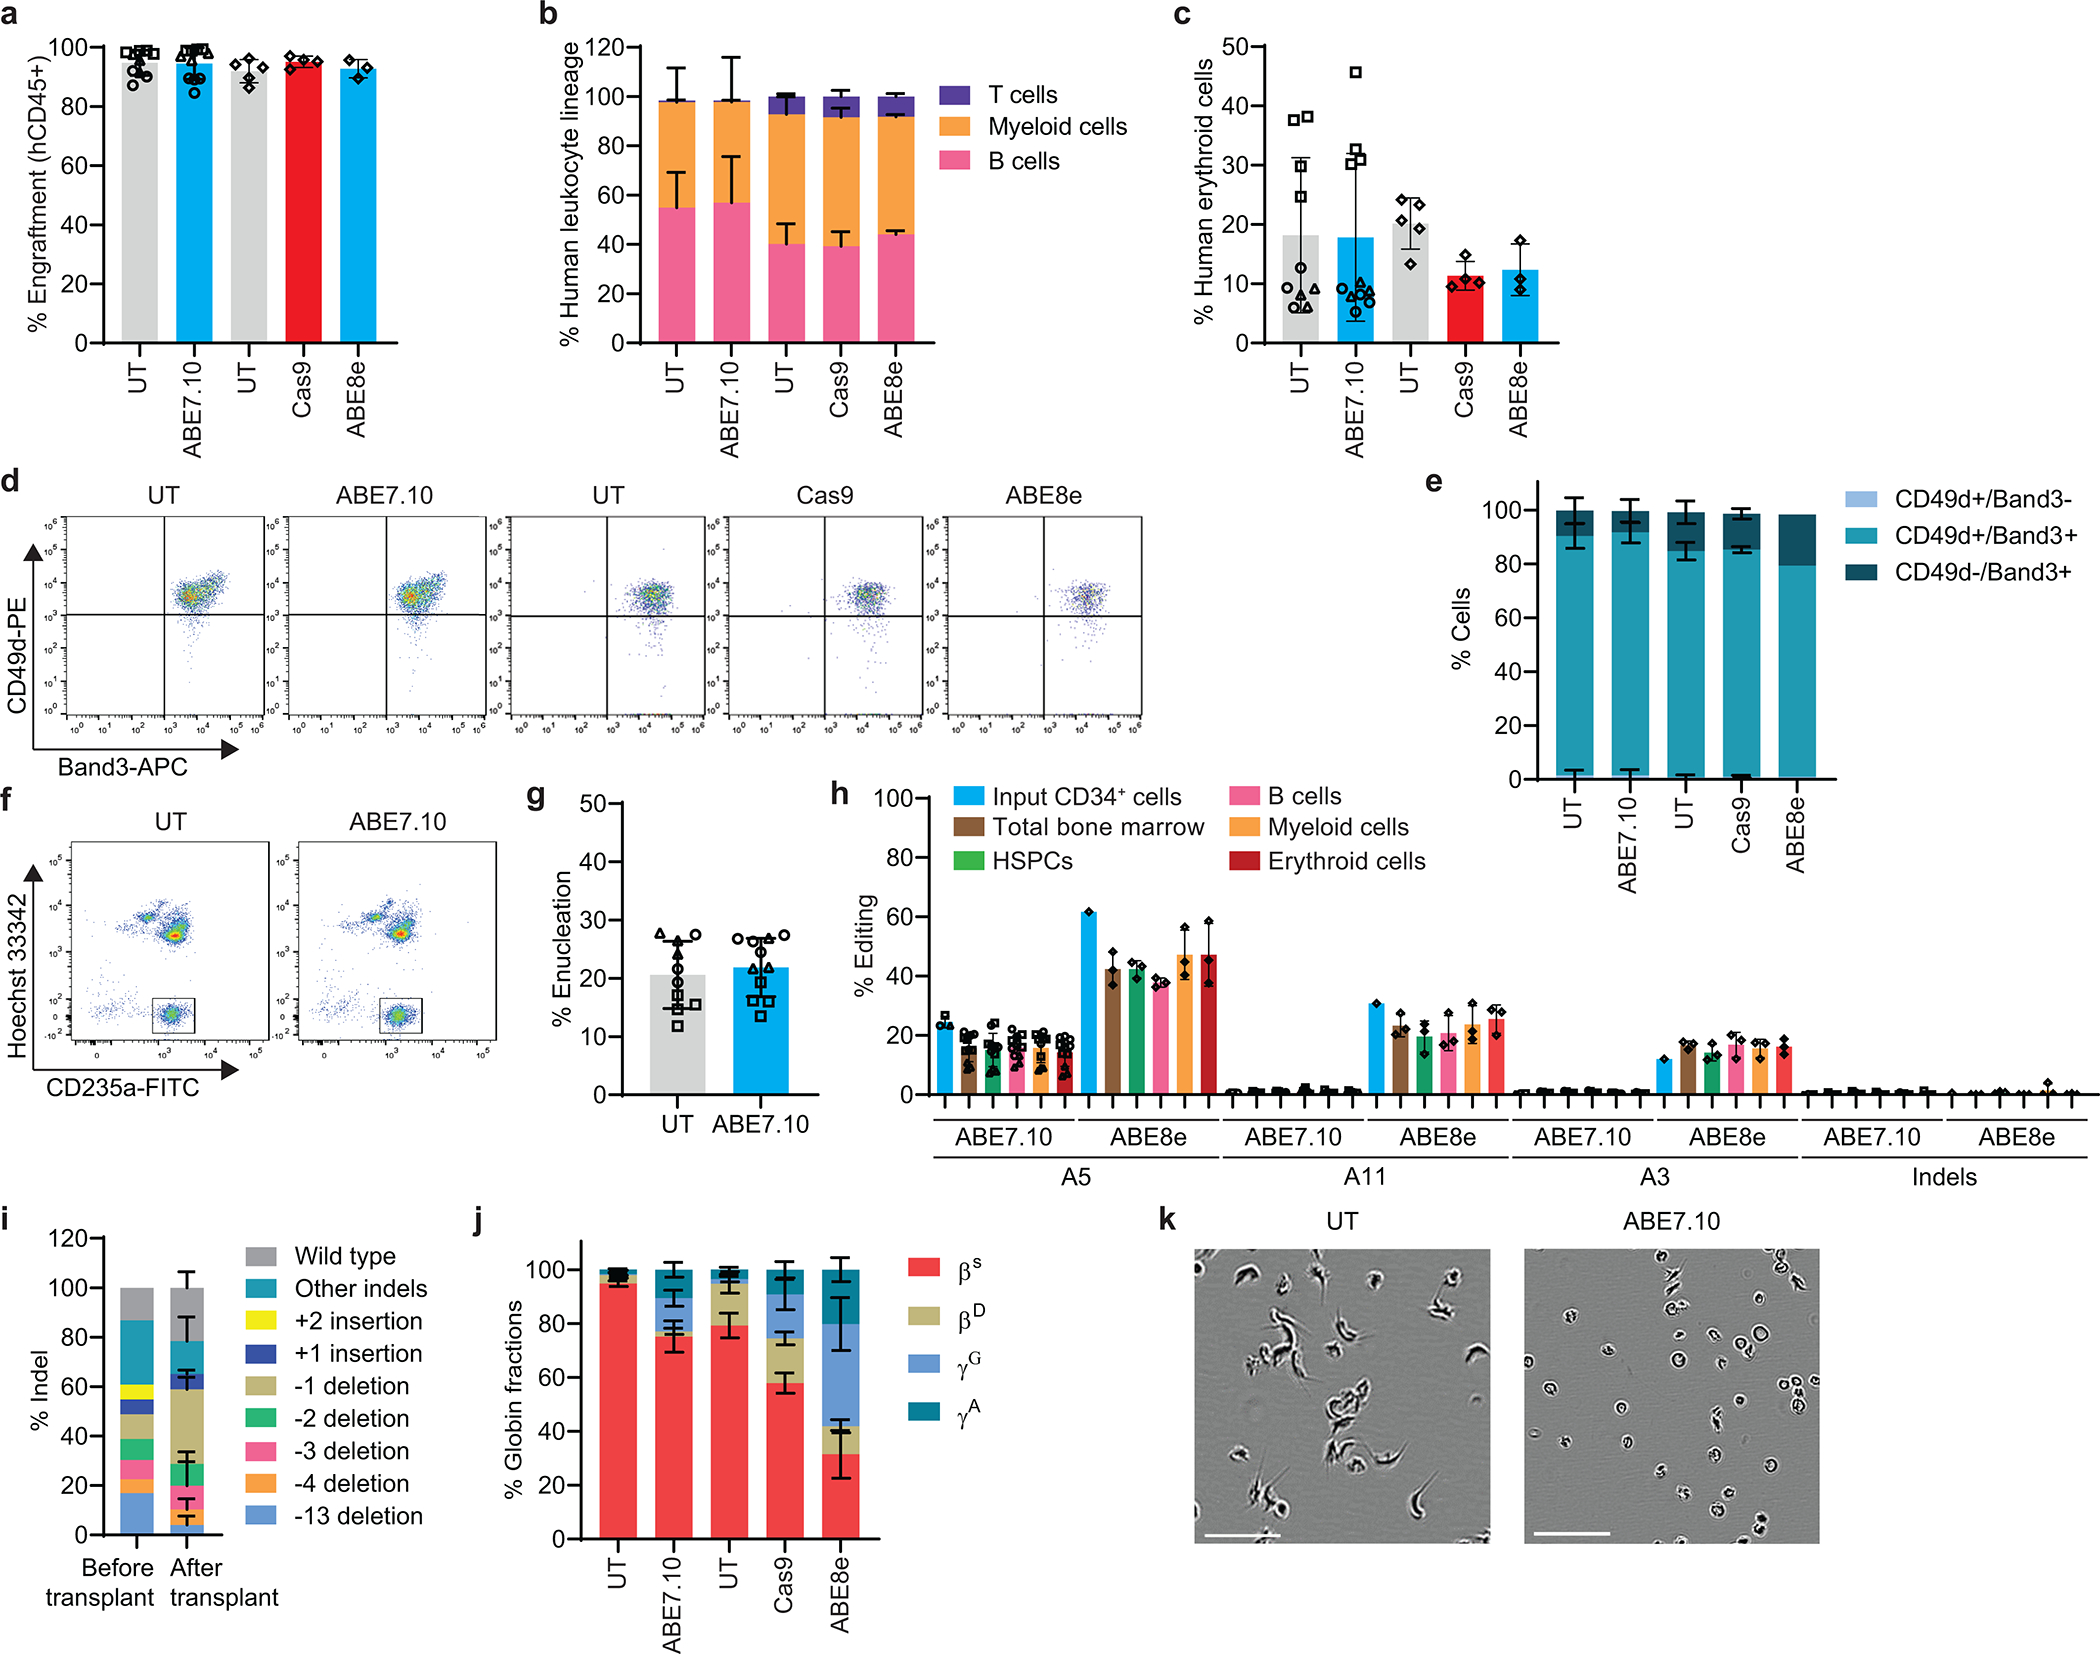
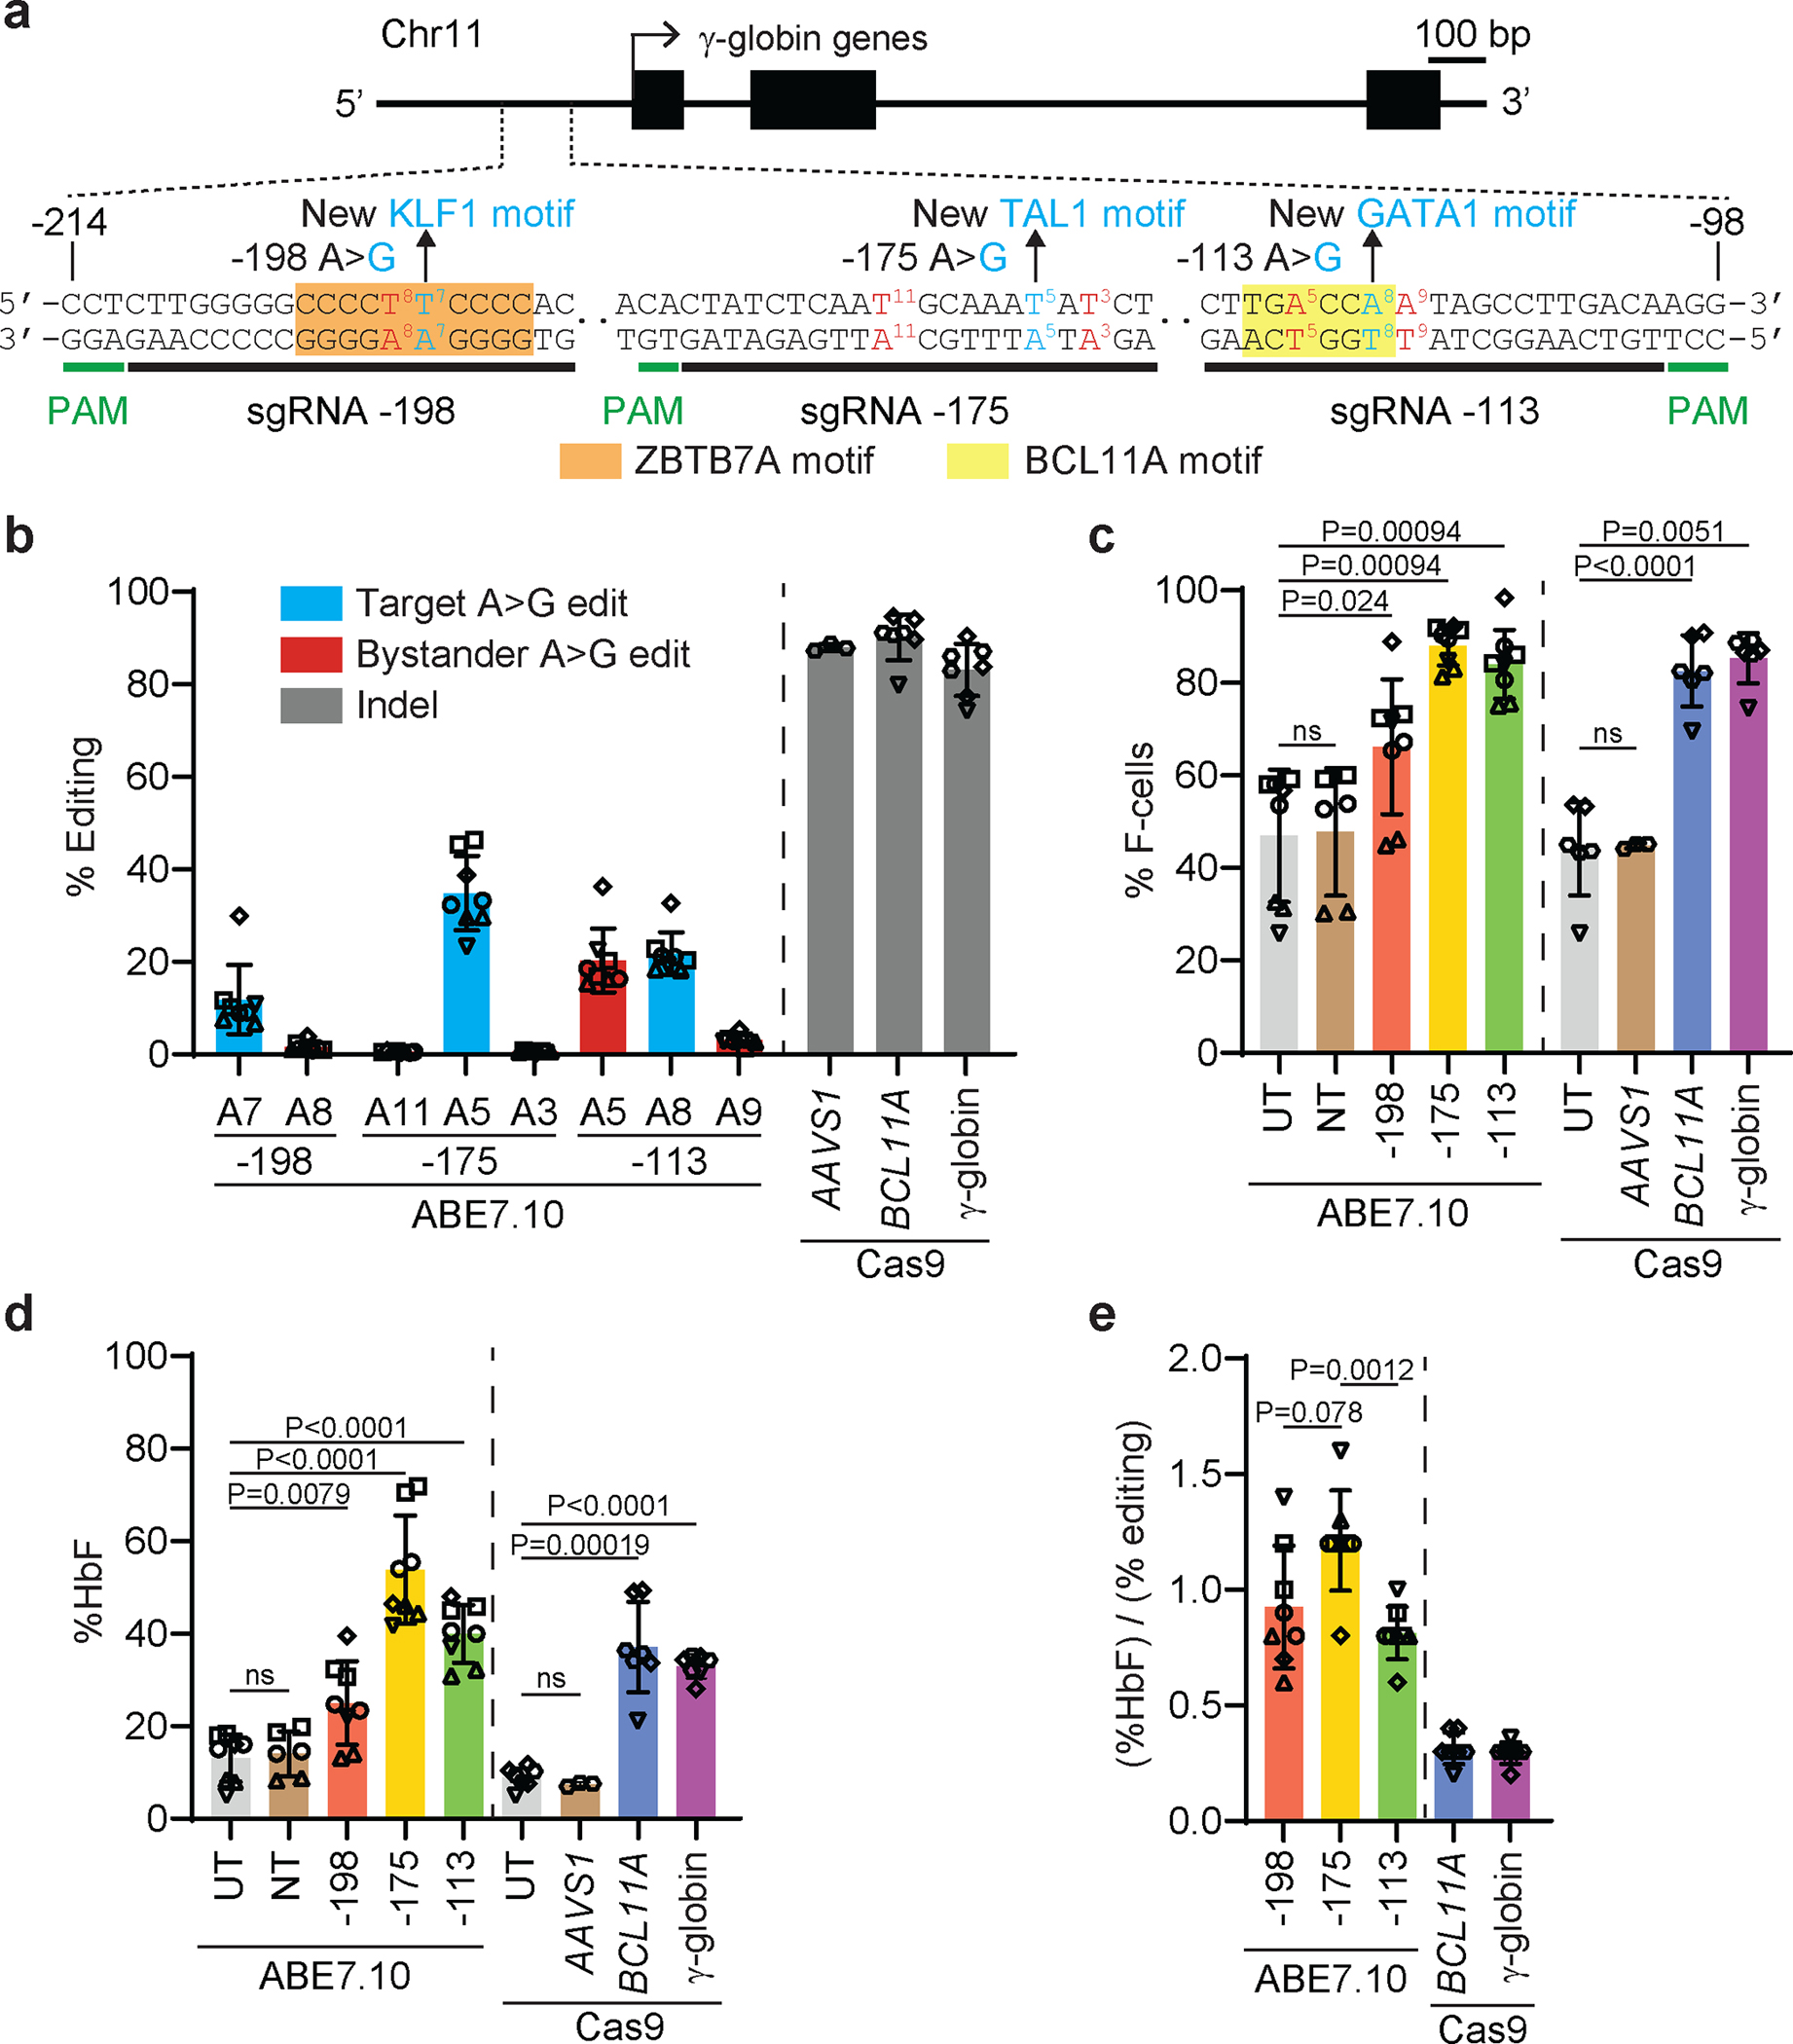
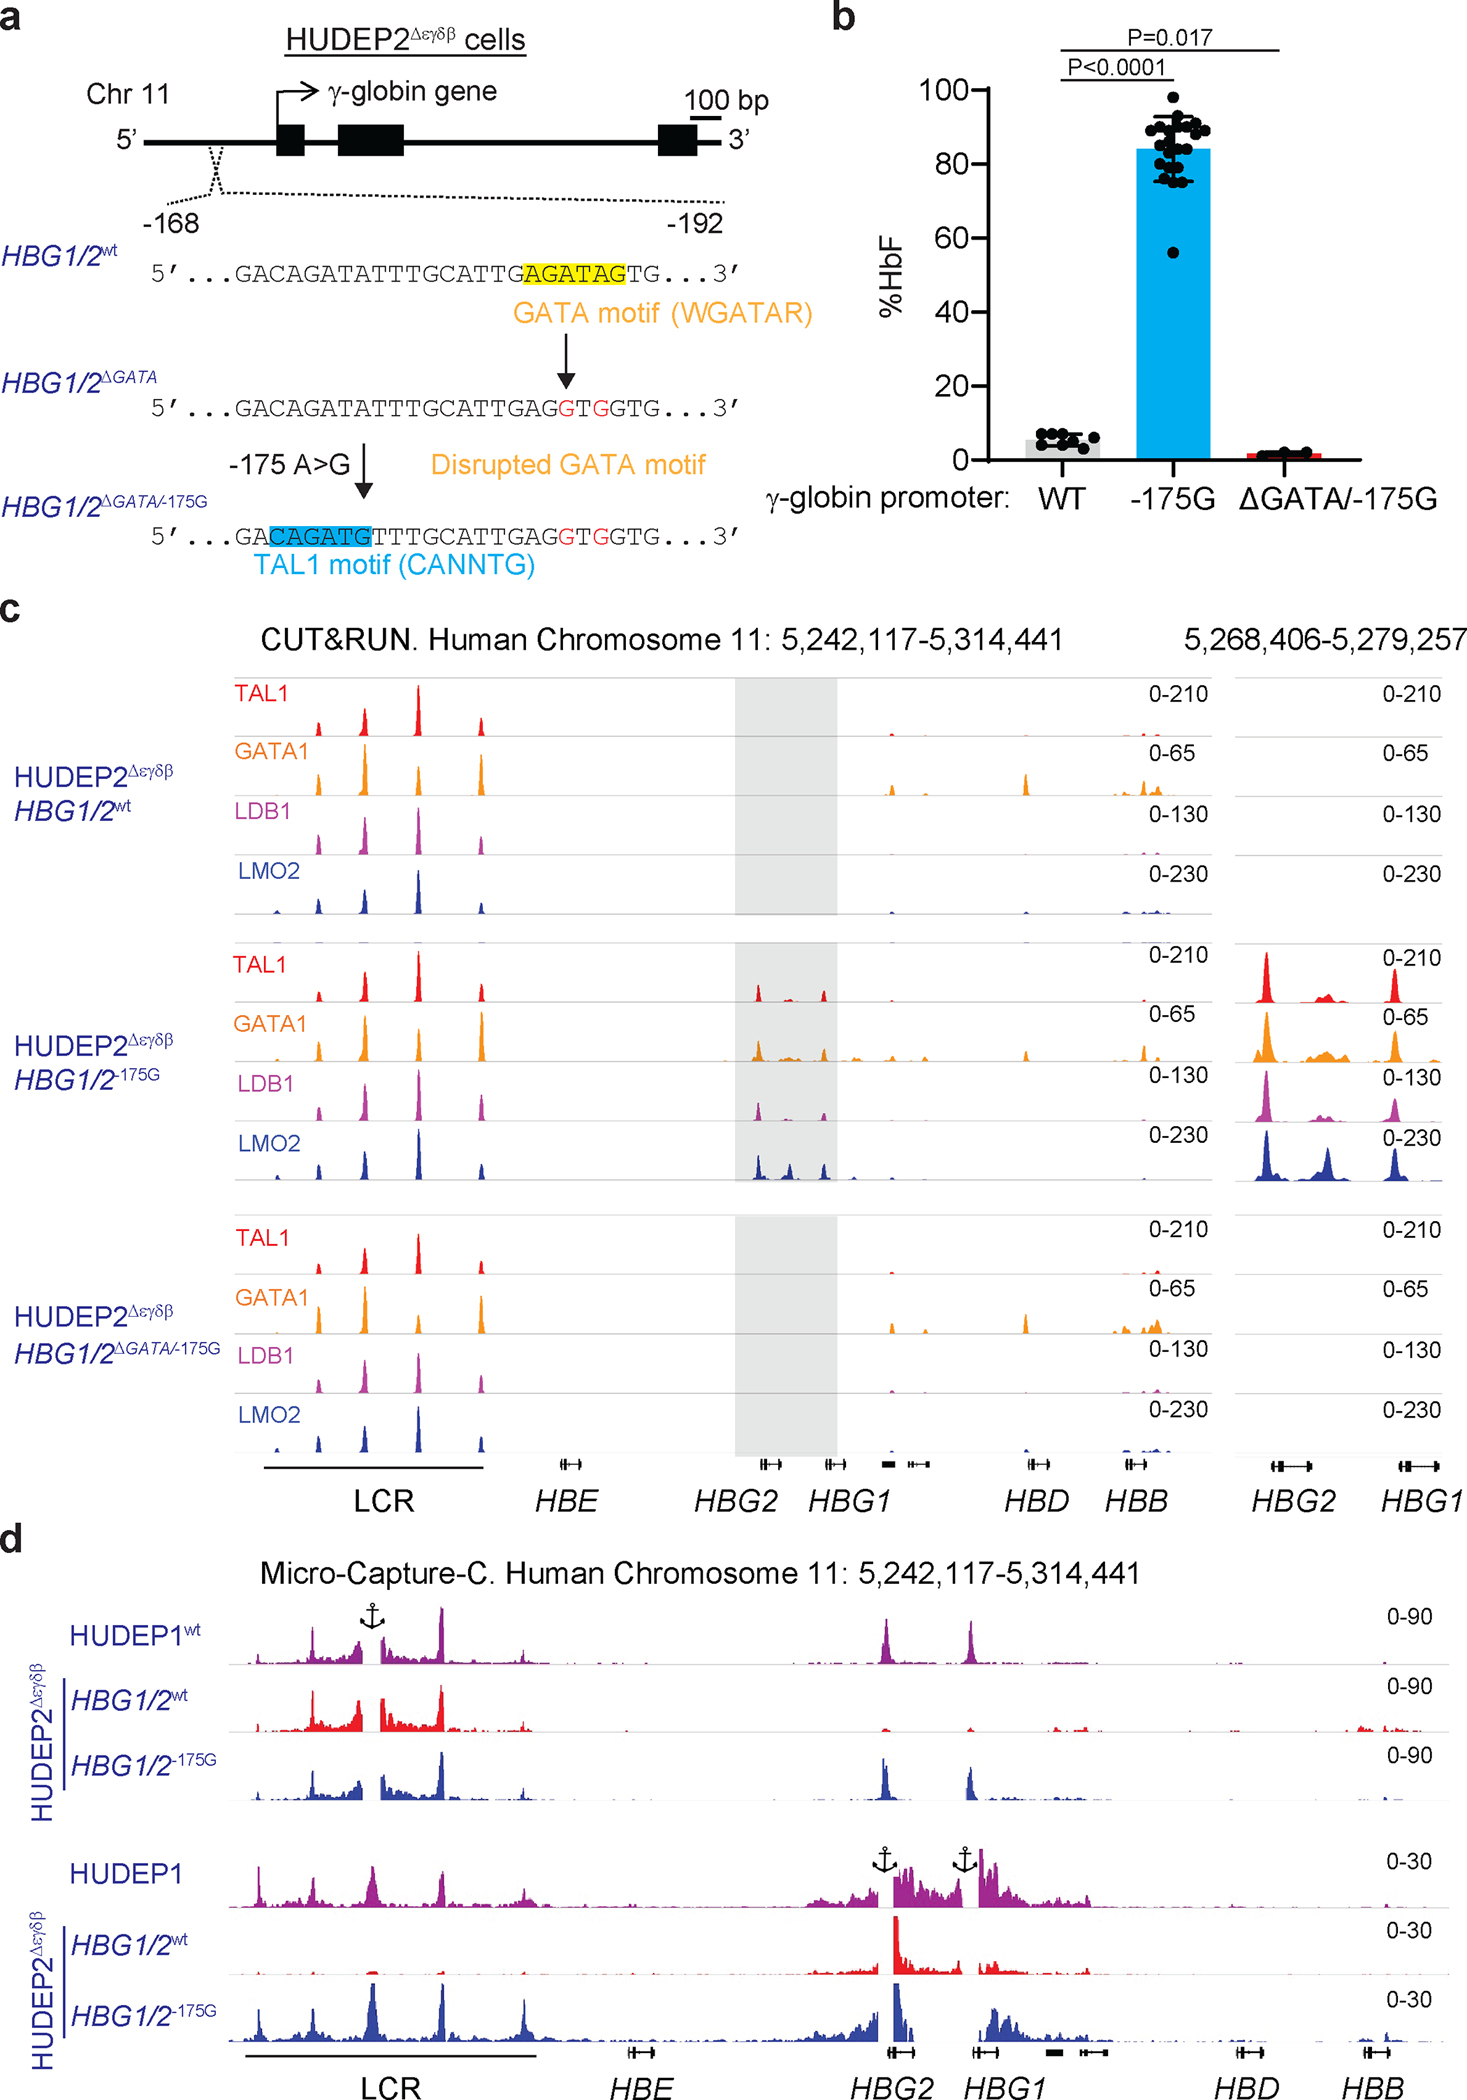
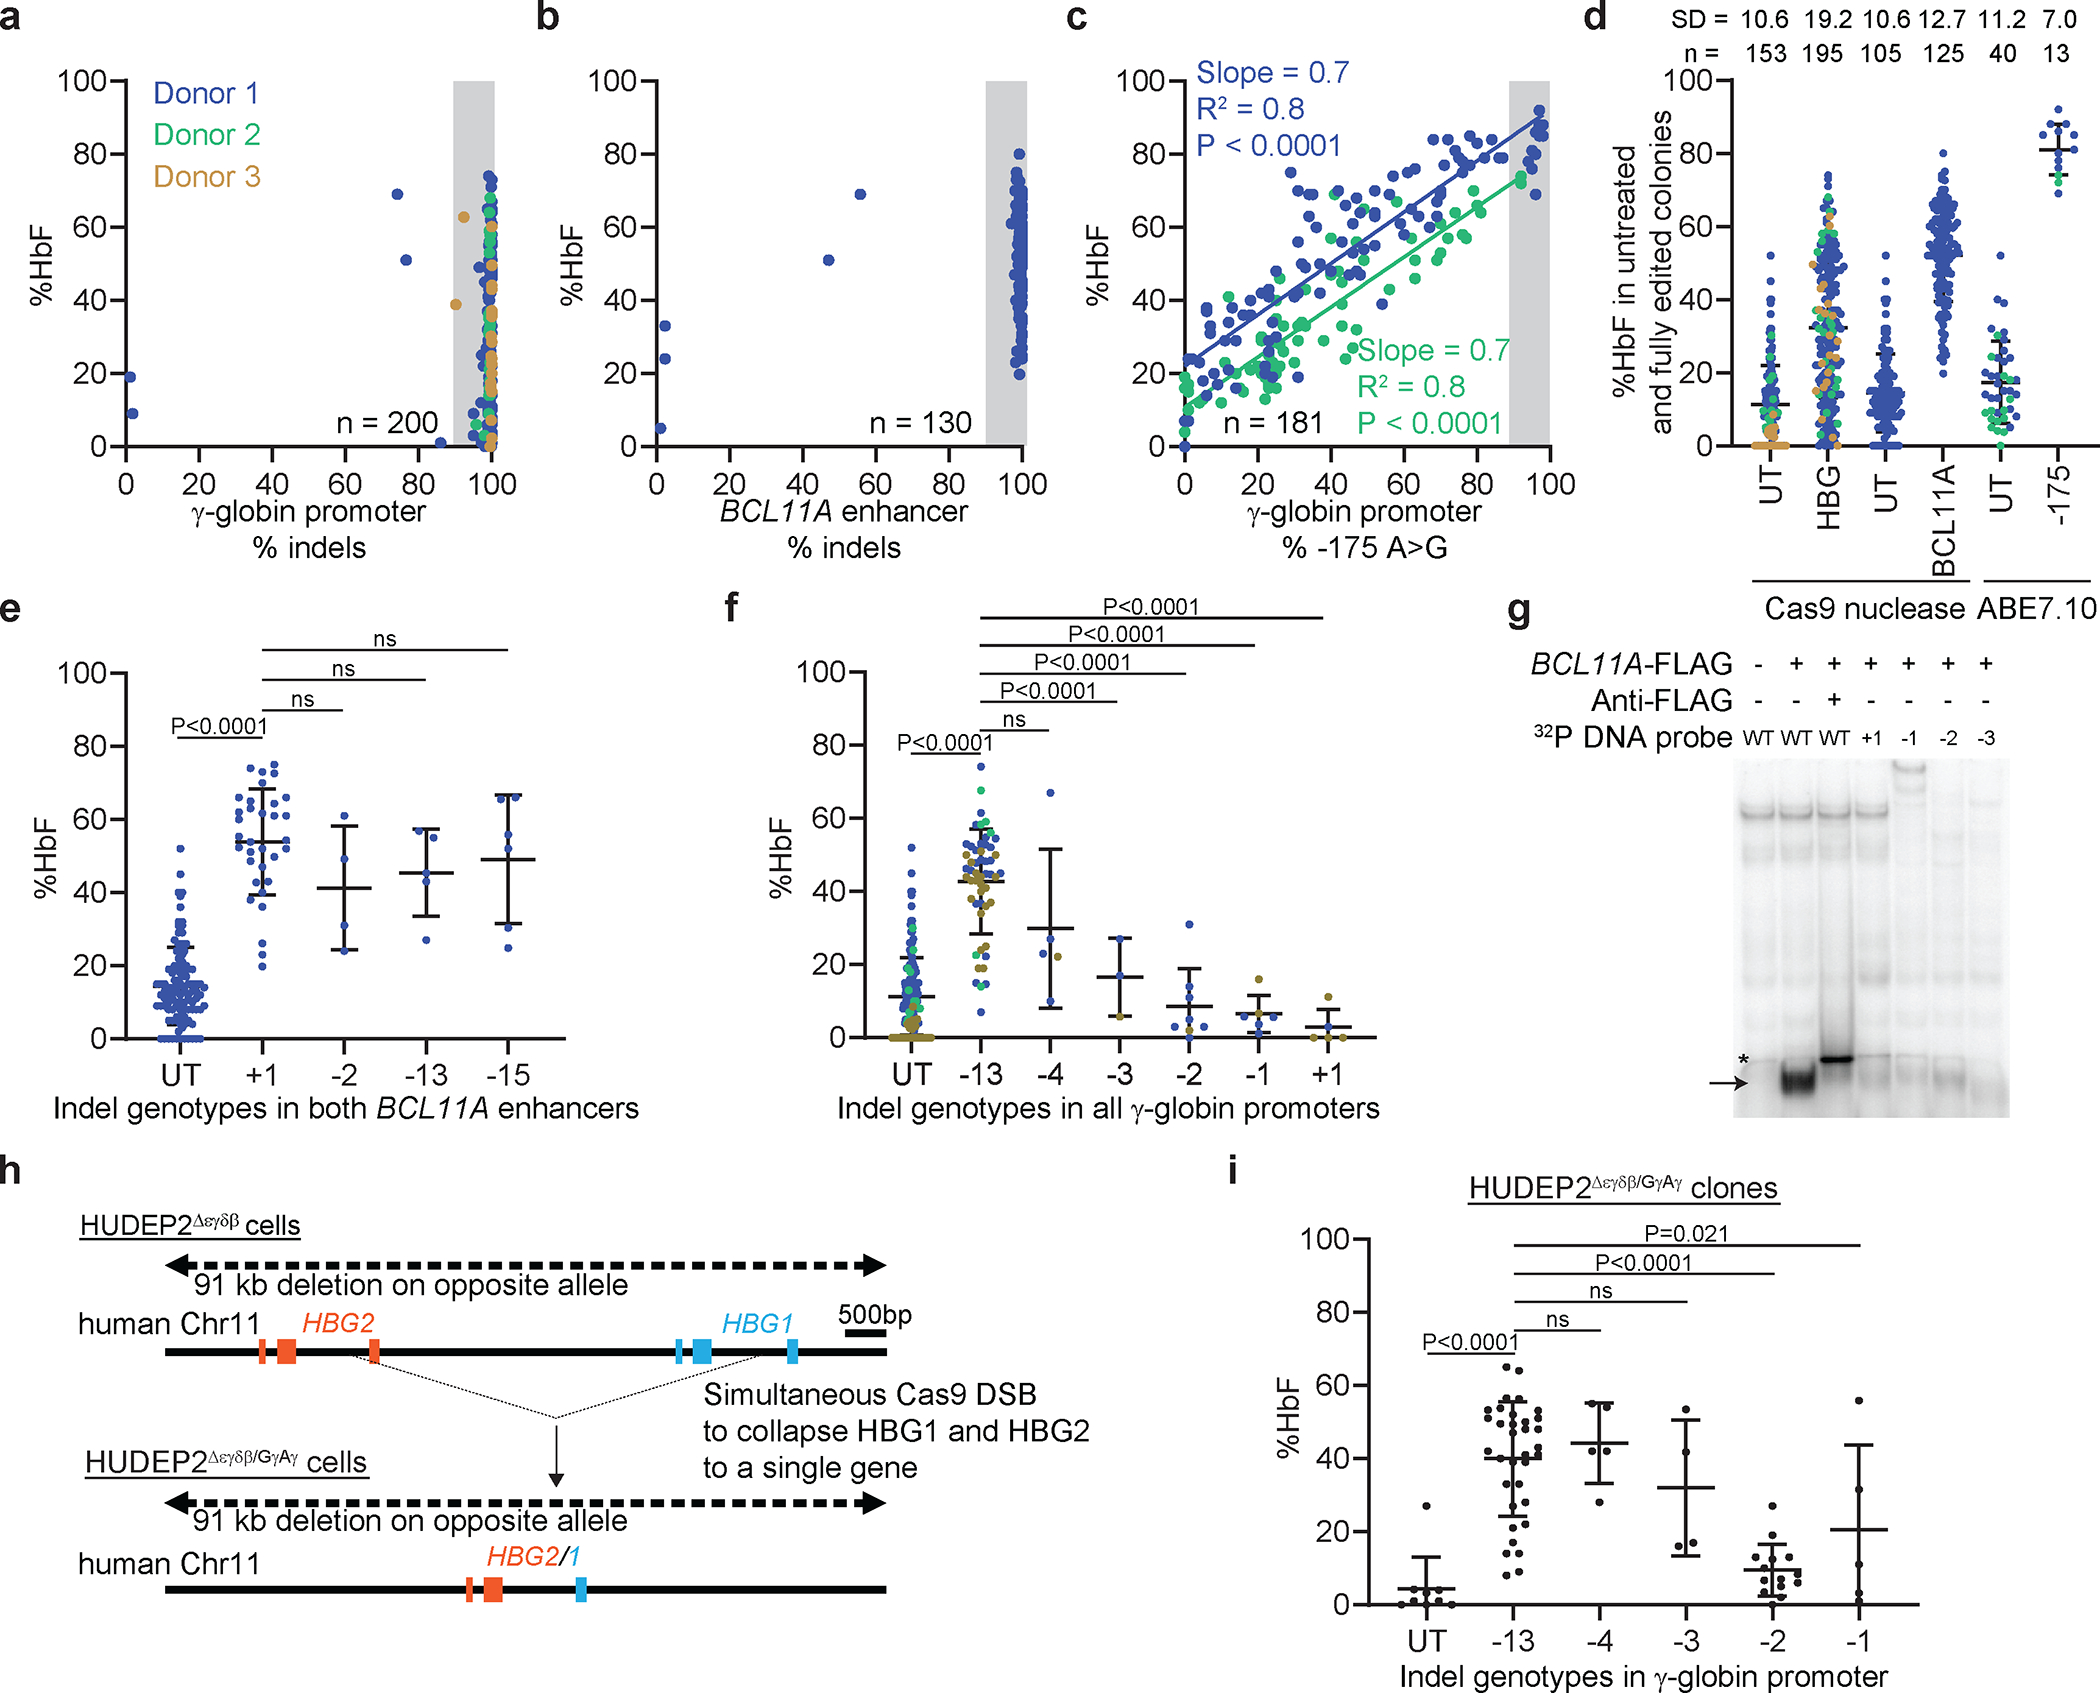
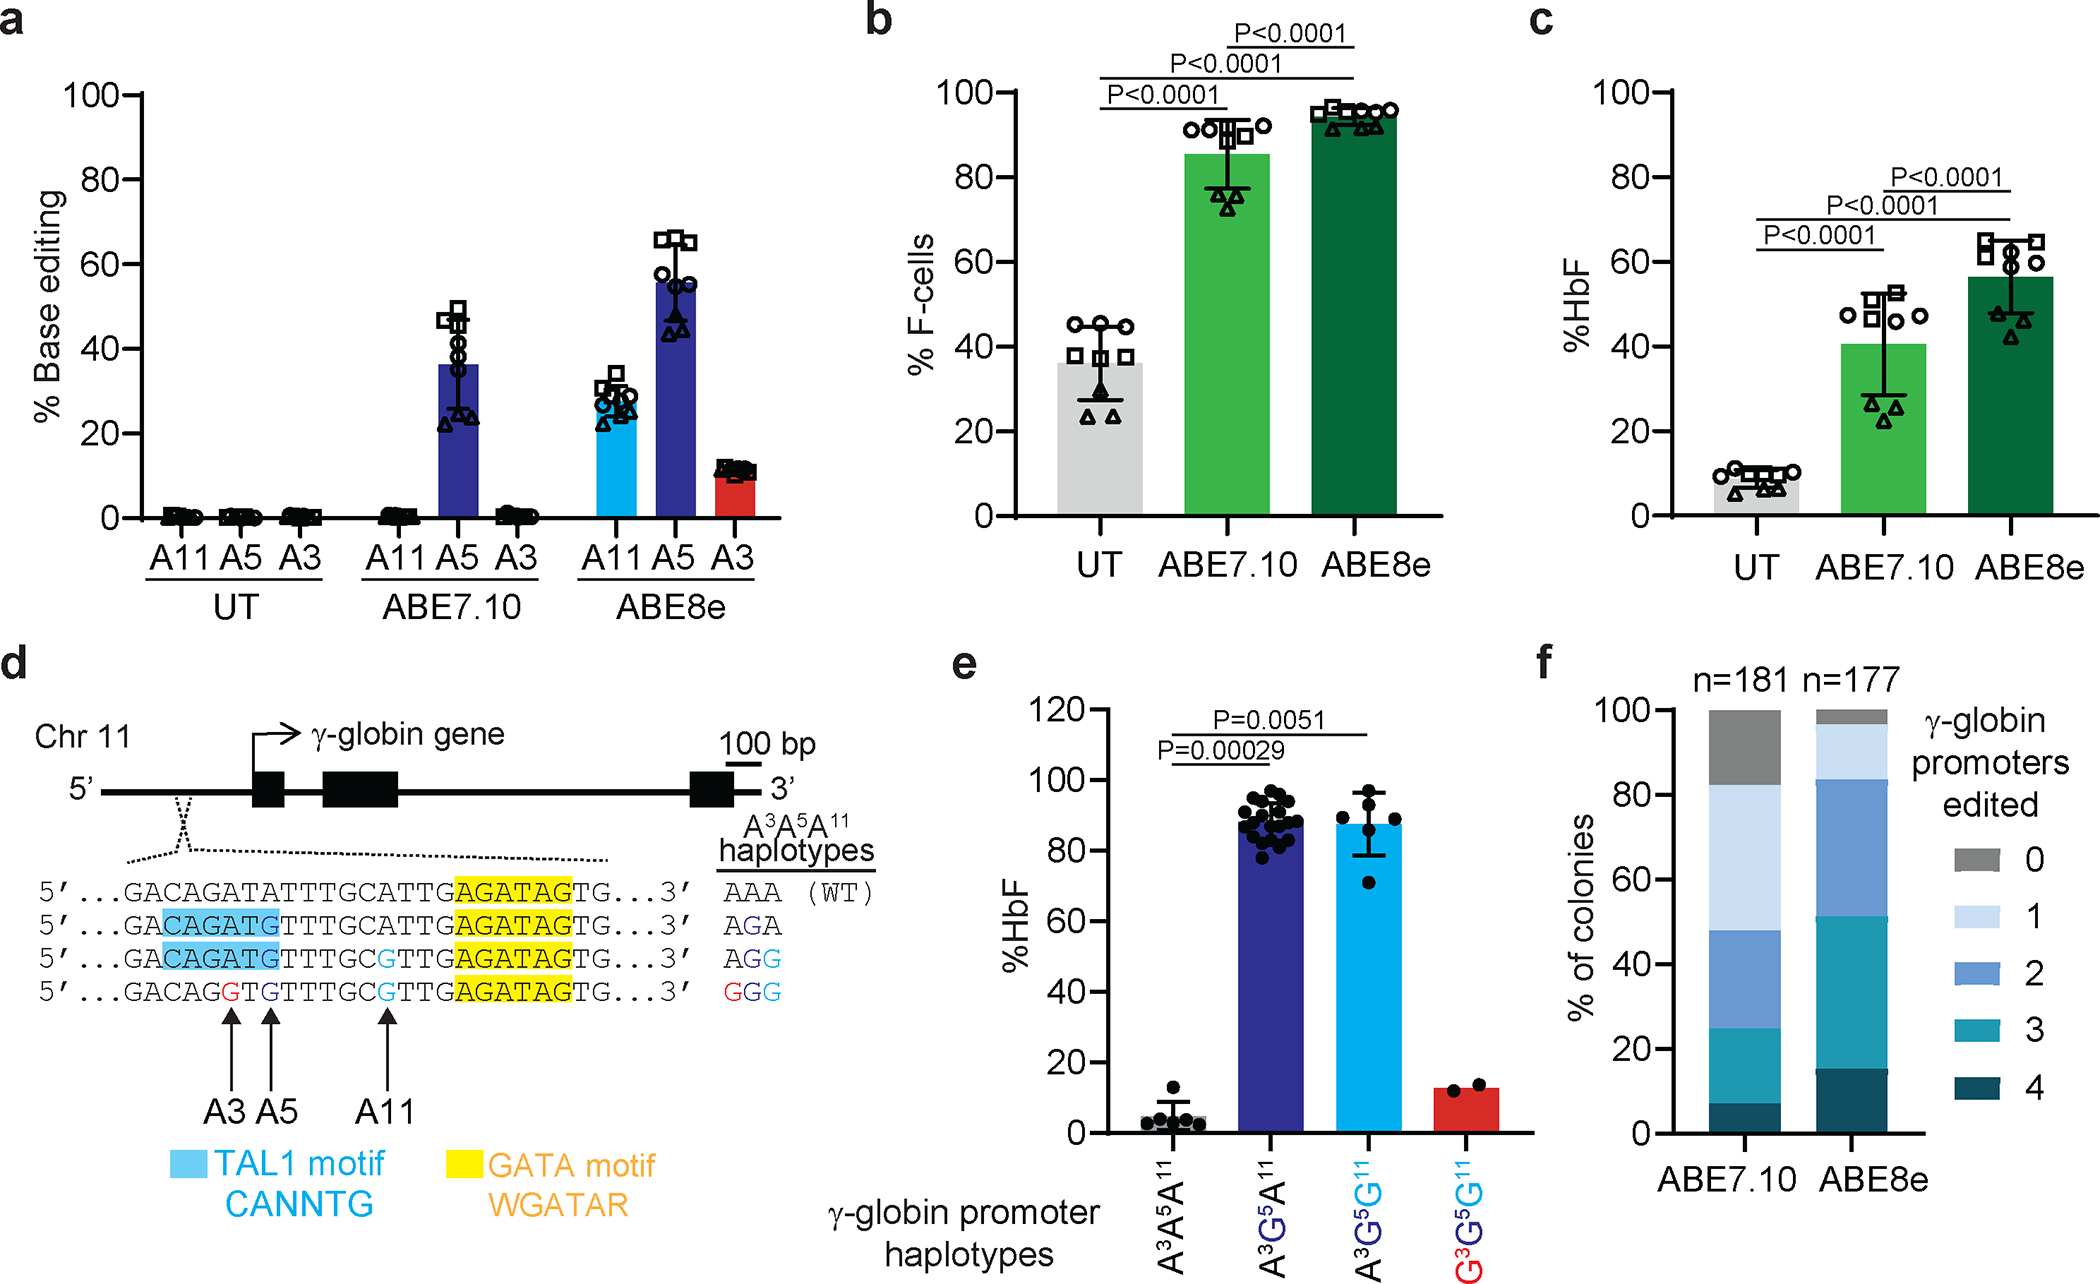
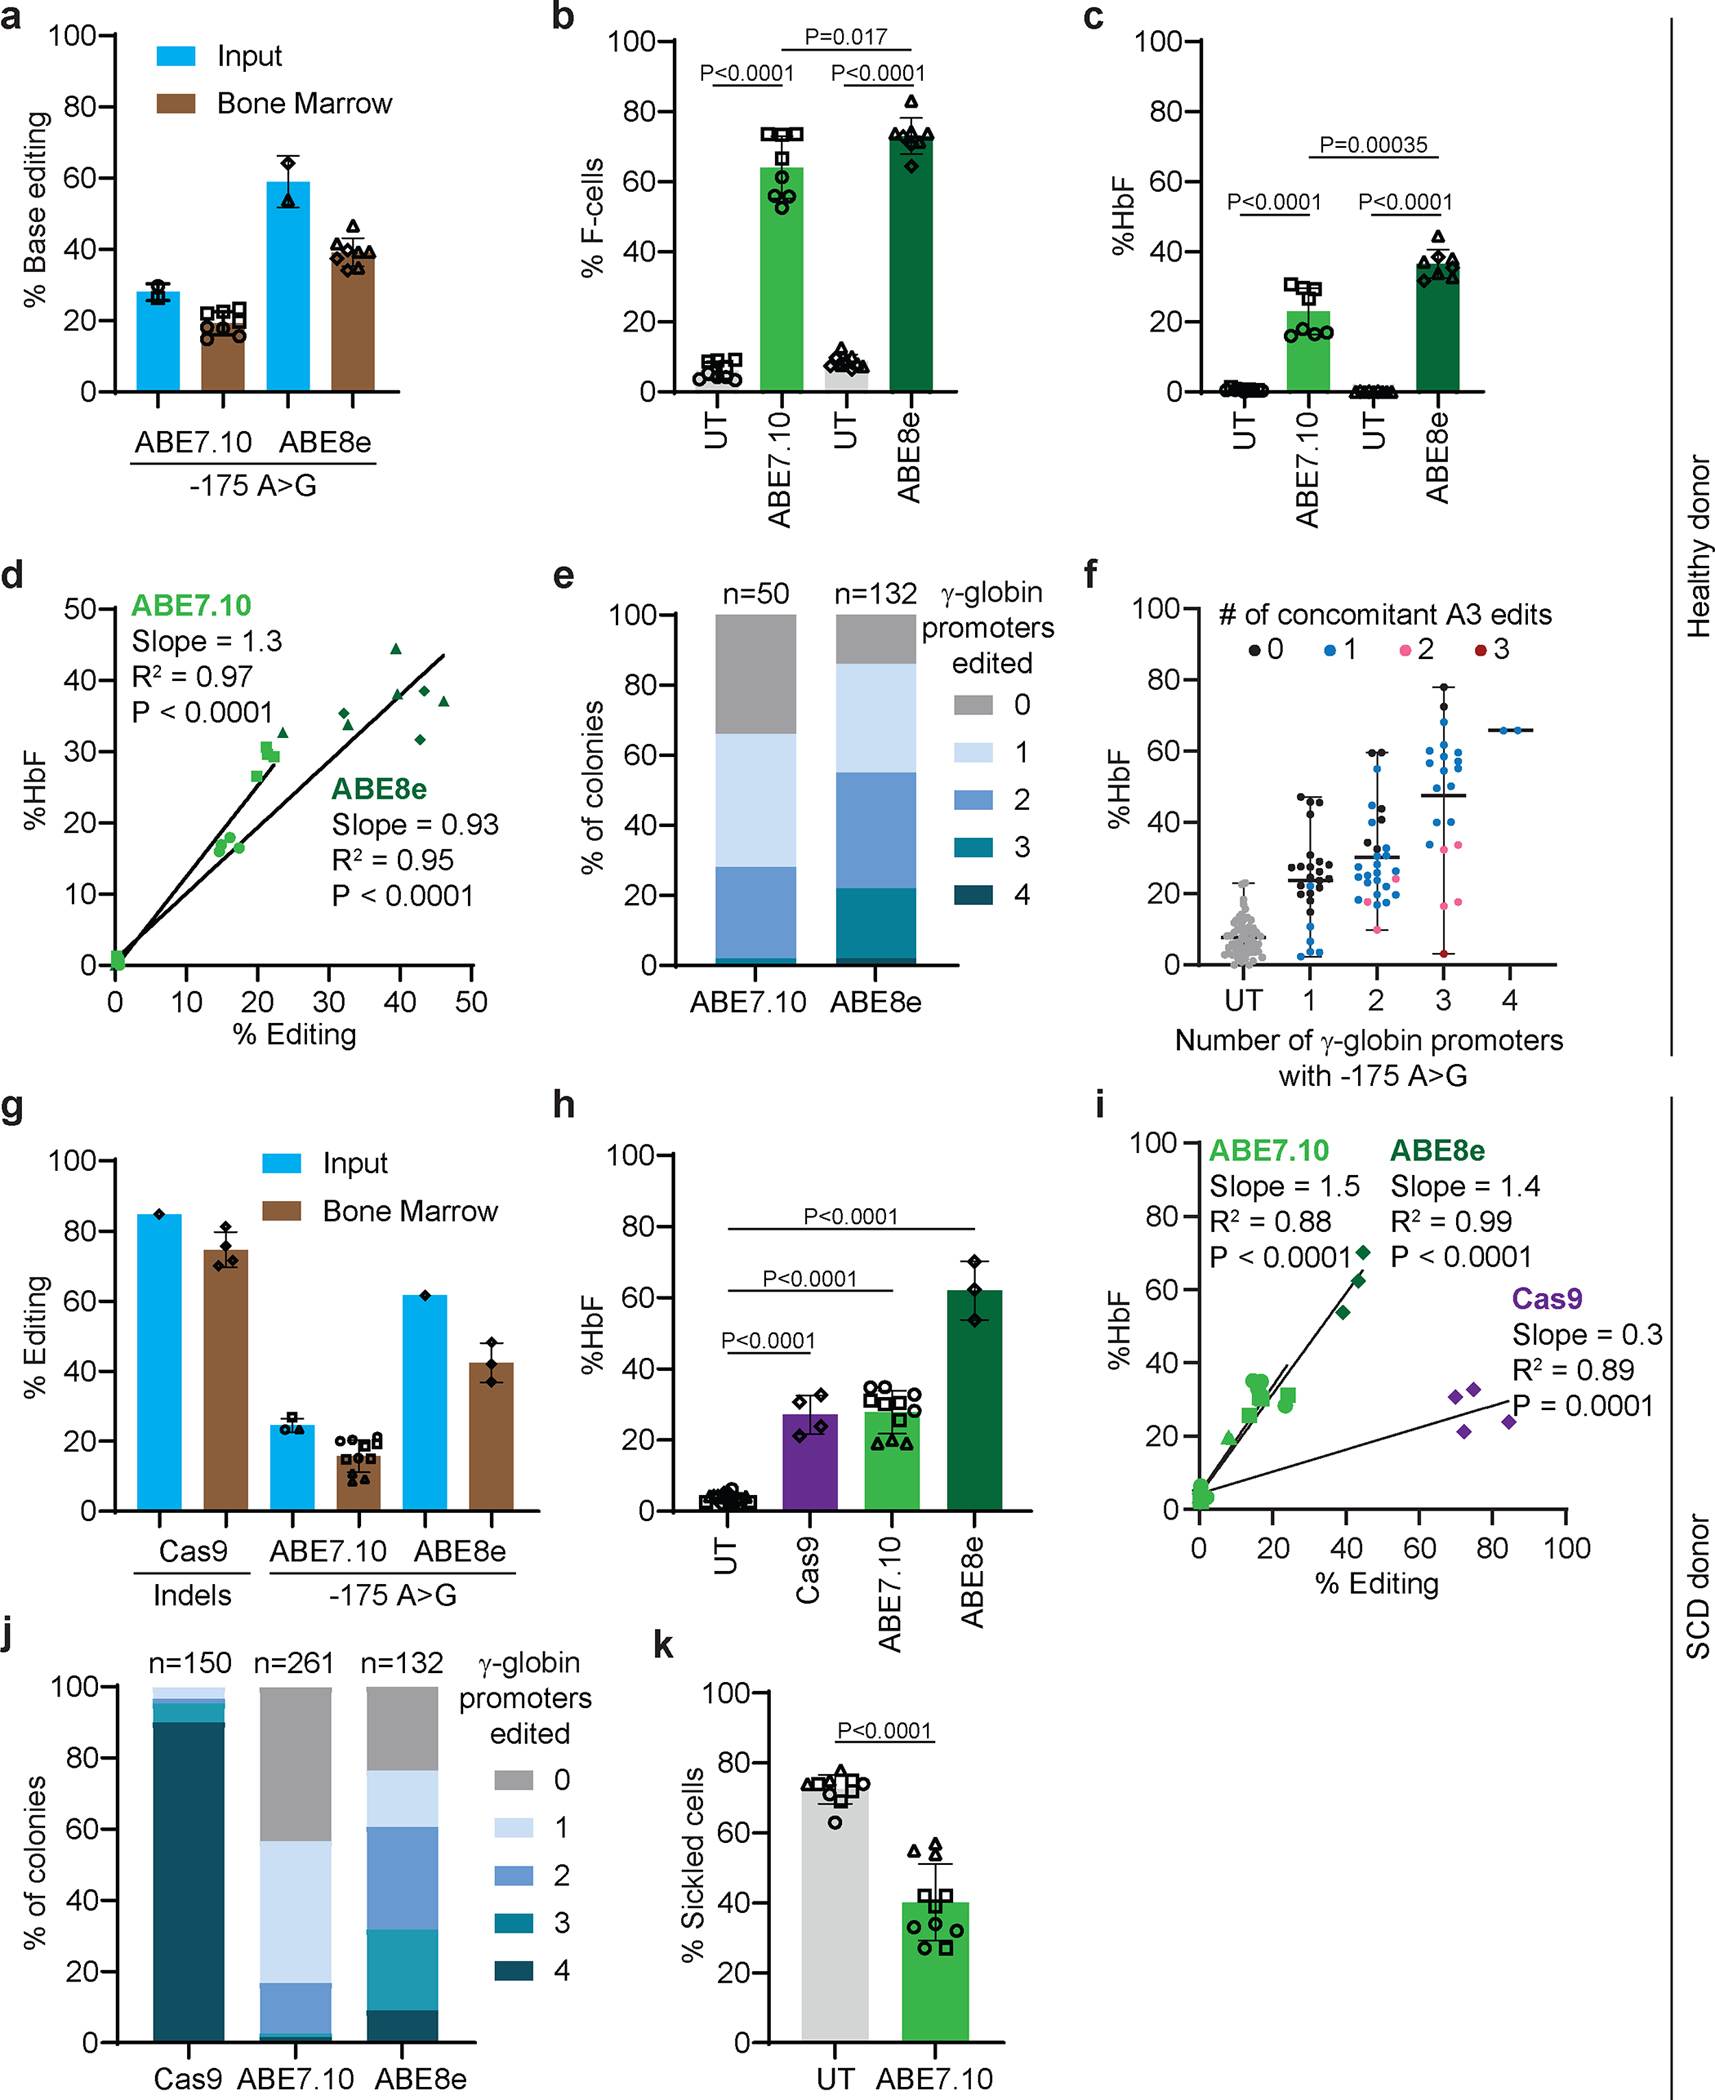
Inducing fetal hemoglobin (HbF) in red blood cells can alleviate β-thalassemia and sickle cell disease. We compared five strategies in CD34+ hematopoietic stem and progenitor cells, using either Cas9 nuclease or adenine base editors. The most potent modification was adenine base editor generation of γ-globin -175A>G. Homozygous -175A>G edited erythroid colonies expressed 81 ± 7% HbF versus 17 ± 11% in unedited controls, whereas HbF levels were lower and more variable for two Cas9 strategies targeting a BCL11A binding motif in the γ-globin promoter or a BCL11A erythroid enhancer. The -175A>G base edit also induced HbF more potently than a Cas9 approach in red blood cells generated after transplantation of CD34+ hematopoietic stem and progenitor cells into mice. Our data suggest a strategy for potent, uniform induction of HbF and provide insights into γ-globin gene regulation. More generally, we demonstrate that diverse indels generated by Cas9 can cause unexpected phenotypic variation that can be circumvented by base editing.


Conflict of interest statement

Competing interests

The authors have filed patent applications on genome-editing agents. D.R.L. is a consultant and equity owner of Beam Therapeutics, Prime Medicine, Pairwise Plants, and Chroma Medicine, companies that use genome editing or genome engineering. M.J.W. is a consultant for GSK plc, Cellarity Inc., Novartis, and Dyne Therapeutics. A.S. is a consultant for Spotlight Therapeutics, Medexus Inc., and Vertex Pharmaceuticals. A.S. has also received research funding from CRISPR Therapeutics and honoraria from Vindico Medical Education. A.S. is the St. Jude Children’s Research Hospital site principal investigator of clinical trials for genome editing of sickle cell disease sponsored by Vertex Pharmaceuticals/CRISPR Therapeutics (NCT03745287), Novartis Pharmaceuticals (NCT04443907), and Beam Therapeutics (NCT05456880). The industry sponsors provide funding for the clinical trial, which includes salary support. A.S. has no direct financial interest in these therapies. J.S.Y is an equity owner of Beam Therapeutics. S.Q.T. is a coinventor on patents covering the CIRCLE-seq and CHANGE-seq methods. S.Q.T. is a member of the scientific advisory boards of Kromatid, Inc., and Twelve Bio. The other authors declare no competing non-financial interests.

Figures

Extended Data Fig. 1 |
Insertion/deletion (indel) mutations generated in healthy donor CD34+ hematopoietic stem and progenitor cells (HSPCs) by Cas9 nuclease. a, BCL11A gene (hg19-chr2:60,722,392–60,722,422) showing the target GATA1 binding motif (TGATAA) in the +58 BCL11A erythroid enhancer highlighted in green. The single guide RNA (sgRNA) protospacer and protospacer-adjacent motifs (PAM) are shown in black and red, respectively. The vertical dotted line indicates the Cas9 cleavage site. b, The γ-globin (HBG1/2) gene (HBG2- hg19-chr11:5,276,106–5,276,136; HBG1- hg19-chr11:5,271,182–5,271,212) showing the target BCL11A binding motif (TGACCA) in the promoter highlighted in yellow. c,d, Sequence alignments of the BCL11A and γ-globin genes showing the most common Cas9 indels determined by next generation sequencing (NGS) 3 days after editing. The sgRNA sequences are underlined with PAM in red text. Targeted transcription factor binding motifs are indicated by the orange columns and shown in the wild type (WT) sequences as underlined blue text. Deletions are represented by dashes and insertions by green text. The % of each indel relative to total NGS reads is shown at right. e, Percentage of indels after base editing (n=8 for UT, −198, −175 and −113, n=6 for NT). Bar graphs show mean ± standard deviation (SD). Each symbol represents an independent experiment with different shapes representing unique HSPC donors. UT, untreated. NT, non-targeting gRNA.
Extended Data Fig. 2 |
Erythroid differentiation of CD34+ HSPCs after editing with ABE7.10 complexed with sgRNA −175 or Cas9 nuclease complexed with sgRNA targeting the BCL11A binding site in the γ-globin promoter, the +58 BCL11A erythroid enhancer or the control locus AAVS1. Cells were edited by electroporation with RNPs, incubated in CD34+ expansion medium for two days, then transferred to erythroid differentiation medium. a, Cell expansion after base editing (n=2 from two donors). b, Cell expansion after Cas9 editing (n=3 from one donor). c, Representative flow cytometry scatter plot showing maturation markers in CD235a+ erythroblasts after 7 and 14 days of in vitro erythroid differentiation. d, Summary of multiple experiments to assess cell maturation using gating strategy depicted in panel c. n=2 replicates each from two donors for ABE7.10 and n=3 from one donor for Cas9. e, Representative flow cytometry scatter plot showing enucleated reticulocytes distinguished by loss of staining with the DNA-binding dye Hoechst 33342 (gated). f, Percentage of enucleated CD235+ erythroid cells (reticulocytes) at differentiation day 21 (n=4 from two donors for ABE7.10 and n=3 from one donor for Cas9). Graphs show mean ± SD. UT, untreated. NT, non-targeting gRNA.
Extended Data Fig. 3 |
Analysis of γ-globin −175 A>G edited HUDEP2 cells. a, HUDEP2Δεγδβ cells harboring a heterozygous 91-kb deletion encompassing the extended β-like globin locus (hg19-chr11:5,219,382–5,324,395) were edited with ABE7.10 protein complexed with sgRNA −175. b, Editing outcomes in γ-globin promoters of HBG2 and HBG1 (hg19-chr11:5,269,501–5,276,395) and nomenclature for clones. c, Representative reverse-phase high performance liquid chromatography (RP-HPLC) chromatograms of lysates from HUDEP2Δεγδβ clones with the indicated genotypes after 10 days of culture in erythroid differentiation medium. Gγ and Aγ refer to the protein products of HBG2 and HBG1, respectively. d, Percentage of β-like globins in HUDEP2Δεγδβ clones with the indicated genotypes. WT, n=5; HBG2175G, n=4; HBG1175G, n=2; HBG1/2175G, n=6. Bar graphs show mean ± SD with each dot representing a separate clone. LCR, locus control region. WT, wild type.
Extended Data Fig. 4 |
DNA damage response and 4.9-kb deletion analysis of ABE7.10-edited or Cas9 nuclease–edited HSPCs. Healthy donor CD34+ cells were edited by electroporation with Cas9 nuclease protein complexed with sgRNA targeting the γ-globin promoter BCL11A binding motif or ABE7.10 protein complexed with sgRNA −175. a, Frequencies of on-target ABE7.10 edits or Cas9 nuclease indels measured by NGS. b, Relative expression of CDKN1 (p21) mRNA vs. hours after electroporation, measured by droplet digital PCR (ddPCR) and normalized to RPP30 mRNA. c, Quantitative PCR detection method used to assess the frequency of the 4.9-kb HBG2–HBG1 intergenic deletion resulting from simultaneous on-target indels. d, Percentage of the 4.9-kb deletion after editing by ABE7.10 or Cas9 nuclease. Graphs show mean ± SD (n=3 independent replicates from one CD34+ cell donor). P values were determined using a two-sample t-test to assess differences between the Cas9 nuclease-treated samples and the electroporated control. UT, untreated.
Extended Data Fig. 5 |
Dose-titration of Cas9 nuclease RNP targeting the BCL11A binding site in the γ-globin promoters. Healthy donor CD34+ HSPCs were electroporated with the indicated doses of Cas9 complexed to the sgRNA shown in Extended Data Fig. 1b, followed by induced erythroid differentiation. a, Indel frequencies at day 3. b, Distributions of specific indels at day 3. c, Relative expression of CDKN1 (P21) mRNA vs. hours after electroporation d, Percentage of alleles with the 4.9-kb deletion at day 6. e, Percentage of HbF on day 21 of erythroid differentiation. Graphs show mean ± SD (n=3 independent replicates from one CD34+ cell donor).
Extended Data Fig. 6 |
Effect of the −175 A>G edit on HbF and transcription factor binding in WT HUDEP2 cells (β-globin-like globin loci intact). HUDEP2 cells were electroporated with ABE7.10 protein complexed with sgRNA −175. Negative controls included untreated cells (UT) that received no electroporation and cells electroporated with ABE7.10 protein complexed with AAVS1 sgRNA. a, Frequencies of on-target (A5) and bystander (A3, A11) γ-globin edits 3 days after electroporation. b, Frequencies of AAVS1 edits at 3 days after electroporation. c, % F-cells in the bulk edited population on day 4 after electroporation. d, %HbF in the bulk-edited population after 10 days of erythroid maturation. Graphs show mean ± SD (n=3). e, CUT&RUN analysis to assess chromatin occupancy of TAL1, GATA1, LDB1, and LMO2 in a wild type (WT) HUDEP2 clone or a clone with −175 A>G base edits at all four γ-globin promoters. f, Model for HbF induction by −175 A>G. The −175 A>G variant creates a new TAL1 binding motif near a GATA motif that binds GATA1. Binding of TAL1 stimulates recruitment of the indicated proteins. Homodimerization of LDB1 within the γ-globin promoter protein complex and a similar complex at the locus control region (LCR) mediates DNA looping and transcriptional activation. WT, wild type; UT, untreated.
Extended Data Fig. 7 |
Induction of HbF according to the frequency of common indels alleles in erythroid colonies generated from Cas9 nuclease-edited or base edited CD34+ cells. a–f, Percentage of HbF according to the frequency of the specified indel in the γ-globin promoter BCL11A motif. Most colonies analyzed have indels at all γ-globin promoters (see main Fig. 3a, b). Colonies have 0% of a given indel allele if the indicated indel was not detected by sequencing that colony (n=353). g–j, Percentage of HbF according to the frequency of the specified indel in the +58 BCL11A erythroid gene enhancer (n=228). k, Percentage of HbF according to the frequency of the ABE7.10-generated −175 A>G (n=221). EST, coefficient estimate, corresponding to the slope of the linear regression line, adjusting for batch effects; P, statistical significance calculated by a linear regression model adjusting for batch effects. Each dot represents a separate clone and each color represents a different CD34+ cell donor.
Extended Data Fig. 8 |
Comparison of ABE7.10 and ABE8e editing at γ-globin −175 A>G in healthy donor CD34+ HSPCs. Controls included UT and AAVS1 sgRNA. Cells were edited by electroporation with RNPs, incubated in expansion medium for two days, then transferred to erythroid differentiation medium. a, Results of a Design of Experiment (DoE) study to optimize ABE8e concentration and sgRNA molar ratio (see Methods). Red color indicates most efficient editing. An ABE concentration of 8 μM with a 3.5-fold excess of sgRNA was determined to be optimal and used in subsequent experiments. b, AAVS1 editing frequencies six days after electroporation (n=3). c, Indel frequencies six days after electroporation (n=9 for UT, ABE7.10 and ABE8e −175; n=3 for AAVS1, ABE7.10 and ABE8e). d, Cell viability and e, cell recovery two days after electroporation (n=3). f, %HbF in control edited cells (n=3). g, Cell number versus days erythroid differentiation (n=3). h, Representative flow cytometry scatter plots of maturation markers in CD235a+ erythroblasts after 7 and 14 days of in vitro erythroid differentiation. i, Summary of multiple experiments to assess cell maturation using gating strategy depicted in panel h. n=3 replicates from one CD34+ cell donor. j, Representative flow cytometry scatter plot showing enucleated reticulocytes distinguished by loss of staining with the DNA-binding dye Hoechst 33342 (gated). k, Percentage of enucleated CD235+ erythroid cells (reticulocytes) at differentiation day 21 (n=9 for UT, ABE7.10 and ABE8e −175; n=3 for AAVS1, ABE7.10 and ABE8e). l, Percentage of HbF versus editing frequencies. A linear regression model was used to correlate %HbF with %−175 A>G in panel l (n=9). Each symbol represents a different donor. Graphs show mean ± SD. The slope (coefficient estimate), coefficient of multiple determination (R2), and P values were calculated based on two sample t-test (panel k) and a linear regression model (panel l). UT, untreated; ns, not significant.
Extended Data Fig. 9 |
Durable editing in HSCs. a, Percentage of human CD45+ (hCD45+) donor cells in mouse bone marrow 16 weeks after transplantation. b, Percentages of B cells, myeloid cells, and T cells within the hCD45+ population from mouse bone marrow. c, Percentage of hCD235a+ erythroid cells in mouse bone marrow. d, On-target edits, bystander base edits, and indel frequencies in bone marrow and subpopulations. e, Representative flow cytometry scatter plot of maturation markers in CD235a+ erythroblasts in bone marrow. f, Summary of multiple experiments to assess erythroid cell maturation using gating strategy depicted in panel e. g, Representative flow cytometry scatter plot showing enucleated human reticulocytes in mouse bone marrow, distinguished by loss of staining with the DNA-binding dye Hoechst 33342 (gated). h, Percentage of enucleated hCD235+ erythroid cells (reticulocytes). i, The percentage β-like globin proteins in hCD235a+ erythroid cells recovered from mouse bone marrow. For the experiments assessing ABE7.10, n=9 mice in the untreated samples and n=8 mice in the ABE7.10 treated samples, corresponding to three to five mice transplanted with cells from each of two healthy donors. For the experiments assessing ABE8e, n=9 mice in the untreated samples and n=8 mice in the ABE8e treated samples, corresponding to three to six mice transplanted with cells from each of two healthy donors. All graphs show mean ± SD. Each symbol shape represents cells from a different CD34+ cell donor. UT, untreated. ns, not significant.
Extended Data Fig. 10 |
Durable editing in bone marrow–repopulating HSCs from SCD donors. a, Percentage of hCD45+ donor cells in mouse bone marrow at 16 weeks after transplantation. b, Percentages of B, myeloid, and T cells within the hCD45+ population from mouse bone marrow. c, Percentage of hCD235a+ erythroid cells in mouse bone marrow. d, Representative flow cytometry scatter plot of maturation markers in hCD235a+ erythroblasts in bone marrow. e, Summary of multiple experiments to assess erythroid cell maturation using gating strategy depicted in panel d. f, Representative flow cytometry scatter plot showing enucleated human reticulocytes in mouse bone marrow, distinguished by loss of staining with the DNA-binding dye Hoechst 33342 (gated). g, Percentage of enucleated hCD235+ erythroid cells (reticulocytes). h, On-target edits, bystander base edits, and indel frequencies in different bone marrow populations. i, Indel allele frequencies quantified in cells before transplantation (n=1 donor) and 16 weeks after transplantation (n=4 transplanted mice for Cas9 and n=3 for ABE8e). j, Percentages of β-like globin proteins in hCD235a+ erythroid cells recovered from mouse bone marrow. k, Human reticulocytes isolated from mouse bone marrow were incubated in 2% O2 for 8 h. The sickling assay was performed as two independent experiments from three donors (UT, n=10; ABE7.10, n=11). Representative micrographs show examples of sickled cells. Scale bar = 50 μM. For the experiments assessing ABE7.10, n=10 mice in the untreated samples and n=11 mice in the ABE7.10-treated samples, corresponding to three or four mice transplanted with cells from each of three different SCD donors. For the experiments assessing ABE8e and Cas9 nuclease, n=5 mice in the untreated samples, n=4 mice in the Cas9 treated samples, and n=3 mice in the ABE8e treated samples (all cells from one SCD donor). In panel e, n=2 mice in the ABE8e treated sample because one mouse did not yield sufficient CD235a+ cells for this analysis. All graphs show mean ± SD. Each symbol represents one mouse, with different symbols designating unique HSPC donors. UT, untreated; ns, not significant.
Fig. 1 |
Fig. 1 |. Potent induction of fetal hemoglobin (HbF) with ABE7.10.
a, The γ-globin gene promoter (HBG2; hg-19 chr11:5,276,109–5,276,225, HBG1; hg19-chr11:5,271,185–5,271,301) showing variants that cause HPFH by creating new binding motifs for the transcriptional activators KLF1, TAL1, and GATA1. Promoter binding motifs for the transcriptional repressors ZBTB7A and BCL11A are highlighted in orange and yellow, respectively. Single guide RNA (sgRNA) spacer sequences used to install each variant with adenine base editors (ABEs) are represented as black bars, and protospacer-adjacent motifs (PAMs) are represented as green bars. On-target edits and potential bystander edits are in blue and red fonts, respectively, and are numbered from the 5’ end of the protospacer. Healthy donor human CD34+ HSPCs were electroporated with ribonucleoprotein (RNP) complex consisting of ABE7.10 complexed with sgRNA −198, ABE7.10-NG complexed with sgRNA −175, or ABE7.10 complexed with sgRNA −113. Alternatively, cells were electroporated with Cas9 complexed with sgRNA targeting the AAVS1 site, the γ-globin promoter BCL11A binding motif, or the BCL11A gene erythroid enhancer. Negative controls included untreated (UT) cells or cells transfected with ABE7.10 complexed with non-targeting (NT) sgRNA. Electroporated cells were induced to undergo erythroid differentiation. b, Frequencies of on-target and bystander base edits or Cas9 indels determined by next generation sequencing (NGS) on day 3. c, %HbF immunostained cells (F-cells) measured by flow cytometry at day 14. d, %HbF relative to total hemoglobin in cell lysates, measured by ion-exchange high performance liquid chromatography (HPLC) at day 21. e, %HbF normalized to % editing. All bar charts show data as the mean values ± standard deviation (SD). Each symbol shape represents cells from a different donor. Cas9-treated samples (n=7 for UT, γ-globin and BCL11A for panels b, d and e, n=6 for UT, γ-globin and BCL11A for panel c, n=3 for AAVS1 for panels b-e) and ABE-treated samples (n=8 for UT, −198, −175 and −113, n=6 for NT for panels b-e) were measured in separate experiments, indicated by the vertical dashed line. P values were calculated using a Wilcoxon rank sum test (panel c) or two-sample t-test (panel d and e). ns, not significant.
Fig. 2 |
Fig. 2 |. γ-globin −175 A>G generates a TAL1-GATA1 binding motif that stimulates promoter–enhancer interactions.
a, Mutational analysis of the composite motif (HBG2; hg19-chr11:5,276,179–5,276,203, HBG1; hg19-chr11:5,271,255–5,271,279) in HUDEP2Δεγδβ cells, which are heterozygous for a 91-kb deletion of the β-like globin gene cluster (Extended Data Fig. 3a). The GATA motif, highlighted in yellow, was disrupted by ABE7.10 to generate ΔGATA, followed by ABE7.10-NG installation of −175 A>G, which creates a TAL1 motif, shown in blue. Individual clones were isolated and analyzed after 10 days of induced erythroid maturation. b, %HbF in HUDEP2Δεγδβ cells with the indicated γ-globin promoter genotypes. Each dot represents an individual mutant clone. The bar chart shows the mean ± SD with P values calculated using a Wilcoxon rank sum test. WT, n=8; −175G, n=22; ΔGATA/−175G, n=3. c, CUT&RUN analysis to assess chromatin occupancy of TAL1, GATA1, LDB1, and LMO2. The gray highlighted region is magnified at right. d, Micro-Capture-C analysis to identify long-range chromatin interactions in HUDEP1 cells, which express mainly HbF thus serving as a positive control, and in HUDEP2Δεγδβ clones with the indicated genotypes at both γ-globin promoters (HBG1 and HBG2). Panels show the results experiments with anchors at the LCR HS3 region or the γ-globin promoter. WT, wild type.
Fig. 3 |
Fig. 3 |. Base editing induces HbF more potently and with less clonal variability when compared with Cas9.
In panels a-f and i, healthy-donor CD34+ HSPCs were electroporated with RNPs consisting of Cas9 complexed with sgRNA targeting the BCL11A binding motif in the γ-globin promoter or the BCL11A erythroid enhancer, or with ABE7.10-NG complexed with sgRNA −175. After 3 days, the cells were transferred into methylcellulose medium. Erythroid colonies were isolated and analyzed on day 14. a–c, %HbF vs. % on-target edit. Gray highlighting indicates colonies with ≥87.5% edits (“fully edited“). d, %HbF of fully edited colonies shown in a–c, side by side with UT controls assessed simultaneously with each editing strategy. The SD of the %HbF between colonies for each editing strategy is shown above. e, %HbF in colonies homozygous for the same BCL11A erythroid enhancer indel (UT, n=105; +1, n=33; −2, n=4; −13, n=5; −15, n=6). f, %HbF in colonies with the same indel in all γ-globin promoters (UT, n=153; −13, n=53; −4, n=5; −3, n=3; −2, n=8; −1, n=6; +1, n=5). g, Gel-shift assay results. COS cell extract expressing a FLAG tag fused to zinc fingers 4–6 of BCL11A was incubated with radiolabeled WT or mutant probes representing the γ-globin BCL11A binding motif, separated on a polyacrylamide gel and analyzed by autoradiography. Arrow shows the position of BCL11A bound to WT probe; * denotes antibody-supershifted complex. h, HUDEP2Δεγδβ cells were edited to generate HUDEP2Δεγδβ/Gγ–Aγ cells, which contain a single functional HBG2–HBG1 (Gγ–Aγ) fusion gene (Gγ hg19-chr11:5,269,435–5,269,886, Aγ hg19-chr11:5,275,238–5,276,077). i, %HbF in HUDEP2Δεγδβ/Gγ–Aγ clones harboring specific indels in the γ-globin promoter BCL11A binding motif (UT, n=9; −13, n=34; −4, n=5; −3, n=4; −2, n=14; −1, n=5). For panels a-f, each dot represents an individual colony, and each color represents a different donor. For panel c, the slope (coefficient estimate), the coefficient of multiple determination (R2), and P values were calculated based on the linear regression model. Panels d-f and i shows the mean ± SD with P values (e, f, and i) calculated based on the linear regression model adjusting for batch effects. UT, untreated; ns, not significant.
Fig. 4 |
Fig. 4 |. Improved −175 A>G editing frequency and HbF induction with ABE8e.
For experiments shown in panels a-c and f, healthy donor CD34+ cells were electroporated with RNPs consisting of ABE7.10 or ABE8e protein complexed with sgRNA −175 followed by in vitro erythroid differentiation. a, Frequencies of on-target (A5) and bystander (A3, A11) edits 6 days after electroporation. b, % F-cells on day 14. c, %HbF on day 21. (n=9, from 3 donors). Each symbol represents a separate experiment with different symbols designating unique donors. d, Common haplotypes generated by on-target and bystander editing. e, %HbF in ABE8e-edited HUDEP2Δεγδβ cell clones with the indicated haplotypes at both γ-globin promoters. A3A5A11, n=6; A3G5A11, n=20; A3G5G11, n=6; G3G5G11, n=2. f, Percentages of CD34+ HSPC-derived erythroid colonies with zero to four productive on-target γ-globin promoter edits (A5, not A3) after installation of −175 A>G with ABE7.10 or ABE8e. Bar charts show the mean ± SD with P values calculated by a linear regression model adjusting for donor effects (panels b and c) and by a Wilcoxon rank sum test (panel e). UT, untreated; ns, not significant.
Fig. 5 |
Fig. 5 |. Durable base editing of γ-globin −175 A>G in bone marrow–repopulating HSCs with induction of HbF in erythroid progeny.
CD34+ HSPCs from healthy (a–f) or SCD (g–k) donors were electroporated with RNP consisting of ABE7.10 or ABE8e with sgRNA −175, or Cas9 with sgRNA targeting the BCL11A binding site of the γ-globin promoter, then transplanted into NBSGW mice. After 16 weeks, mouse bone marrow (BM) was analyzed for human donor–derived cells. a, Frequencies of on-target (A5) editing 3 days after electroporation (input, n=2) and in donor-derived cells in BM after transplantation (n=8). b-d, Human CD235+ (hCD235+) erythroblasts in BM analyzed for %F-cells (b), %HbF (c), and %HbF vs. on-target editing efficiency (d) (UT, n=9; ABE7.10 and ABE8e, n=8). e, Percentages of BM–derived human erythroid colonies with zero to four productive on-target edits (A5, not A3). f, %HbF according to the number of γ-globin promoters with the −175 A>G edit (A5). Each dot represents an individual colony, with colors indicating the number of A3 bystander edits per colony (UT, n=59; 1, n=26; 2, n=29; 3, n=21; 4, n=2). g, Frequencies of on-target (A5) editing in input SCD HSPCs (n=3 for ABE7.10 and n=1 for ABE8e and Cas9) and in donor-derived cells in BM after transplantation (ABE7.10, n=11; ABE8e, n=3; Cas9, n=4). h, %HbF and i, %HbF versus on-target editing efficiency in hCD235a+ erythroblasts (UT and ABE7.10 alone, n=10; ABE7.10 −175 sgRNA, n=11; UT, ABE8e, and Cas9 only, n=5; ABE8e −175, n=3; Cas9, n=4). j, Percentages of BM–derived erythroid colonies with zero to four productive on-target edits (A5, not A3). k, Percentage of sickled cells in BM–derived human reticulocytes exposed to hypoxia (UT, n=10; ABE7.10, n=11). Bar charts show mean ± SD. For panels b, d, h, i, and k, P values were calculated using a linear regression model, adjusting for batch effects (panels b, h, and k). For panel c, P values were calculated using the Fisher’s combination test on the P values obtained by t-test. Each symbol (except for “input”) represents one mouse, with different symbols designating unique donors. UT, untreated.
Fig. 6 |
Fig. 6 |. Off-target editing by ABE7.10 or ABE8e.
a, CD34+ HSPCs from two different healthy donors indicated by different symbols were treated with ABE RNPs containing sgRNA −175. After six days, the potential off-target editing sites identified by CIRCLE-seq and/or Cas-OFFinder (212 sites) were evaluated by multiplex PCR and NGS. Significant off-target editing was observed in three sites and one additional site approached significance. Editing is calculated as the number of reads with an A•T-to-G•C transition mutation within the editing window (nucleotides 4–10 of the protospacer alignment) divided by the total number of reads. Three replicates for each of two different donors (n=6) were quantified for on-target and off-target editing. Off-target base editing was observed after treatment with ABE8e, but not ABE7.10. b,c, Orthogonal R-loop assay to measure Cas9-independent off-target editing with the editing reagents used in this study. HEK293T cells were transfected with plasmids encoding nuclease-inactive S. aureus Cas9 and sgRNA targeting an established genomic test site that leads to high off-target editing when held in an open R-loop. After 24 h, cells were electroporated with ABE8e or ABE7.10 (as mRNA or protein) and sgRNA −175, followed by PCR and NGS to detect base edits. Panel b shows frequencies of the on-target −175 A>G edit (n=3). Panel c shows the frequencies of Cas9-independent off-target editing at the R-loop (n=3). d, Cas9-independent editing of RNA. CD34+ HSPCs were edited as described for panel a, followed by RNA-seq analysis after six days. Bar graph shows the percentage of adenosine-to-inosine RNA modifications by electroporation control (EP ctrl), ABE7.10 RNP, and ABE8e RNP treated CD34+ HSPCs (n=3). The y-axis represents the percentage of A-to-I RNA editing. Each symbol represents an individual CD34+ cell donor. Bar graphs show mean ± SD with P values determined using a linear regression model after adjusting for the donor effect (panel a) and two-sample t-test (panel c and d, except UT vs ABE8e RNP in panel c, which was analyzed using a linear regression model). OT, off-target; UT, untreated; ns, not significant.

References

    1. Piel FB, Steinberg MH & Rees DC Sickle Cell Disease. N Engl J Med 376, 1561–1573 (2017). - PubMed
    1. Taher AT, Musallam KM & Cappellini MD beta-Thalassemias. N Engl J Med 384, 727–743 (2021). - PubMed
    1. Doerfler PA et al. Genetic therapies for the first molecular disease. J Clin Invest 131, (2021). - PMC - PubMed
    1. Esrick EB et al. Post-Transcriptional Genetic Silencing of BCL11A to Treat Sickle Cell Disease. N Engl J Med 384, 205–215 (2021). - PMC - PubMed
    1. Frangoul H et al. CRISPR-Cas9 Gene Editing for Sickle Cell Disease and β-Thalassemia. N. Engl. J. Med. 384, 252–260 (2021). - PubMed

Publication types