Review
. 2023 Jul;3(7):776-790.
doi: 10.1038/s43587-023-00446-6. Epub 2023 Jul 3.

Spatial mapping of cellular senescence: emerging challenges and opportunities

Affiliations
Review

Spatial mapping of cellular senescence: emerging challenges and opportunities

Aditi U Gurkar et al. Nat Aging. 2023 Jul.

Abstract

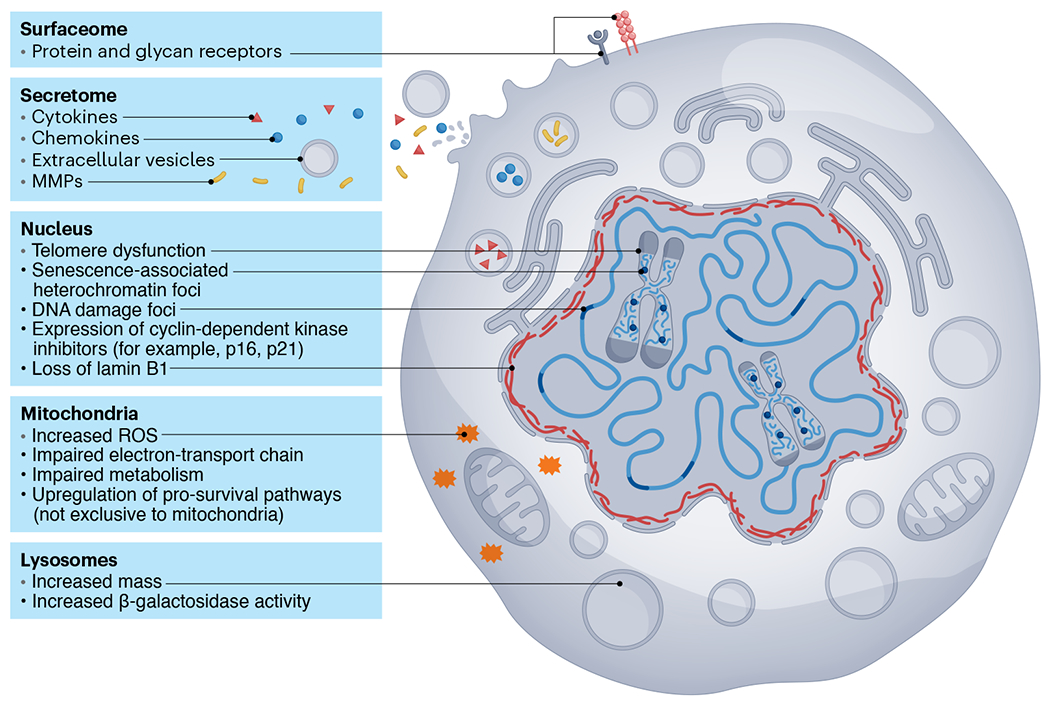
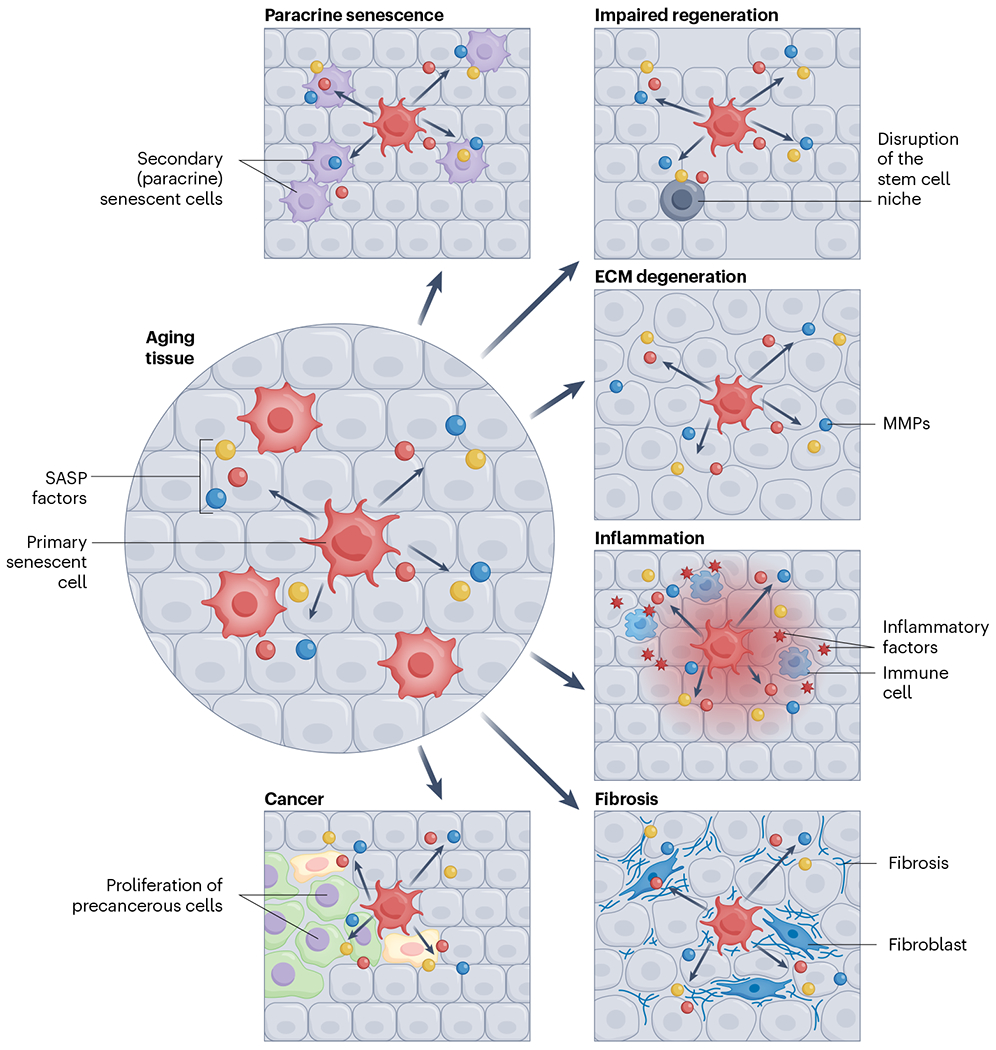
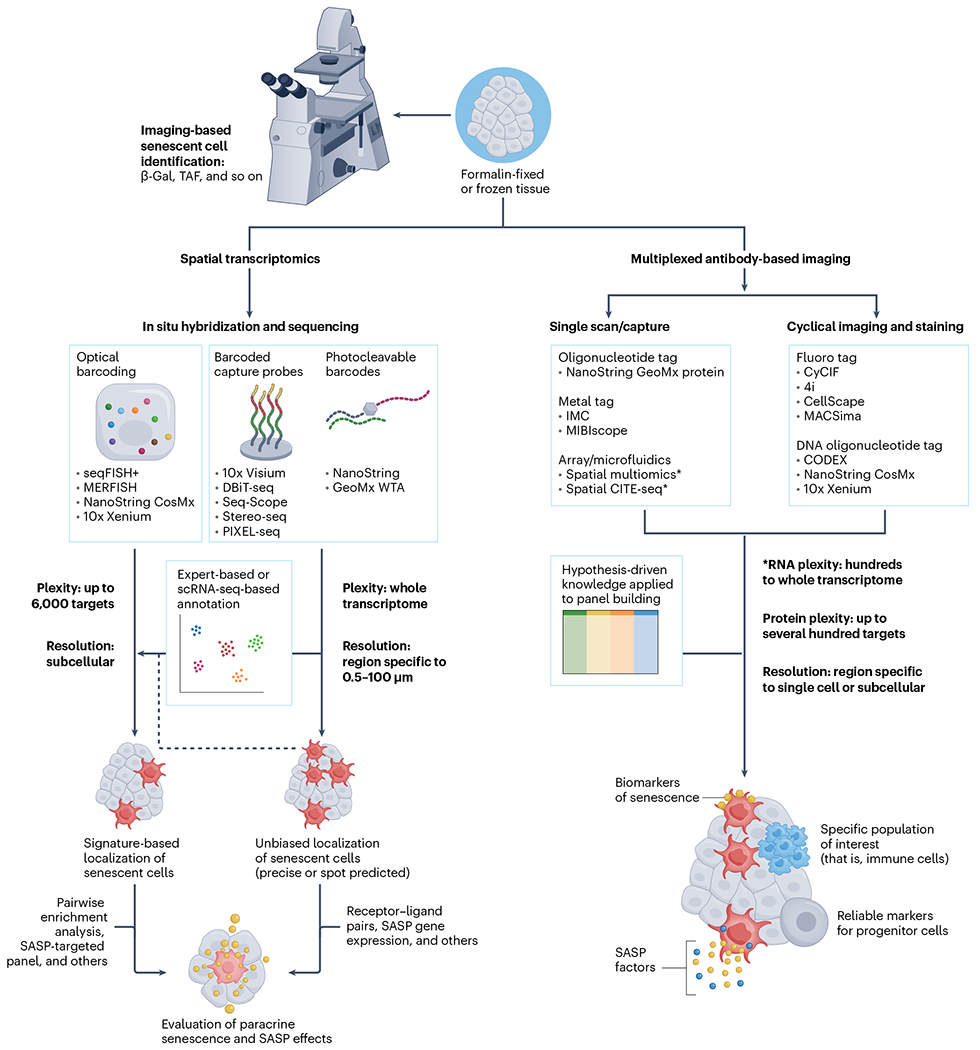
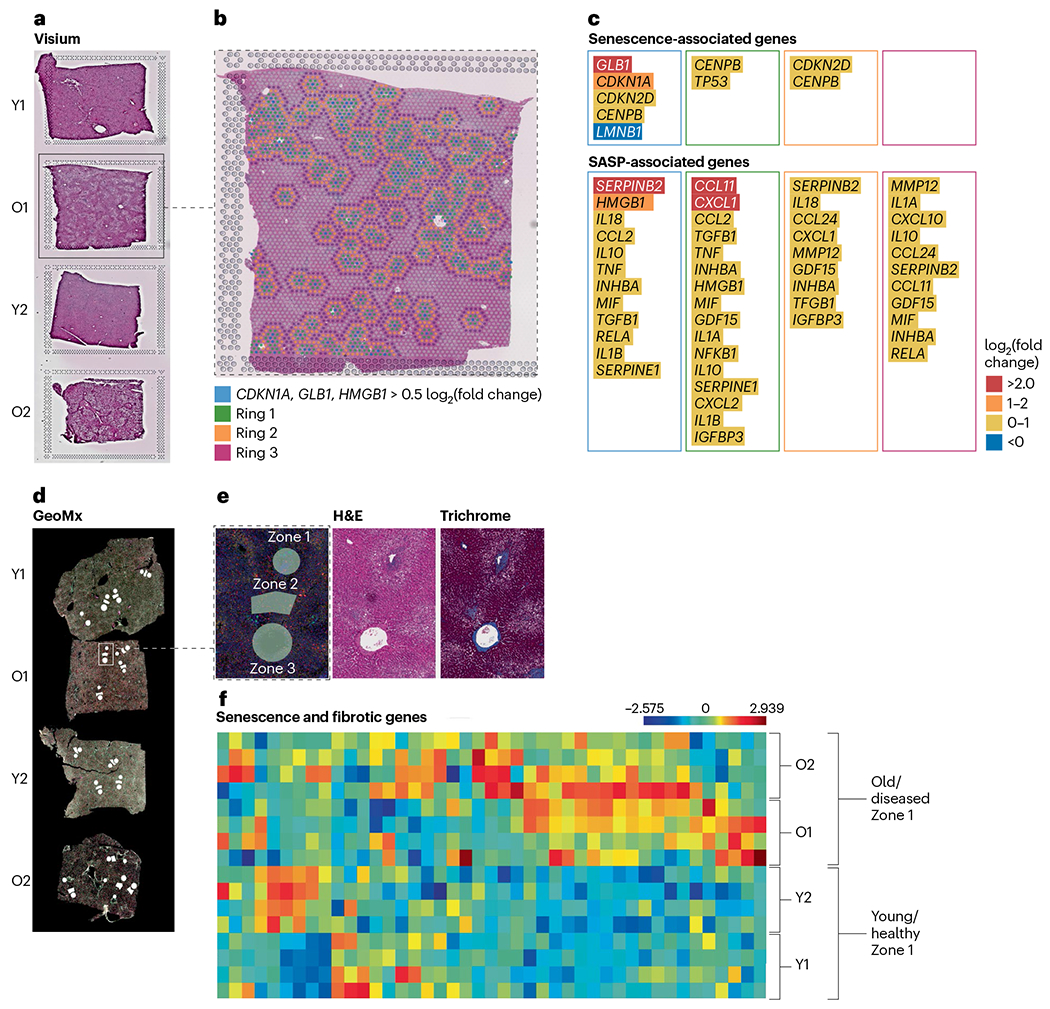
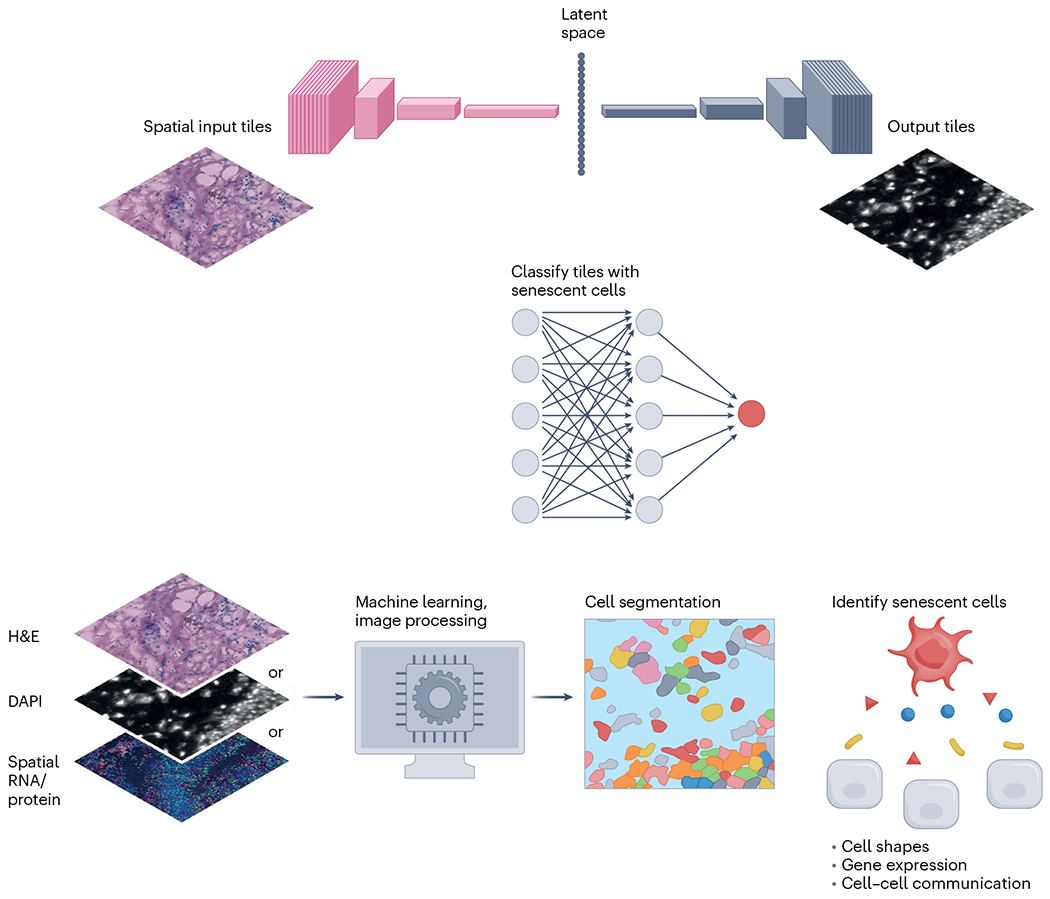
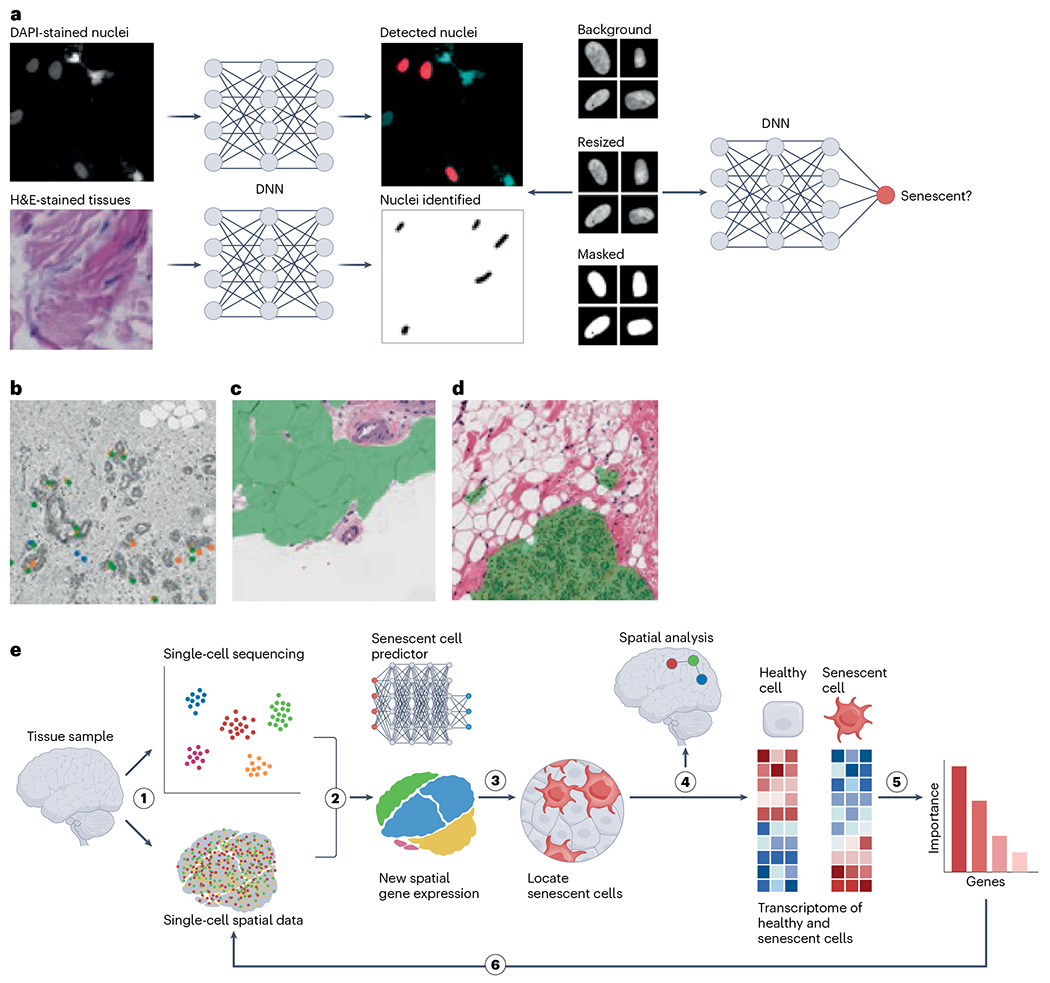
Cellular senescence is a well-established driver of aging and age-related diseases. There are many challenges to mapping senescent cells in tissues such as the absence of specific markers and their relatively low abundance and vast heterogeneity. Single-cell technologies have allowed unprecedented characterization of senescence; however, many methodologies fail to provide spatial insights. The spatial component is essential, as senescent cells communicate with neighboring cells, impacting their function and the composition of extracellular space. The Cellular Senescence Network (SenNet), a National Institutes of Health (NIH) Common Fund initiative, aims to map senescent cells across the lifespan of humans and mice. Here, we provide a comprehensive review of the existing and emerging methodologies for spatial imaging and their application toward mapping senescent cells. Moreover, we discuss the limitations and challenges inherent to each technology. We argue that the development of spatially resolved methods is essential toward the goal of attaining an atlas of senescent cells.


Conflict of interest statement

Competing interests

J.H.L. is an inventor on pending patent applications related to Seq-Scope. All other authors declare no competing interests.

Figures

Fig. 1 |
Fig. 1 |. Senescence is a complex cell fate that alters almost every aspect of cell biology.
Some changes observed during senescence involve (1) alterations in protein and glycan receptors, (2) a pro-inflammatory SASP, (3) multiple nuclear abnormalities, such as DNA damage, telomere dysfunction, chromatin alterations and modifications to the nuclear envelope, (4) mitochondrial dysfunction and (5) changes in lysosomal mass and functionality. MMP, matrix metalloproteinase; ROS, reactive oxygen species.
Fig. 2 |
Fig. 2 |. Senescence communicates with neighboring cells and alters their function via the SASP.
Senescent cells can (1) spread senescence to surrounding cells, (2) disrupt stem cell niches and thereby impair tissue regeneration, (3) lead to extracellular matrix (ECM) degeneration, resulting in aberrant tissue architecture, (4) drive the recruitment of immune cells and exacerbate tissue inflammation, (5) affect tissue fibrosis and (6) stimulate the proliferation of precancerous cells.
Fig. 3 |
Fig. 3 |. Spatially resolved methods for mapping senescent cells and studying senescence-associated pathology.
Three major approaches that have been proposed or are already being used for detection of senescent cells in freshly frozen or FFPE tissue samples. Imaging-based methods require light or a fluorescent microscope and include detection of established features of senescent cells, such as SA-β-Gal or TAF using commercially available assay kits. Various spatial transcriptomic methods can be generally assigned to those using in situ or ex situ sequencing technologies, depending on whether complementary DNA (cDNA) amplification and signal detection are performed at the physical transcript location or whether the transcript location is barcoded using a probe that is hybridized to target RNA, providing spatial information during standard sequencing procedures. Spatial transcriptomic methods can be used for both precise localization of cells expressing signature genes with subcellular resolution or for unbiased identification and investigation of senescence hotspots in larger tissue areas, covering the full transcriptome but trading plexity for spatial resolution. A plethora of downstream analysis techniques can help with evaluation of cellular neighborhoods and the impact of senescent cells on surrounding tissues. Multiplexed antibody-based methods are serving as high-plex, high-throughput approaches to characterize the protein milieu of senescent cells and their neighbors. A key feature of these methods is the ability to focus on specific cell populations or areas with abundance of particular biomolecules of interest (including glycans and lipids) during the data-acquisition step. Depending on the hypotheses or research questions, panels can be built to not only localize and distinguish senescent cells from other cells but also to evaluate (patho-)physiological effects on surrounding tissues by investigating SASP factor distribution and markers of major cellular biology processes, such as the DNA damage, endoplasmic reticulum stress, mitochondrial dysfunction, and so on. WTA, whole transcriptome analysis.
Fig. 4 |
Fig. 4 |. Examples of exploratory strategies used by the University of Minnesota Tissue Mapping Center to identify senescence in liver samples using both the 10x Genomics Visium and the NanoString GeoMx platforms.
Tissues are from old, diseased liver (O1 and O2) or from young, healthy liver (Y1 and Y2). a, A spatial discovery approach was used with the Visium platform. H&E staining of tissues on the Visium slide is shown. b, Identification of 166 senescent spots in tissue O1 with differential expression of three senescence-associated genes (CDKN1A, GLB1 and HMGB1). To investigate paracrine effects of senescence spots, clusters were created for the senescent spots (blue) and the surrounding area using three target rings (green, yellow and purple). c, Senescence and SASP-associated gene expression in each cluster demonstrates that senescence-associated gene expression is highest in the center blue spots, but SASP gene expression is also elevated in the surrounding area. d, A hypothesis-driven approach was used with the GeoMx platform focused on liver anatomical structures to compare senescence gene expression across tissues. ROIs were selected based on liver zone 1 (periportal), zone 2 (mid-lobular) and zone 3 (pericentral) and marked in white on the GeoMx immunofluorescent image. e, ROI selections in O1 using serial sections of H&E and Masson’s trichrome staining for ROI determination. f, Differential gene expression of senescence- and fibrosis-associated genes in zone 1 of all four tissues with increased expression in old, diseased liver (O1 and O2).
Fig. 5 |
Fig. 5 |. Image data analysis of senescent cells.
Top, platform comparisons can be performed by registering image tiles across different technology platforms, such as protein, RNA or H&E, and then identifying key features in a shared latent space through encoder–decoder approaches. Latent space features may be used to more robustly identify tiles containing senescent cells. Bottom, many machine learning or image-processing methods have been developed for segmenting cells from nucleus- or membrane-staining images as well as spatial RNA or protein data. Cell segmentation can be used to define cell shapes or determine gene expression of cells, which can further be used to model cell–cell communication in tissues. Such information is important for identifying senescent cells.
Fig. 6 |
Fig. 6 |. Nuclear morphology predicts senescence in tissues.
a, Workflow for detecting nuclei in culture or tissue, normalizing images and predicting senescence (tissue and cell image samples are reproduced with permission from ref. , Springer Nature America, Inc.). DNN, deep neural network. b, Nuclei with prediction scores above the 95th percentile for several models; orange, replicative senescence model; green, irradiation-induced senescence model; blue, AAD model, which was trained on multiple drug treatments including antimycin A, atazanavir–ritonavir and doxorubicin. c, Segmentation of adipose regions of breast tissue. d, Segmentation of epithelial regions of breast tissue. e, Workflow to identify markers, perform spatial analysis and refine morphology-based predictors by integrating single-cell and spatial transcriptomics.

References

    1. Gorgoulis V. et al. Cellular senescence: defining a path forward. Cell 179, 813–827 (2019). - PubMed
    1. Robbins PD et al. Senolytic drugs: reducing senescent cell viability to extend health span. Annu. Rev. Pharmacol. Toxicol 61, 779–803 (2021). - PMC - PubMed
    1. Demaria M. et al. An essential role for senescent cells in optimal wound healing through secretion of PDGF-AA. Dev. Cell 31, 722–733 (2014). - PMC - PubMed
    1. Born E. et al. Eliminating senescent cells can promote pulmonary hypertension development and progression. Circulation 147, 650–666 (2023). - PubMed
    1. Reyes NS et al. Sentinel p16INK4a+ cells in the basement membrane form a reparative niche in the lung. Science 378, 192–201 (2022). - PMC - PubMed

Publication types