. 2023 Jul 3;21(1):241.
doi: 10.1186/s12916-023-02941-4.

Sampling inequalities affect generalization of neuroimaging-based diagnostic classifiers in psychiatry

Affiliations

Sampling inequalities affect generalization of neuroimaging-based diagnostic classifiers in psychiatry

Zhiyi Chen et al. BMC Med. .

Abstract

Background: The development of machine learning models for aiding in the diagnosis of mental disorder is recognized as a significant breakthrough in the field of psychiatry. However, clinical practice of such models remains a challenge, with poor generalizability being a major limitation.

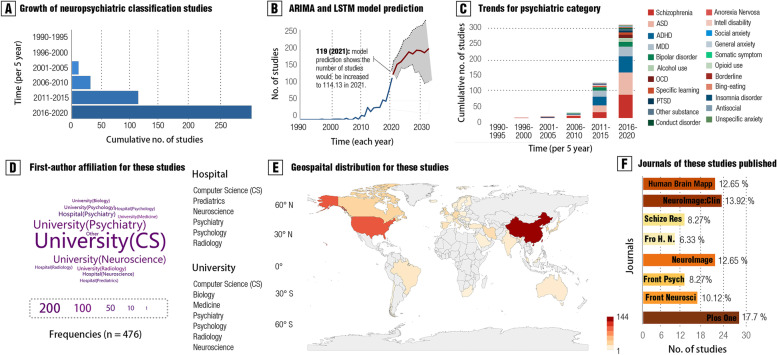
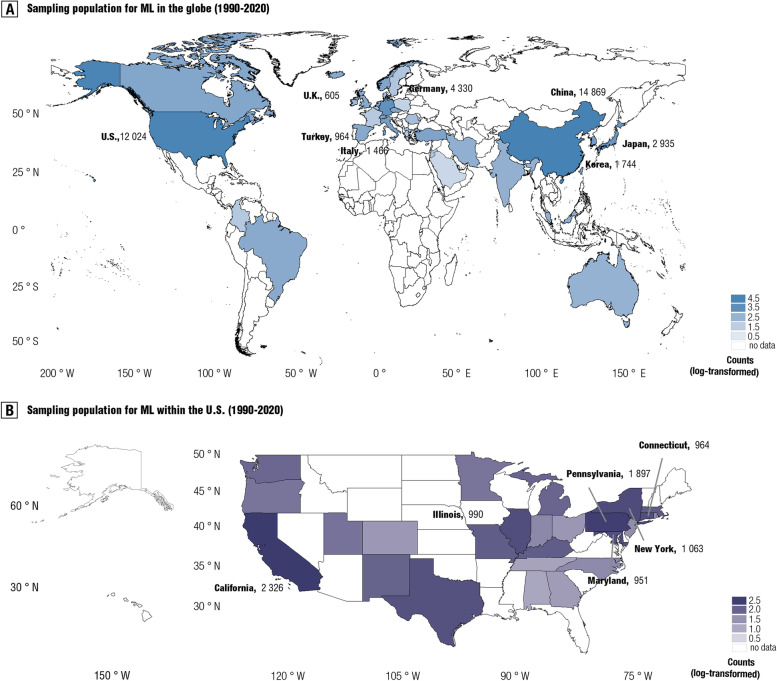
Methods: Here, we conducted a pre-registered meta-research assessment on neuroimaging-based models in the psychiatric literature, quantitatively examining global and regional sampling issues over recent decades, from a view that has been relatively underexplored. A total of 476 studies (n = 118,137) were included in the current assessment. Based on these findings, we built a comprehensive 5-star rating system to quantitatively evaluate the quality of existing machine learning models for psychiatric diagnoses.

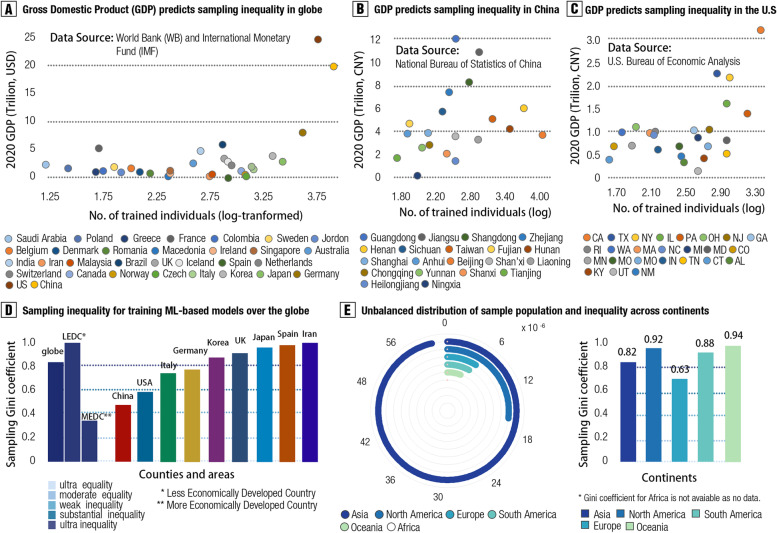
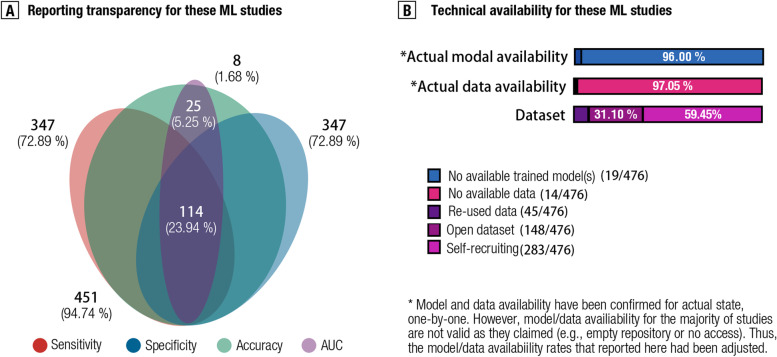
Results: A global sampling inequality in these models was revealed quantitatively (sampling Gini coefficient (G) = 0.81, p < .01), varying across different countries (regions) (e.g., China, G = 0.47; the USA, G = 0.58; Germany, G = 0.78; the UK, G = 0.87). Furthermore, the severity of this sampling inequality was significantly predicted by national economic levels (β = - 2.75, p < .001, R2adj = 0.40; r = - .84, 95% CI: - .41 to - .97), and was plausibly predictable for model performance, with higher sampling inequality for reporting higher classification accuracy. Further analyses showed that lack of independent testing (84.24% of models, 95% CI: 81.0-87.5%), improper cross-validation (51.68% of models, 95% CI: 47.2-56.2%), and poor technical transparency (87.8% of models, 95% CI: 84.9-90.8%)/availability (80.88% of models, 95% CI: 77.3-84.4%) are prevailing in current diagnostic classifiers despite improvements over time. Relating to these observations, model performances were found decreased in studies with independent cross-country sampling validations (all p < .001, BF10 > 15). In light of this, we proposed a purpose-built quantitative assessment checklist, which demonstrated that the overall ratings of these models increased by publication year but were negatively associated with model performance.

Conclusions: Together, improving sampling economic equality and hence the quality of machine learning models may be a crucial facet to plausibly translating neuroimaging-based diagnostic classifiers into clinical practice.

Keywords: Diagnostic classification; Meta-analysis; Neuroimaging; Psychiatric machine learning; Sampling inequalities.


Conflict of interest statement

The authors declare that they have no competing interests.

Figures

Fig. 1
Fig. 1
Trends for research aiming at neuropsychiatric diagnostic prediction (classification) during the recent three decades (1990–2020). A illustrates the growth of the number of studies concerning neuropsychiatric classification from 1995 to 2020. B shows a prediction of the number of relevant studies for future decades based on both the autoregressive integrated moving average (ARIMA) model and the long short-term memory (LSTM) model. The number of relevant studies in 2021 was used as a testing set in the real world. We trained these models with data from 1990 to 2020 and tested them by using real data in 2021 to show the well generalizability. The models predicted the number of relevant studies would be increased to 114.13, and we found that the actual number of these publications in 2021 was 119. C presents trends for each psychiatric category during 1990–2021 (June). D shows the frequencies of first-author affiliation for all the included studies. E mapped the number of countries for the first affiliation in these included studies by using R packages “maptools” and “ggplot2”. F illustrates which journals prefer to publish these studies. The top–bottom rank for these journals was determined by the number of these studies adjusted by the total number of publications per year. The length of the bar shows the proportion of one journal including these studies on all the journals
Fig. 2
Fig. 2
Geospatial model for sample population regarding ML models towards neuropsychiatric classification in the world (A) and USA (B). Both maps were built by 1st administrative grid cell, with each country/region for the globe (251 countries/regions) and state for the USA (51 states). For better readability, we re-scaled the sample size by log-transformation. Sample size for a portion of countries/regions has been shown in these maps. A panel was depicted similarly to the Fig. 2A in our previous article [22], because of the overlapping datasets between them
Fig. 3
Fig. 3
Sampling bias and sampling inequalities in these trained ML models. A provides a scatter plot for the association between GDP and sample size for 32 counties/regions in the globe. B offers a scatter plot showing the association between GDP and sample size for 20 provinces within China. (C) shows the association between GDP and sample size for 25 states within the USA. (D) plots Gini sampling coefficients for the top 10% countries with large sample sizes to train ML models in existing studies, with high Gini value for high sampling inequality. LEDC and MEDC were categorized by World Bank (WB) and International Monetary Fund (IMF) classification. E illustrates the sampling bias and Gini coefficients for each continent. The left panel shows the proportion of the total sample size for training ML models in existing studies on the total sample population for each continent. The right panel shows the Gini coefficient for each continent
Fig. 4
Fig. 4
Methodological considerations for existing ML models towards psychiatric diagnosis. A illustrates increment trends for sample size during the recent three decades by Gaussian kernel density plots. Labeling 2011 sums up all the sample size from 1990 to 2011. B shows the counts for subgroups by dividing these studies according to sample size. C plots the trends of using cross-validation (CV) schemes by accounting counts from all the included studies during the recent three decades. D shows model performance comparisons between independent-sample validation and within-sample validation. The non-parametric W test was used for statistical inferences, with *** for p < .00. Precision-weighted accuracy was estimated by Woo et al. E depicts Gardner-Altman estimation for the classification accuracy comparison between population-within sample and population-across sample. Black dot indicated the point estimate for the mean difference (delta) of the two groups, and the shadow areas showed the distribution estimated by delta. F presents a frequency plot to show case–control skewness
Fig. 5
Fig. 5
Reporting transparency and technical (data and model) availability. A presents patterns of reporting model performance across sensitivity, specificity, balanced accuracy, and area under curve (AUC) by a Venn plot. B sums up the proportion of having actual model availability, data availability, and datasets
Fig. 6
Fig. 6
Neuroimaging-based machine learning model assessment checklist for psychiatry (N-ML-MAP-P). A provides details for five items and scoring criteria in this checklist for evaluating the study quality of all the included studies. B presents a scatter plot for showing the trends of improving study quality during the recent decade (2011–2021). C shows the overall study quality for each psychiatric category in existing studies. This plot is ranked by total quality score, and bars indicate standard error (S.E.). C provides a frequency plot for overall quality scores. D shows the trajectories of study quality for different affiliations, including data/computer science, neuroscience, psychiatry, and others. E draws a scatter plot showing the association between journal quality (i.e., journal impact factor, JIC) and overall quality scores. D provides a scatter plot to show the association of overall quality scores with model accuracy as reported in these studies

References

    1. Jordan MI, Mitchell TM. Machine learning: trends, perspectives, and prospects. Science. 2015;349(6245):255–260. doi: 10.1126/science.aaa8415. - DOI - PubMed
    1. Eyre HA, Singh AB, Reynolds C., 3rd Tech giants enter mental health. World Psychiatry. 2016;15(1):21–22. doi: 10.1002/wps.20297. - DOI - PMC - PubMed
    1. Walter M, Alizadeh S, Jamalabadi H, Lueken U, Dannlowski U, Walter H, Olbrich S, Colic L, Kambeitz J, Koutsouleris N, et al. Translational machine learning for psychiatric neuroimaging. Prog Neuropsychopharmacol Biol Psychiatry. 2019;91:113–121. doi: 10.1016/j.pnpbp.2018.09.014. - DOI - PubMed
    1. Rutherford S. The promise of machine learning for psychiatry. Biol Psychiatry. 2020;88(11):e53–e55. doi: 10.1016/j.biopsych.2020.08.024. - DOI - PubMed
    1. Sui J, Jiang R, Bustillo J, Calhoun V. Neuroimaging-based individualized prediction of cognition and behavior for mental disorders and health: methods and promises. Biol Psychiatry. 2020;88(11):818–828. doi: 10.1016/j.biopsych.2020.02.016. - DOI - PMC - PubMed

Publication types