. 2023 Dec;29(12):4113-4123.
doi: 10.1111/cns.14333. Epub 2023 Jul 3.

Ultrasound reduces inflammation by modulating M1/M2 polarization of microglia through STAT1/STAT6/PPARγ signaling pathways

Affiliations

Ultrasound reduces inflammation by modulating M1/M2 polarization of microglia through STAT1/STAT6/PPARγ signaling pathways

Chin-Hung Hsu et al. CNS Neurosci Ther. 2023 Dec.

Abstract

Introduction: Activated microglia can be polarized to the pro-inflammatory M1 phenotype and the anti-inflammatory M2 phenotype. Low-intensity pulsed ultrasound (LIPUS) can attenuate pro-inflammatory responses in activated microglia.

Objective: This study aimed to investigate the effects of LIPUS on M1/M2 polarization of microglial cells and the regulatory mechanisms associated with signaling pathways.

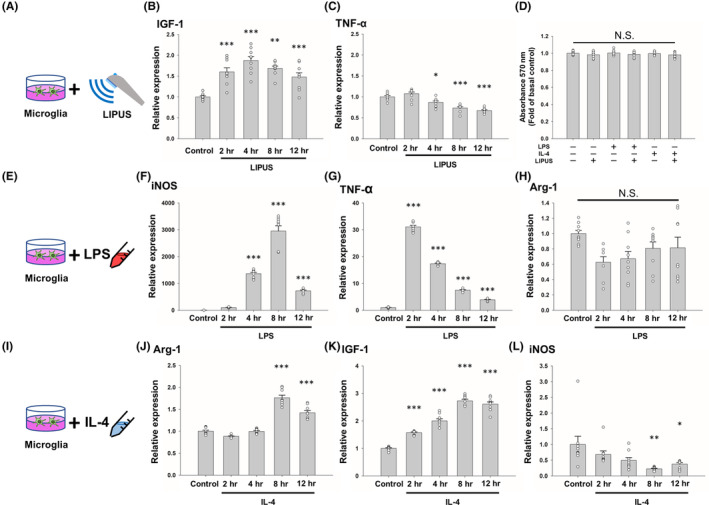
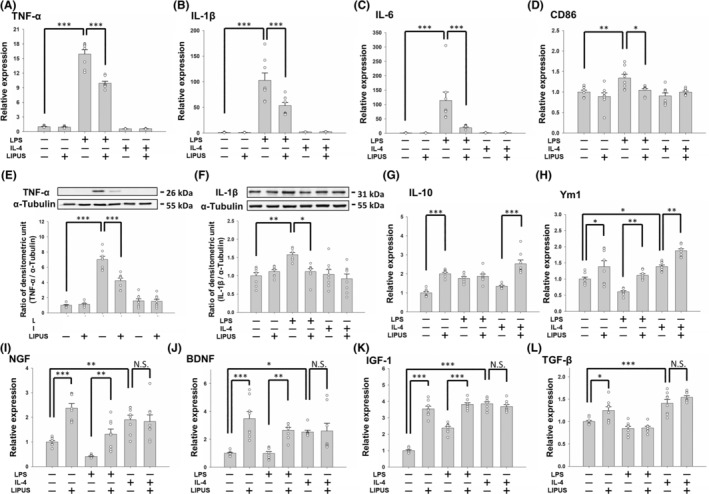
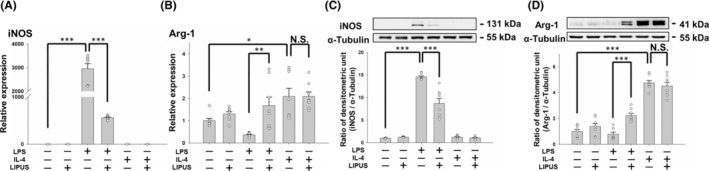
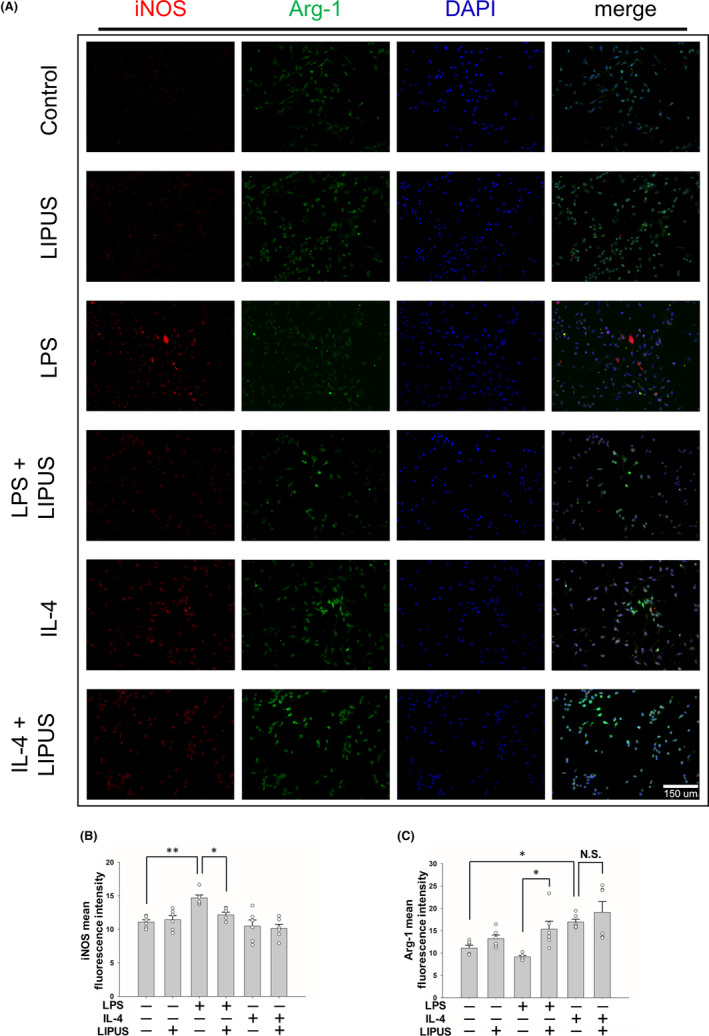
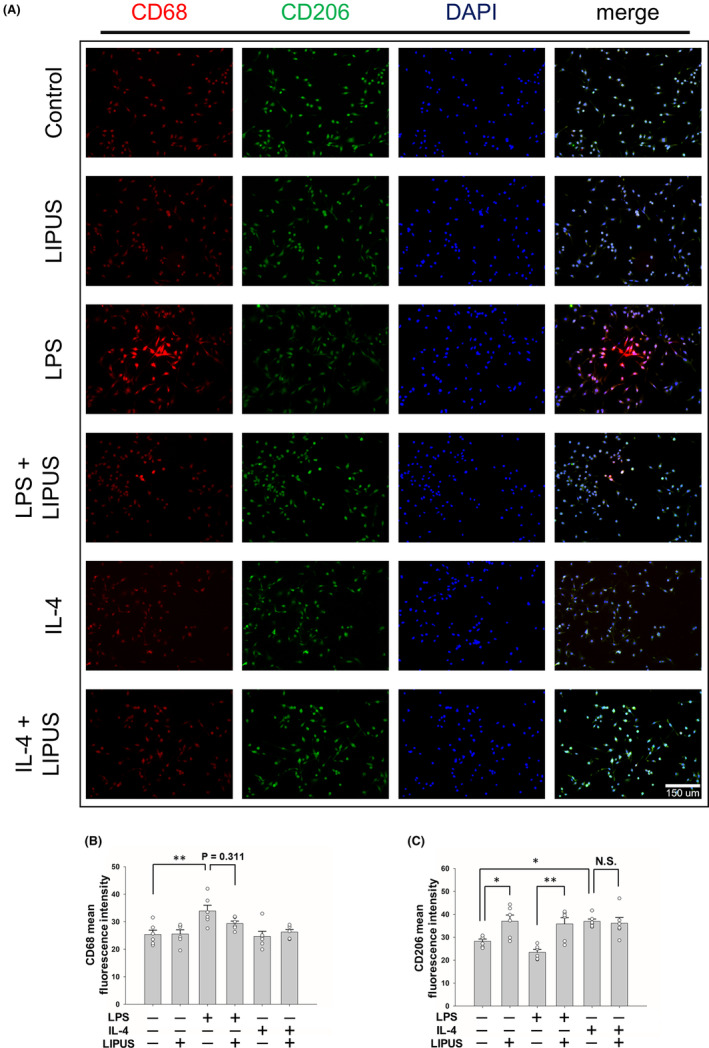
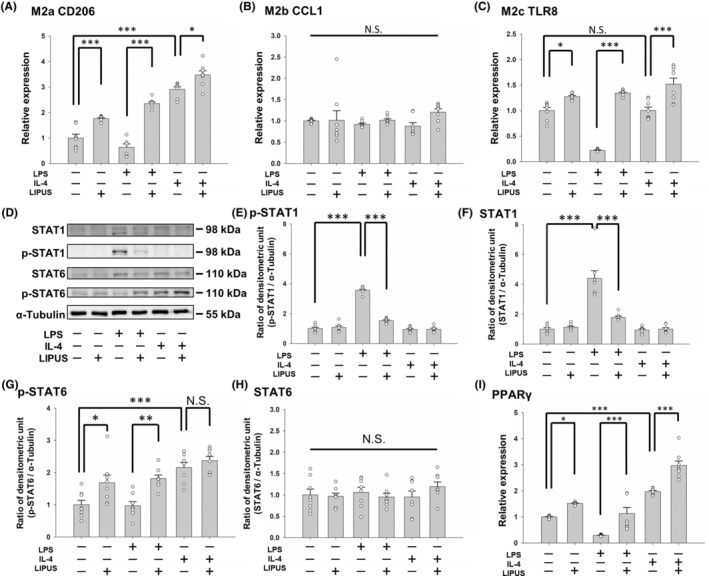
Methods: BV-2 microglial cells were stimulated by lipopolysaccharide (LPS) to an M1 phenotype or by interleukin-4 (IL-4) to an M2 phenotype. Some microglial cells were exposed to LIPUS, while others were not. M1/M2 marker mRNA and protein expression were measured using real-time polymerase chain reaction and western blot, respectively. Immunofluorescence staining was performed to determine inducible nitric oxide synthase (iNOS)-/arginase-1 (Arg-1)- and CD68-/CD206-positive cells.

Results: LIPUS treatment significantly attenuated LPS-induced increases in inflammatory markers (iNOS, tumor necrosis factor-α, interleukin-1β, and interleukin-6) as well as the expression of cell surface markers (CD86 and CD68) of M1-polarized microglia. In contrast, LIPUS treatment significantly enhanced the expression of M2-related markers (Arg-1, IL-10, and Ym1) and membrane protein (CD206). LIPUS treatment prevented M1 polarization of microglia and enhanced or sustained M2 polarization by regulating M1/M2 polarization through the signal transducer and activator of transcription 1/STAT6/peroxisome proliferator-activated receptor gamma pathways.

Conclusions: Our findings suggest that LIPUS inhibits microglial polarization and switches microglia from the M1 to the M2 phenotype.

Keywords: M1/M2; PPARγ; STAT; microglia polarization; neuroinflammation; ultrasound.


Conflict of interest statement

The authors declare that there are no conflicts of interest.

Figures

FIGURE 1
FIGURE 1
Effects of LIPUS, LPS, and IL‐4 treatment on the expression of M1‐ and M2‐related factors. (A) Microglial cells were treated with LIPUS. Cells were evaluated for (B) IGF‐1 and (C) TNF‐α mRNA expression at 2, 4, 8, and 12 h after LIPUS treatment. (D) No significant difference was found in the growth of microglia subjected to LIPUS, LPS, or IL‐4 treatment compared with the control group. (E) Microglial cells were treated with LPS and evaluated for (F) iNOS, (G) TNF‐α, and (H) Arg‐1 mRNA expression at 2, 4, 8, and 12 h after LPS treatment. (I) Microglial cells were treated with IL‐4 and evaluated for (J) Arg‐1, (K) IGF‐1, and (L) iNOS mRNA expression at 2, 4, 8, and 12 h after IL‐4 treatment. *denotes a significant difference between the control group and the other four groups. *p < 0.05; **p < 0.01; ***p < 0.001; N.S. = not significant; n = 9.
FIGURE 2
FIGURE 2
Effects of LIPUS treatment on the expression of M1‐ and M2‐related cytokines and neurotrophins. Microglia were treated with LPS, IL‐4, LIPUS, or a combination of LIPUS and LPS or IL‐4. (A) TNF‐α, (B) IL‐1β, (C) IL‐6, and (D) CD86 mRNA in microglia was quantified by qRT‐PCR. Representative immunoblots and densitometric analyses of (E) TNF‐α and (F) IL‐1β in microglia. (G) IL‐10, (H) Ym1, (I) NGF, (J) BDNF, (K) IGF‐1, and (L) TGF‐β mRNA in microglia was quantified by qRT‐PCR. *p < 0.05; **p < 0.01; ***p < 0.001; N.S. = not significant; n = 8.
FIGURE 3
FIGURE 3
Effects of LIPUS treatment on iNOS and Arg‐1 expression. Microglia were treated with LPS, IL‐4, LIPUS, or a combination of LIPUS and LPS or IL‐4. Representative changes in (A) iNOS and (B) Arg‐1 mRNA were detected by qRT‐PCR at 4 h after treatment with LIPUS. The relative levels of (C) iNOS and (D) Arg‐1 protein were detected by western blotting at 4 h after treatment with LIPUS. *p < 0.05; **p < 0.01; ***p < 0.001; N.S. = not significant; n = 8.
FIGURE 4
FIGURE 4
LIPUS treatment regulates M1/M2 microglial polarization. (A) Representative images of immunofluorescent labeling of iNOS (red), Arg‐1 (green), and DAPI (blue) staining of microglia were treated with LPS, IL‐4, LIPUS, or a combination of LIPUS and LPS or IL‐4. The levels of expression of M1 and M2 cell markers (B) iNOS and (C) Arg‐1 were quantified using immunofluorescence at 4 h after treatment with LIPUS. Scale bar = 150 μm. *p < 0.05; **p < 0.01; N.S. = not significant; n = 6.
FIGURE 5
FIGURE 5
LIPUS treatment regulates M1/M2 microglial polarization. (A) Representative images of immunofluorescent labeling of CD68 (red), CD206 (green), and DAPI (blue) staining of microglia were treated with LPS, IL‐4, LIPUS, or a combination of LIPUS and LPS or IL‐4. The levels of expression of M1 and M2 cell markers (B) CD68 and (C) CD206 were quantified using immunofluorescence at 4 h after treatment with LIPUS. Scale bar = 150 μm. *p < 0.05; **p < 0.01; N.S. = not significant; n = 6.
FIGURE 6
FIGURE 6
LIPUS induces an M2–mixed phenotype in microglia and modulates the expression of key factors in the STAT1, STAT6, and PPARγ pathways. Microglia were treated with LPS, IL‐4, LIPUS, or a combination of LIPUS and LPS or IL‐4. The mRNA of (A) the M2a marker CD206, (B) the M2b marker CCL1, and (C) the M2c marker TLR8 in microglia was quantified by qRT‐PCR. Representative (D) immunoblots and densitometric analyses of (E) phosphorylated STAT1, (F) STAT1, (G) phosphorylated STAT6, (H) STAT6, and (I) PPARγ using α‐tubulin as an internal control. *p < 0.05; **p < 0.01; ***p < 0.001; N.S. = not significant; n = 8.

References

    1. Perry VH, Holmes C. Microglial priming in neurodegenerative disease. Nat Rev Neurol. 2014;10(4):217‐224. - PubMed
    1. Salter MW, Stevens B. Microglia emerge as central players in brain disease. Nat Med. 2017;23(9):1018‐1027. - PubMed
    1. Cummings JL, Morstorf T, Zhong K. Alzheimer's disease drug‐development pipeline: few candidates, frequent failures. Alzheimers Res Ther. 2014;6(4):37. - PMC - PubMed
    1. Liu PP, Xie Y, Meng XY, Kang JS. History and progress of hypotheses and clinical trials for Alzheimer's disease. Signal Transduct Target Ther. 2019;4:29. - PMC - PubMed
    1. Zhao Q, Wu X, Yan S, et al. The antidepressant‐like effects of pioglitazone in a chronic mild stress mouse model are associated with PPARgamma‐mediated alteration of microglial activation phenotypes. J Neuroinflammation. 2016;13(1):259. - PMC - PubMed

Publication types