. 2023 Sep;33(5):e13186.
doi: 10.1111/bpa.13186. Epub 2023 Jul 3.

Krüppel-like factor 7 deficiency disrupts corpus callosum development and neuronal migration in the developing mouse cerebral cortex

Affiliations

Krüppel-like factor 7 deficiency disrupts corpus callosum development and neuronal migration in the developing mouse cerebral cortex

Wentong Hong et al. Brain Pathol. 2023 Sep.

Abstract

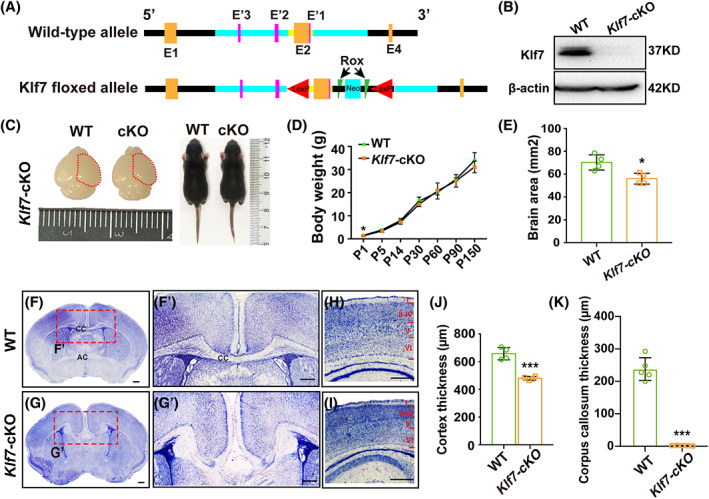
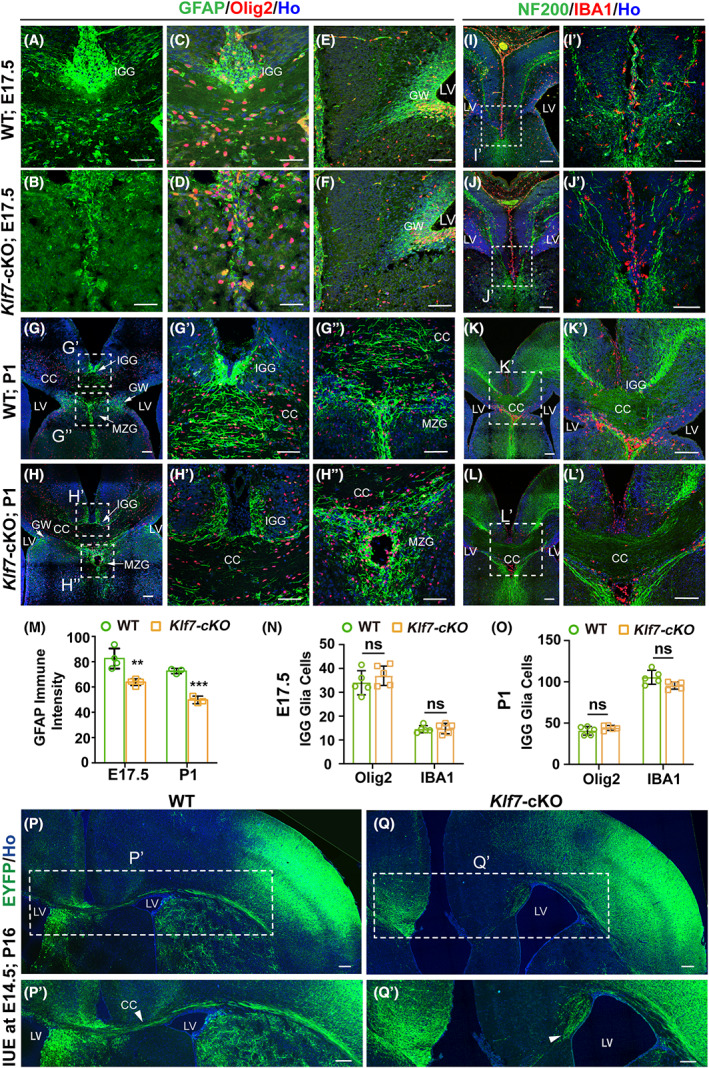
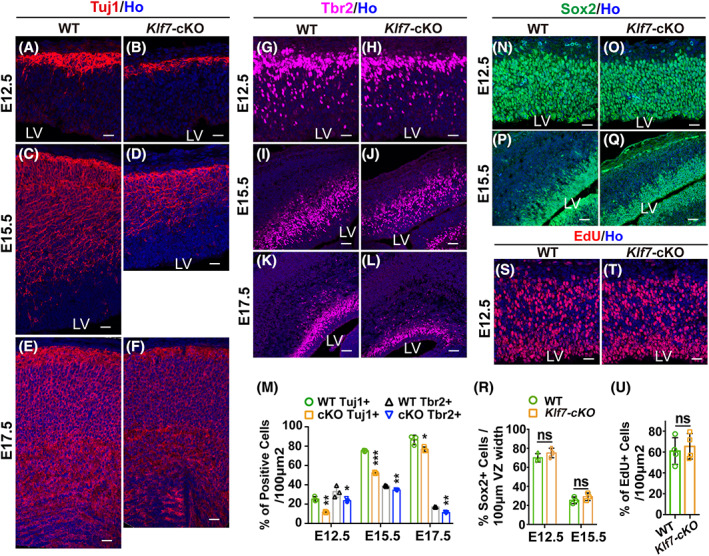
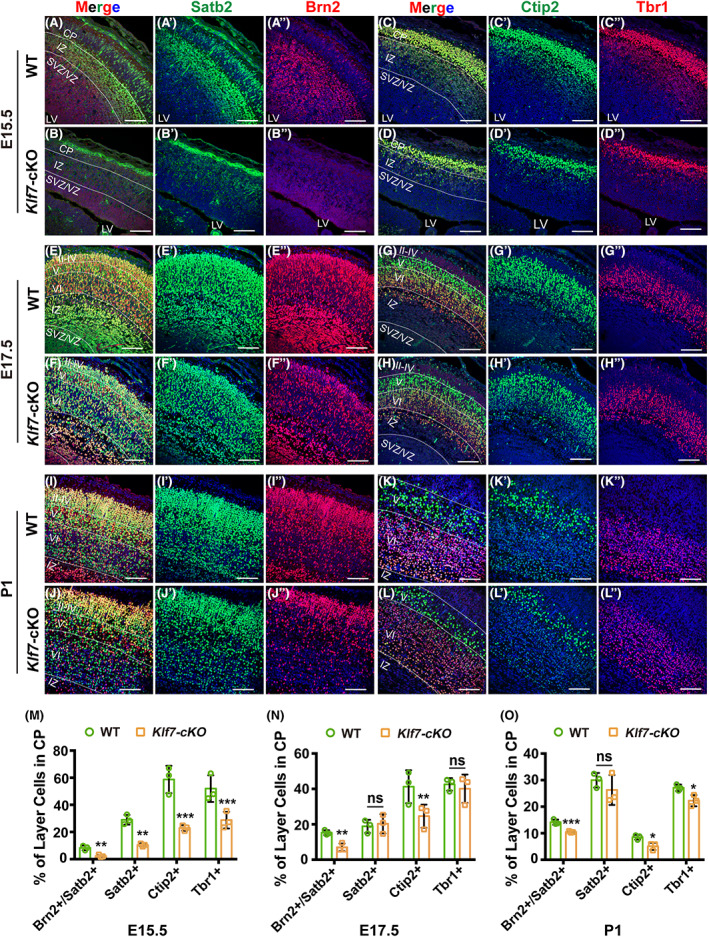
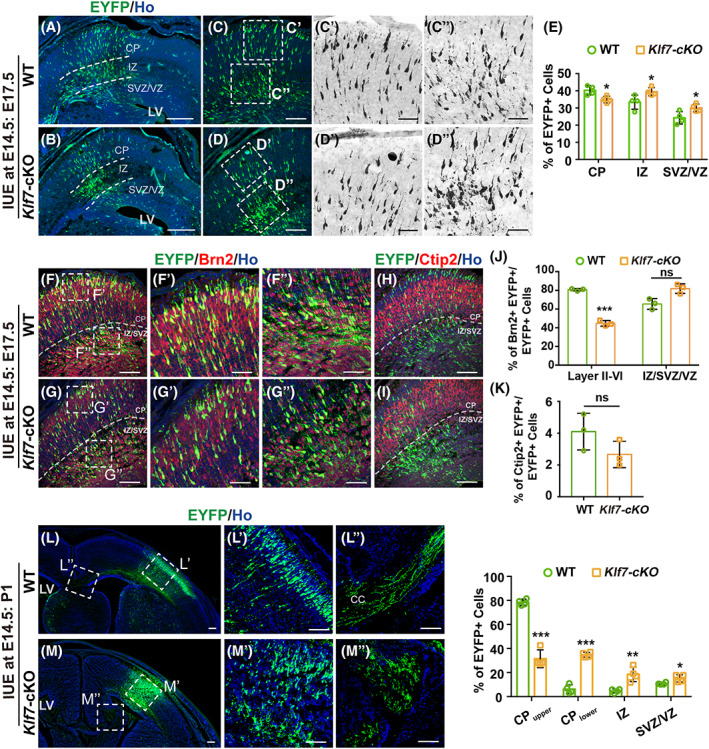
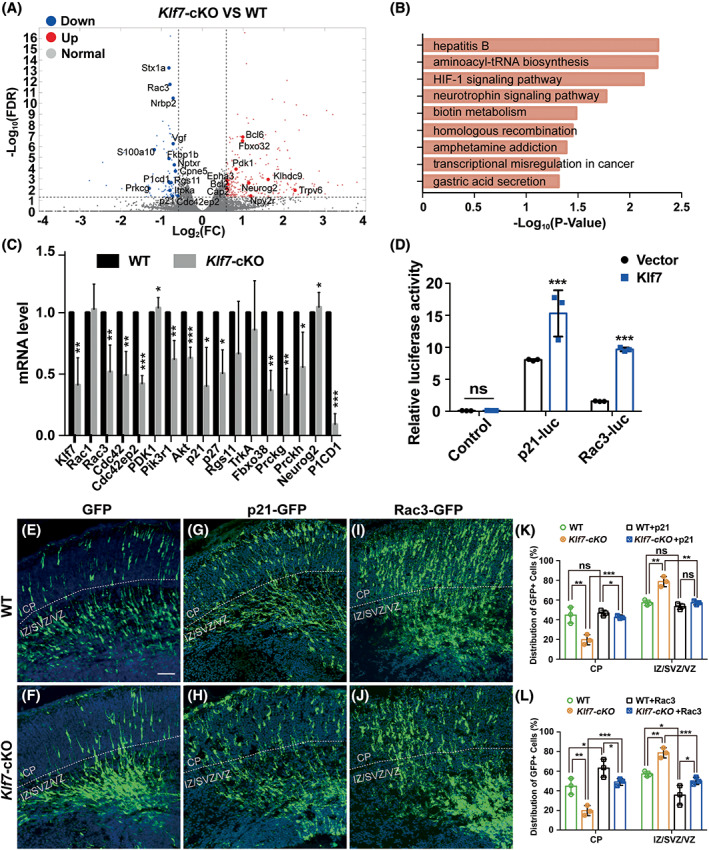
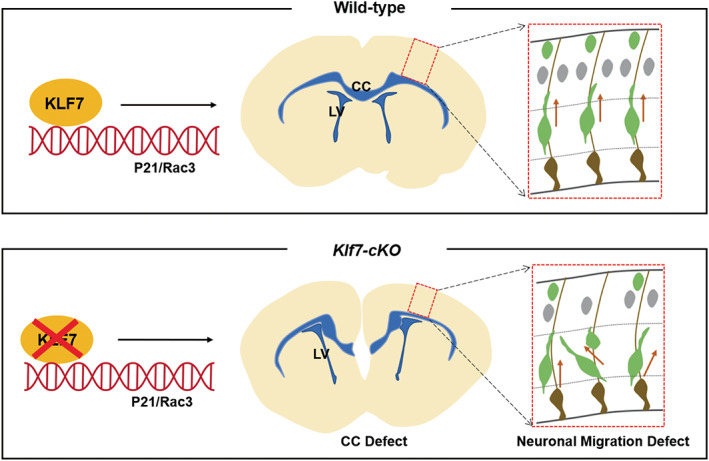
Krüppel-like Factor 7 (KLF7) is a zinc finger transcription factor that has a critical role in cellular differentiation, tumorigenesis, and regeneration. Mutations in Klf7 are associated with autism spectrum disorder, which is characterized by neurodevelopmental delay and intellectual disability. Here we show that KLF7 regulates neurogenesis and neuronal migration during mouse cortical development. Conditional depletion of KLF7 in neural progenitor cells resulted in agenesis of the corpus callosum, defects in neurogenesis, and impaired neuronal migration in the neocortex. Transcriptomic profiling analysis indicated that KLF7 regulates a cohort of genes involved in neuronal differentiation and migration, including p21 and Rac3. These findings provide insights into our understanding of the potential mechanisms underlying neurological defects associated with Klf7 mutations.

Keywords: corpus callosum; krüppel-like factor 7; neocortex; neurogenesis; neuronal migration.


Conflict of interest statement

The authors declare no competing or financial interests.

Figures

FIGURE 1
FIGURE 1
Ablation of KLF7 causes agenesis of corpus callosum and malformation of the cortex. (A) Gene targeting scheme of the generation of Klf7 flox transgenic mice. The Neo cassette was flanked by Rox sites, and cKO region was flanked by LoxP sites. (B) Western blot showing the expression of KLF7 in the forebrain of Klf7‐cKO mice as compared with that in littermate controls at P7. (C) Phenotype of Emx1‐Cre;Klf7flox/flox (Klf7‐cKO) mice as compared with littermate controls at P7. (D) Quantification of the body weight of Klf7‐cKO mice as compared with littermate controls from different ages as indicated (n > 3 per time point). (E) Quantification of the cortical area at P7 as designated by the dotted line in C (n > 3 per genotype). (F, G) Nissl stain of P7 brain sections of Klf7‐cKO mice (G) as compared with WT mice (F). (F', G') Magnified views of the boxed regions show the agenesis of the corpus callosum in Klf7‐cKO mice as compared with WT mice. (H, I) Nissl stain of P7 brain sections showing a thinner cortex in Klf7‐cKO mice (I) as compared with WT mice (H). Cortical layers (I–VI) are labeled. (J, K) Quantification of the thickness of the cortex in Klf7‐cKO and WT mice at P7 (n = 4 per genotype) and corpus callosum (n = 5 per genotype). CC, corpus callosum; AC, anterior commissure. Scale bars, 10 mm in F and G; 5 mm in F' and G'; 50 μm in H and I. *p < 0.05; ***p < 0.001.
FIGURE 2
FIGURE 2
Defects of the corpus callosum in Klf7‐cKO mice. (A–H) Immunostaining with antibodies against GFAP (green) and Olig2 (red) in sections from Klf7‐cKO and WT mice at E17.5 (A–F) and P1 (G, H). Magnified views in boxed regions show the malformation of GFAP‐labeled IGG (G′, H′) and MZG (G″, H″) regions in Klf7‐cKO mice relative to WT mice. (I–L) Immunostaining with antibodies against NF200 (green) and IBA1 (red) in sections from Klf7‐cKO mice (J, L) and littermate controls (I, K) at E17.5 and P1. Magnified views in boxed regions reveal the agenesis of the corpus callosum in Klf7‐cKO as compared with WT mice at E17.5 (I', J′) and P1 (K′, L′). (M) Quantification of the intensity of GFAP+ cells in the IGG (i.e., located above the corpus callosum) in Klf7‐cKO and WT mice at E17.5 and P1 (n = 3 mice per genotype). (N, O) Quantification of the Olig2+ and IBA1+ cells in the IGG in Klf7‐cKO and WT mice at E17.5 (N) and P1 (O) (n = 5 mice per genotype). (P,Q) E14.5 mouse embryos were electroporated in utero with EYFP plasmid and examined at P16. Higher‐magnification views of the boxed regions show the formation of axon bundles labeled by EYFP. Nuclei were counterstained with Hoechst 33342 (Ho; blue). CC, corpus callosum; LV, lateral ventricle. Scale bars, 50 μm in A–D; 100 μm in E–L, G′–L′, G″, and H″; 400 μm in P, Q, P′, and Q′.
FIGURE 3
FIGURE 3
Impairment of neurogenesis in Klf7‐cKO mice. (A–F) Representative confocal images showing the expression of Tuj1 in the cortex of Klf7‐cKO mice as compared with WT mice at E12.5 (A, B), E15.5 (C,D), and E17.5 (E, F). (G–L) Representative confocal images showing the expression of Tbr2 in the cortex of WT and Klf7‐cKO mice at E12.5 (G, H), E15.5 (I, J), and E17.5 (K, L). (M) Quantification of the percentage of Tuj1‐ and Tbr2‐expressing cells among all cells in the cortex of Klf7‐cKO mice as compared with littermate controls at E12.5, E15.5, and E17.5 (n = 3 mice per genotype) (N–Q) Representative confocal images showing the expression of Sox2 in the cortex of WT and Klf7‐cKO mice at E12.5 (N, O) and E15.5 (P, Q). (R) Quantification of the Sox2‐expressing cells in the ventricular zone of Klf7‐cKO mice as compared with littermate controls at E12.5 and E15.5 (n = 3 mice per time point per genotype). (S–U) No effect on cell proliferation in Klf7‐cKO mice as compared with WT mice when examined by pulse labeling with EdU at E12.5 (n = 3 mice per genotype). Nuclei were counterstained with Hoechst 33342 (Ho; blue). LV, lateral ventricle. Scale bars, 50 μm. *p < 0.05; **p < 0.01; ***p < 0.001.
FIGURE 4
FIGURE 4
KLF7 promotes lamination of the neocortex in the developing mouse brain. (A–L) Representative confocal images showing Satb2 and/or Brn2 expression in layer II–IV cortical neurons and Ctip2 and/or Tbr1 expression in layer V and VI cortical neurons in Klf7‐cKO mice as compared with WT mice at E15.5 (A–D), E17.5 (E–H), and P1 (I–L). (M–O) Quantification of the ratio of Satb2+Brn2+ cells in layer II, Satb2+ cells in layer II–IV, Ctip2+ cells in layer V, and Tbr1+ cells in layer VI of WT and Klf7‐cKO mice at E15.5 (M), E17.5 (N), and P1 (O) (n = 3 mice per genotype). Nuclei were counterstained with Hoechst 33342 (Ho; blue). Scale bars, 100 μm. *p < 0.05; **p < 0.01; ***p < 0.001. CP, cortical plate; IZ, intermediate zone; LV, lateral ventricle; SVZ/VZ, subventricular zone/ventricular zone.
FIGURE 5
FIGURE 5
Radial migration in the cerebral cortex requires KLF7. (A–D) Radial migration in the cortex of WT (A, C) and Klf7‐cKO (B, D) mice. Brains were electroporated at E14.5 with EYFP plasmid and examined at E17.5. Magnified views in boxed regions show EYFP+ cells in the CP (C′, D′) and IZ (C″, D″). (E) Quantification of the ratio of EYFP‐expressing cells distributed in the CP, IZ, and SVZ/VZ at E17.5 (n = 4 mice per genotype). (F–I) Immunostaining with antibodies against Brn2 (F, G) and Ctip2 (H, I) in sections from brains electroporated with EYFP plasmid. Magnified views in boxed regions showing EYFP+Brn2+ cells in cortical layer II–IV (F′, G') and the IZ/SVZ (F″, G″). (J) Quantification of the ratio of EYFP+Brn2+ cells to EYFP+ cells in layer II–IV of the cortex and IZ/SVZ/VZ (n = 4 mice per genotype) (K) Quantification of the ratio of EYFP+Ctip2+ to EYFP+ cells in the cortex (n = 4 mice per genotype). (L, M) Neuronal migration in the cortex of WT (L) and Klf7‐cKO (M) mice. Brains were electroporated at E14.5 with EYFP plasmid and examined at P1. Magnified views in boxed regions show EYFP+ cells in the cortex (L′, M') and axons that projected from EYFP+ cells (L″, M″). (N) Quantification of EYFP+ cells in the CP (upper and lower layer), IZ, and SVZ/VZ regions at P1 (n = 3 mice per genotype). *p < 0.05, **p < 0.01, ***p < 0.001. Nuclei were counterstained with Hoechst 33342 (Ho; blue). Scale bars, 200 μm in A, B, L, and M; 100 μm in C, D, F–I, F′, G', F″, G″, L′, M′, L″, and M″; 50 μm in C′,D′,C″,D″. CC, corpus callosum; CP, cortical plate; IZ, intermediate zone; LV, lateral ventricle; SVZ/VZ, subventricular zone/ventricular zone.
FIGURE 6
FIGURE 6
KLF7 interacts with p21 and Rac3 and regulates neuronal migration. (A) Volcano plot of RNA‐seq data from Klf7‐cKO mice versus control mice at P1. The fold change (FC) was plotted versus the false discovery rate (FDR). The cut‐off values for FDR <0.05 and Log2(FC) > 0.585 or < −0.585 are indicated by dashed lines. (B) Gene ontology (GO) analysis of the DEGs. (C) qRT‐PCR analysis of candidate genes based on RNA‐seq data from Klf7‐cKO mice versus control mice (n = 3 mice per genotype). (D) KLF7 increases the activity of luciferase reporters containing the cloned promoter fragment of p21 and Rac3 in HEK293T cells (n = 3 mice per genotype). (E–K) Effect of p21 or Rac3 overexpression on the neuronal migration defect phenotype of Klf7‐cKO mice. Brains of WT and Klf7‐cKO mice were electroporated at E14.5 with GFP (E, F), p21‐ires‐GFP (G, H), and Rac3‐ires‐GFP (I, J) plasmids and were examined at E17.5. (K, L) Quantification of the effect of p21 and Rac3 overexpression in WT and Klf7‐cKO brains. The percentage of GFP+ cells among all cells in the CP and IZ/SVZ/VZ was determined. n = 4 mice per genome per plasmid. *p < 0.05; **p < 0.01; ***p < 0.001. CP, cortical plate; IZ/SVZ/VZ, intermediate zone/subventricular zone/ventricular zone; LV, lateral ventricle; ns, no significant difference. Nuclei were counterstained with Hoechst 33342 (Ho; blue). Scale bars, 200 μm.
FIGURE 7
FIGURE 7
A schematic diagram showing KLF7 deficiency disrupts corpus callosum formation and p21/Rac3 as downstream effectors in KLF7‐regulated neuronal migration.

Similar articles

Cited by

References

    1. Martinez‐Cerdeno V, Noctor SC, Kriegstein AR. The role of intermediate progenitor cells in the evolutionary expansion of the cerebral cortex. Cereb Cortex. 2006;16(Suppl 1):i152–61. - PubMed
    1. Kriegstein A, Alvarez‐Buylla A. The glial nature of embryonic and adult neural stem cells. Annu Rev Neurosci. 2009;32:149–84. - PMC - PubMed
    1. Angevine JB Jr, Sidman RL. Autoradiographic study of cell migration during histogenesis of cerebral cortex in the mouse. Nature. 1961;192:766–8. - PubMed
    1. He S, Li Z, Ge S, Yu YC, Shi SH. Inside‐out radial migration facilitates lineage‐dependent neocortical microcircuit assembly. Neuron. 2015;86(5):1159–66. - PMC - PubMed
    1. Laub F, Lei L, Sumiyoshi H, Kajimura D, Dragomir C, Smaldone S, et al. Transcription factor KLF7 is important for neuronal morphogenesis in selected regions of the nervous system. Mol Cell Biol. 2005;25(13):5699–711. - PMC - PubMed

Publication types

Substances