. 2023 Jul 1;16(7):dmm050066.
doi: 10.1242/dmm.050066. Epub 2023 Jul 25.

Oxidative stress induces lysosomal membrane permeabilization and ceramide accumulation in retinal pigment epithelial cells

Affiliations

Oxidative stress induces lysosomal membrane permeabilization and ceramide accumulation in retinal pigment epithelial cells

Kevin R Zhang et al. Dis Model Mech. .

Abstract

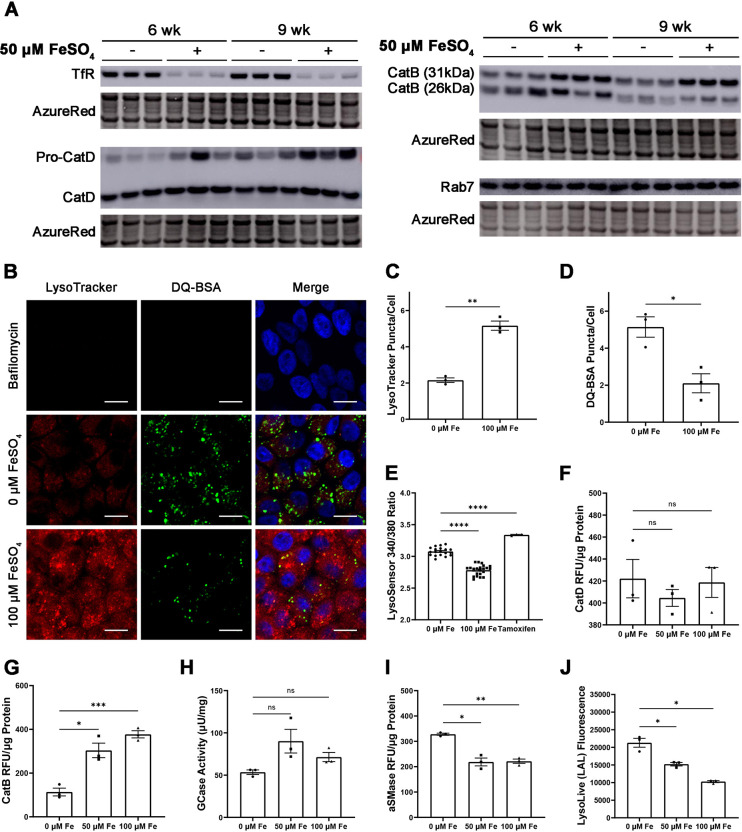
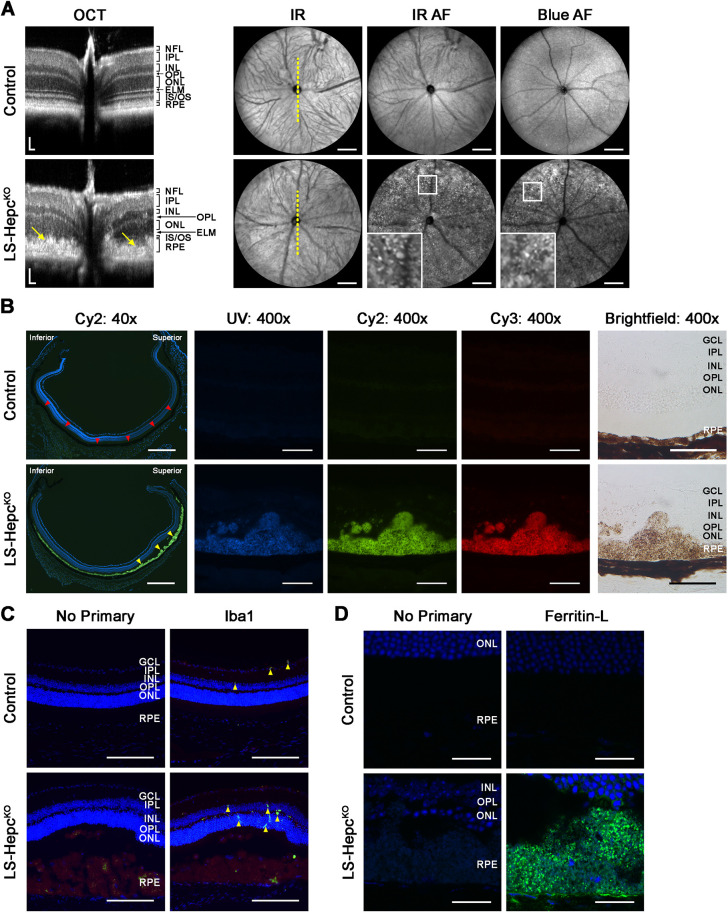
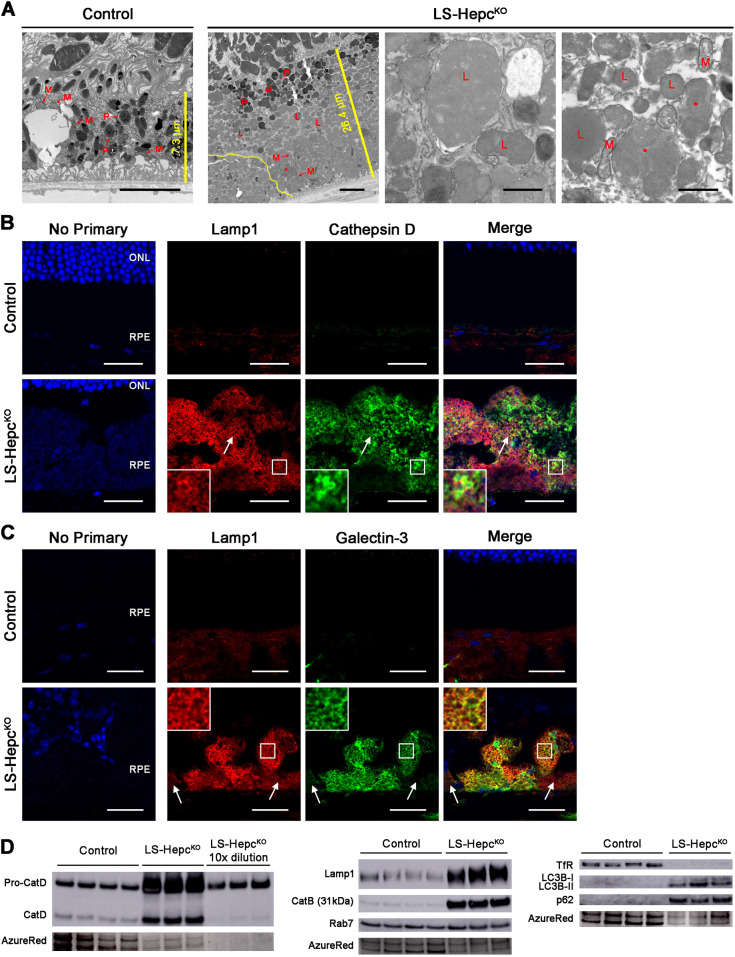
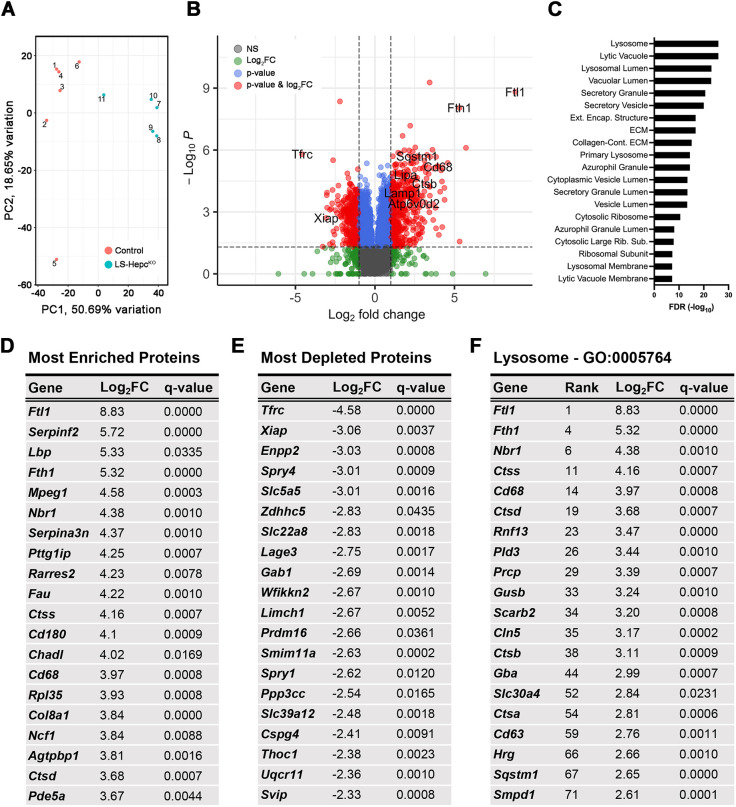
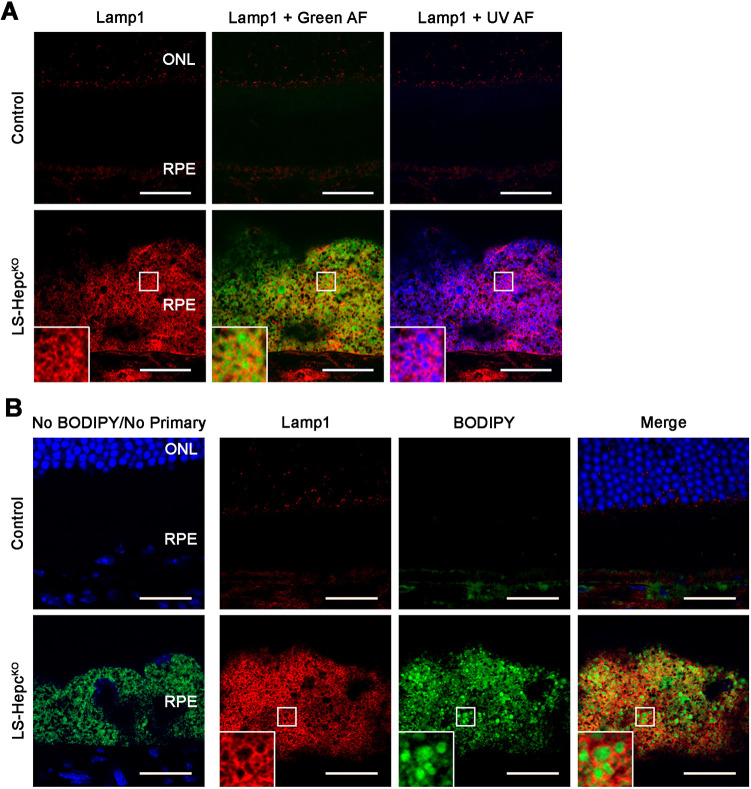
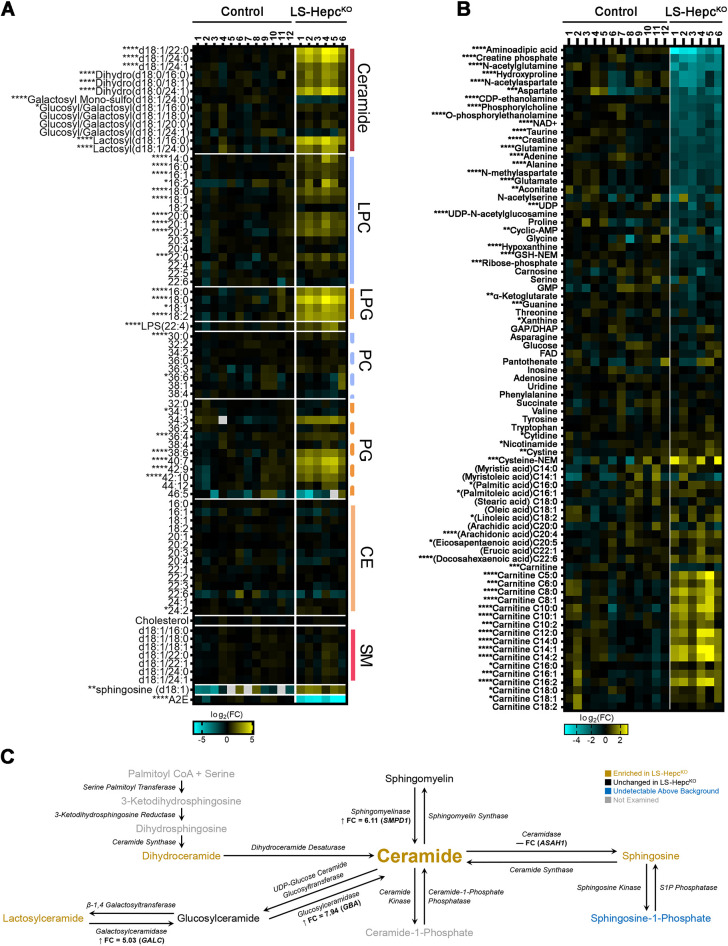
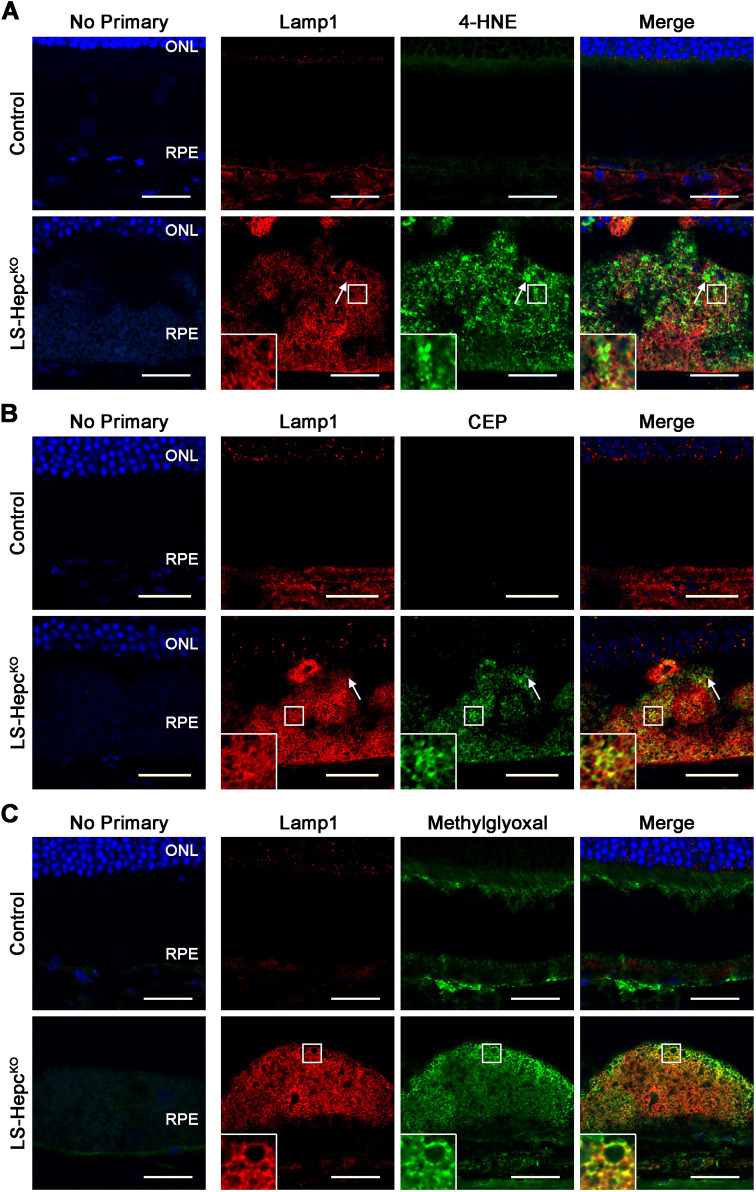
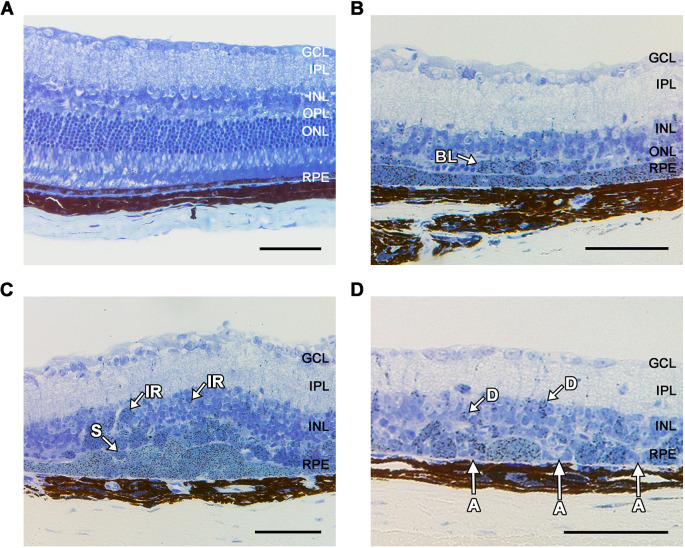
Oxidative stress has been implicated in the pathogenesis of age-related macular degeneration, the leading cause of blindness in older adults, with retinal pigment epithelium (RPE) cells playing a key role. To better understand the cytotoxic mechanisms underlying oxidative stress, we used cell culture and mouse models of iron overload, as iron can catalyze reactive oxygen species formation in the RPE. Iron-loading of cultured induced pluripotent stem cell-derived RPE cells increased lysosomal abundance, impaired proteolysis and reduced the activity of a subset of lysosomal enzymes, including lysosomal acid lipase (LIPA) and acid sphingomyelinase (SMPD1). In a liver-specific Hepc (Hamp) knockout murine model of systemic iron overload, RPE cells accumulated lipid peroxidation adducts and lysosomes, developed progressive hypertrophy and underwent cell death. Proteomic and lipidomic analyses revealed accumulation of lysosomal proteins, ceramide biosynthetic enzymes and ceramides. The proteolytic enzyme cathepsin D (CTSD) had impaired maturation. A large proportion of lysosomes were galectin-3 (Lgals3) positive, suggesting cytotoxic lysosomal membrane permeabilization. Collectively, these results demonstrate that iron overload induces lysosomal accumulation and impairs lysosomal function, likely due to iron-induced lipid peroxides that can inhibit lysosomal enzymes.

Keywords: Age-related macular degeneration; Aging; Lysosome; Oxidative stress; Retina.


Conflict of interest statement

Competing interests The authors declare no competing or financial interests.

Figures

Fig. 1.
Fig. 1.
Iron-loaded iPS-RPE accumulate lysosomes with impaired enzyme activity. (A) Western blot analysis of human iPS-RPE loaded with 50 μM FeSO4 for 6 and 9 weeks. AzureRed total protein stain served as a loading control. Each lane represents one experimental replicate. (B) Representative confocal images of human iPS-RPE cells loaded with LysoTracker (red) to detect lysosomes and DQ-BSA (green) to detect lysosomal proteolysis. Nuclei are labeled with DAPI (blue). Scale bars: 10 μm. (C) Quantification of LysoTracker-positive puncta per cell. (D) Quantification of DQ-BSA-positive puncta per cell. (E) Measurement of lysosomal pH using LysoSensor Yellow/Blue, with higher values of the 340/380 ratio correlating to increased pH. (F-J) Enzyme activity assays for cathepsin D (F), cathepsin B (G), glucosylceramidase (GCase) (H), acid sphingomyelinase (aSMase) (I) and lysosomal acid lipase (LAL) (J). Cells were incubated with 0, 50 or 100 μM FeSO4 for 6 weeks in B-J. Values in graphs represent the mean±s.e.m. RFU, relative fluorescence units. ns, not significant; *P<0.05; **P<0.01; ***P<0.001; ****P<0.0001 (two-tailed unpaired Student's t-test).
Fig. 2.
Fig. 2.
LS-HepcKO RPE is hypertrophic and autofluorescent. (A) Representative optical coherence tomography (OCT) (left) and confocal scanning laser ophthalmoscopy (cSLO) (right) images from 12-month-old LS-HepcKO (n=4) and control (n=4) mice. OCT scans were taken vertically through the optic nerve, as indicated by the dotted yellow line, with a field of view about half that of the cSLO. Arrows on the OCT images point to hypertrophic RPE. Regions bounded by white squares are enlarged in the inset and display autofluorescent foci. IR, infrared; AF, autofluorescence. Scale bars: 50 μm (horizontally and vertically, OCT); 500 μm (cSLO). (B) Autofluorescence and brightfield imaging of cryosections. Red arrowheads indicate the RPE in the control; yellow arrowheads indicate regions of RPE hypertrophy in LS-HepcKO sections. Scale bars: 500 μm (40× images); 50 μm (400× images). (C) Immunofluorescence for Iba1 (green) in 12-month-old mice. Yellow arrowheads point to Iba1+ cells. Scale bars: 200 μm. (D) Representative immunofluorescence confocal images for ferritin-L (green) in 12-month-old mice. Scale bars: 25 μm. Nuclei are labeled with DAPI (blue) in the 40× images of B, as well as in C,D. Control mice had the genotype AlbCre, Hepcf/f in A and were wild type in B-D. Experiments without any primary antibody (‘no primary’) were performed as controls. Representative immunolabeling images are shown from n=4 mice per genotype in B-D. ELM, external limiting membrane; GCL, ganglion cell layer; INL, inner nuclear layer; IPL, inner plexiform layer; IS, inner segments; NFL, nerve fiber layer; ONL, outer nuclear layer; OPL, outer plexiform layer; OS, outer segments; RPE, retinal pigment epithelium.
Fig. 3.
Fig. 3.
LS-HepcKO RPE accumulate lysosomes. (A) Electron micrographs of RPE from 12-month-old mice (n=4). The first two images are lower magnification and span the height of one RPE cell; scale bars: 5 μm. The last two images are higher magnification; scale bars: 1 μm. L, lysosome; M, mitochondrion; P, phagolysosome; *, multivesicular body. The straight yellow lines in the first two images indicate the height of the RPE cell, with lengths indicated. The non-linear yellow line in the second image outlines the border between two RPE cells. (B) Confocal images of immunofluorescence for Lamp1 (red) and cathepsin D (green) in 12-month-old mice. White arrows indicate an example of Lamp1 and cathepsin D colocalization. (C) Confocal images of Lamp1 (red) and galectin-3 (green) immunofluorescence in 12-month-old mice. White arrows show flanking cells without significant galectin-3 expression. Regions bounded by white squares in B,C are enlarged in the insets. Nuclei are labeled with DAPI (blue). Experiments without any primary antibody (‘no primary’) were performed as controls. Representative immunolabeling images are shown from n=4 mice per genotype. Control mice had the genotype AlbCre, Hepcf/f in A and D and were wild type in B,C. ONL, outer nuclear layer; RPE, retinal pigment epithelium. Scale bars: 25 μm. (D) Western blot analysis on isolated RPEs from 12-month-old mice. AzureRed total protein stain served as a loading control. Each lane represents protein from one mouse.
Fig. 4.
Fig. 4.
Proteomics reveals enrichment of lysosomal proteins in LS-HepcKO RPE. (A) Principal component analysis for RPE isolated from 12-month-old LS-HepcKO and control AlbCre, Hepcf/f mice. (B) Volcano plot for proteins enriched in LS-HepcKO versus control RPEs. Colored circles represent proteins that met criteria for adjusted P-value<0.05 and/or absolute value of log2 fold change (|log2FC|)>1. (C) Enrichment analysis of cellular components with the ToppGene Suite for LS-HepcKO versus control RPEs. Categories correspond to Gene Ontology (GO) terms. (D) Table of the 20 most enriched proteins in 12-month-old LS-HepcKO RPE. (E) Table of the 20 most depleted proteins in 12-month-old LS-HepcKO RPE. (F) Table of the 20 most enriched lysosomal proteins in 12-month-old LS-HepcKO RPE, based on annotation in GO:0005764. Rank denotes their overall placement by log2FC amongst all identified proteins.
Fig. 5.
Fig. 5.
LS-HepcKO RPE lysosomes accumulate autofluorescent material and neutral lipids. (A) Representative confocal images of autofluorescence (AF) and Lamp1 immunofluorescence (red) in 12-month-old mice. (B) Confocal images of BODIPY 493/503 (for neutral lipids) fluorescence (green) and Lamp1 immunofluorescence (red) in 12-month-old mice. Nuclei are labeled with DAPI (blue). Regions bounded by white squares are enlarged in insets. Control mice were wild type. Representative immunolabeling images are shown from n=4 mice per genotype. ONL, outer nuclear layer; RPE, retinal pigment epithelium. Scale bars: 25 μm.
Fig. 6.
Fig. 6.
LS-HepcKO RPE accumulates ceramides, acyl carnitines and DHA. (A) Heatmap of a lipidomics experiment on isolated RPE from mice between 9 and 13 months old. Sphingosine was detected by HILIC-LCMS. (B) Metabolomics on isolated RPE from mice between 9 and 13 months old. Control mice were wild type. CE, cholesterol ester; LPC, lysophosphatidylcholine; LPG, lysophosphatidylglycerol; PC, phosphatidylcholine; PG, phosphatidylglycerol; SM, sphingomyelin. *P<0.05; **P<0.01; ***P<0.005; ****P<0.001 (two-tailed unpaired Student's t-test). (C) Schematic of ceramide metabolism, with colors corresponding to enrichment in LS-HepcKO versus control RPE. Lysosomal proteins detected by proteomics are indicated along with fold-change values, with positive values and up arrows indicating enrichment in LS-HepcKO RPE.
Fig. 7.
Fig. 7.
LS-HepcKO RPE lysosomes accumulate lipid peroxidation products. (A-C) Representative confocal images of immunofluorescence for Lamp1 (red) and 4-hydroxynonenal (4-HNE; green) (A), carboxyethylpyrrole (CEP; green) (B) or methylglyoxal (green) (C) in 12-month-old mice. Regions bounded by white squares are enlarged in the insets. White arrows indicate an example of colocalization between Lamp1 and 4-HNE (A) or CEP (B). Nuclei are labeled with DAPI (blue). All control mice were wild type. Representative immunolabeling images are shown from n=4 mice per genotype. ONL, outer nuclear layer; RPE, retinal pigment epithelium. Scale bars: 25 μm.
Fig. 8.
Fig. 8.
Aged LS-HepcKO RPE undergoes cell death and displays AMD morphologies. (A-D) Representative images of Toluidine Blue-stained plastic sections in 16-month-old control AlbCre, Hepcf/f (A) and LS-HepcKO (B-D) mice demonstrating regions of hypertrophic RPE and several of the RPE phenotypes seen in AMD. Non-uniform and very non-uniform phenotypes are seen in all images. Morphologies shown are: A, atrophy without basal laminar deposits; D, dissociated; BL, bilaminar; IR, intraretinal; S, sloughed; Control mice were wild type. GCL, ganglion cell layer; INL, inner nuclear layer; IPL, inner plexiform layer; ONL, outer nuclear layer; OPL, outer plexiform layer; RPE, retinal pigment epithelium. Scale bars: 25 μm.

References

    1. Ach, T., Huisingh, C., Mcgwin, G., Messinger, J. D., Zhang, T., Bentley, M. J., Gutierrez, D. B., Ablonczy, Z., Smith, R. T., Sloan, K. R.et al. (2014). Quantitative autofluorescence and cell density maps of the human retinal pigment epithelium. Invest. Ophthalmol. Vis. Sci. 55, 4832-4841. 10.1167/iovs.14-14802 - DOI - PMC - PubMed
    1. Age-Related Eye Disease Study Research Group (2001). A randomized, placebo-controlled, clinical trial of high-dose supplementation with vitamins C and E, beta carotene, and zinc for age-related macular degeneration and vision loss: AREDS report no. 8. Arch. Ophthalmol. 119, 1417-1436. 10.1001/archopht.119.10.1417 - DOI - PMC - PubMed
    1. Agrawal, S., Kumar, S., Sehgal, R., George, S., Gupta, R., Poddar, S., Jha, A. and Pathak, S. (2019). El-MAVEN: a fast, robust, and user-friendly mass spectrometry data processing engine for metabolomics. Methods Mol. Biol. 1978, 301-321. 10.1007/978-1-4939-9236-2_19 - DOI - PubMed
    1. Aits, S., Kricker, J., Liu, B., Ellegaard, A.-M., Hämälistö, S., Tvingsholm, S., Corcelle-Termeau, E., Høgh, S., Farkas, T., Holm Jonassen, A.et al. (2015). Sensitive detection of lysosomal membrane permeabilization by lysosomal galectin puncta assay. Autophagy 11, 1408-1424. 10.1080/15548627.2015.1063871 - DOI - PMC - PubMed
    1. Alge, C. S., Suppmann, S., Priglinger, S. G., Neubauer, A. S., May, C. A., Hauck, S., Welge-Lussen, U., Ueffing, M. and Kampik, A. (2003). Comparative proteome analysis of native differentiated and cultured dedifferentiated human RPE cells. Invest. Ophthalmol. Vis. Sci. 44, 3629-3641. 10.1167/iovs.02-1225 - DOI - PubMed

Publication types