

Centrosome linker diversity and its function in centrosome clustering and mitotic spindle formation
- PMID: 37401899
- PMCID: PMC10476278
- DOI: 10.15252/embj.2021109738
Centrosome linker diversity and its function in centrosome clustering and mitotic spindle formation
Abstract
The centrosome linker joins the two interphase centrosomes of a cell into one microtubule organizing center. Despite increasing knowledge on linker components, linker diversity in different cell types and their role in cells with supernumerary centrosomes remained unexplored. Here, we identified Ninein as a C-Nap1-anchored centrosome linker component that provides linker function in RPE1 cells while in HCT116 and U2OS cells, Ninein and Rootletin link centrosomes together. In interphase, overamplified centrosomes use the linker for centrosome clustering, where Rootletin gains centrosome linker function in RPE1 cells. Surprisingly, in cells with centrosome overamplification, C-Nap1 loss prolongs metaphase through persistent activation of the spindle assembly checkpoint indicated by BUB1 and MAD1 accumulation at kinetochores. In cells lacking C-Nap1, the reduction of microtubule nucleation at centrosomes and the delay in nuclear envelop rupture in prophase probably cause mitotic defects like multipolar spindle formation and chromosome mis-segregation. These defects are enhanced when the kinesin HSET, which normally clusters multiple centrosomes in mitosis, is partially inhibited indicating a functional interplay between C-Nap1 and centrosome clustering in mitosis.
Keywords: Ninein; Rootletin; centrosome clustering; centrosome cohesion; centrosome linker.
© 2023 The Authors.
Conflict of interest statement
The authors declare that they have no conflict of interest.
Figures
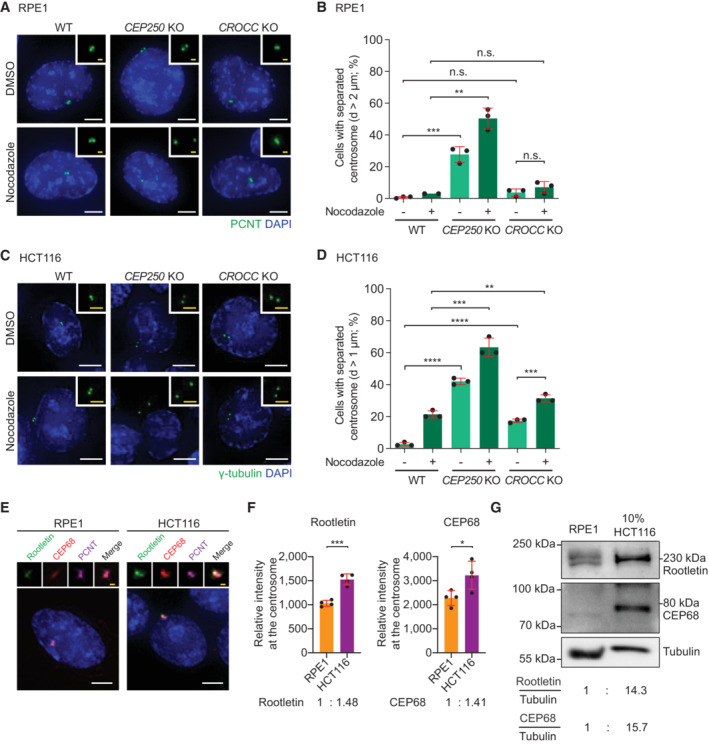
Representative fluorescent images of centrosomes in RPE1 WT, CEP250 KO, and CROCC KO cells, without and with MT depolymerization using Nocodazole. PCNT was used to mark centrosomes and DNA was stained with DAPI. The boxes in the upper right‐hand corner show the enlargement of the centrosome signals of the cell in the main panel. White scale bars, 5 μm. Yellow scale bars, 1 μm.
Quantification of cells with separated centrosomes (centrosome distance >2 μm) from RPE1 samples (A). N = 50 cells per experiment, n = 3 independent experiments. For WT with Nocodazole, N = 50 cells, n = 2 independent experiments. Bar and error represent mean and SD. Unpaired t‐tests. n.s.—not significant P > 0.05, **P < 0.01, ***P < 0.001.
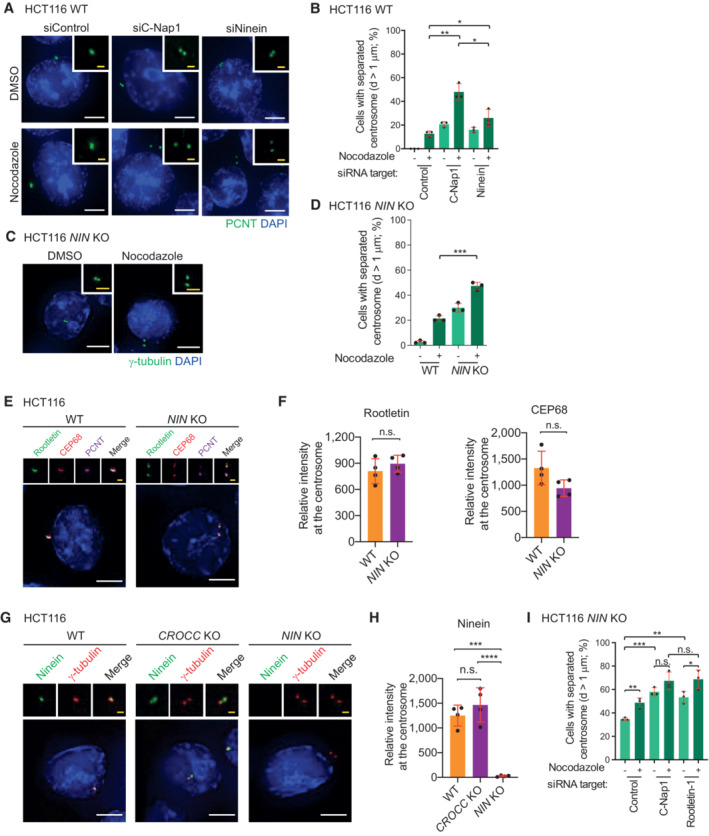
Representative fluorescent images of centrosomes in HCT116 WT, CEP250 KO, NIN KO, and CROCC KO, without and with MT depolymerization using Nocodazole. γ‐tubulin was used to mark centrosomes and DNA was stained with DAPI. The boxes in the upper right‐hand corner show enlargements of the centrosome signals of the cell in the main panel. White scale bars, 10 μm. Yellow scale bars, 2 μm.
Quantification of cells with separated centrosomes (centrosome distance >1 μm) from HCT116 samples (C). N = 50 cells per experiment, n = 3 independent experiments. Bar and error represent mean and SD. Unpaired t‐tests. **P < 0.01, ***P < 0.001, ****P < 0.0001.
Representative fluorescent images of RPE1 and HCT116 cells. Rootletin and CEP68 were stained, PCNT was used as a centrosome marker and DNA was stained with DAPI. The boxes on top show the centrosome signals of the cell in the main panel. Scale bars in white: 5 μm. Scale bars in yellow: 1 μm.
Quantification of relative Rootletin and CEP68 intensity at the centrosome in RPE1 and HCT116 cells. Mean value of relative intensity at the centrosome from N = 50 in each replicate, n = 4 is shown. Bar and error represent mean and SD. Unpaired t‐test. *P < 0.05, ***P < 0.001.
Abundance of Rootletin and CEP68 in RPE1 and HCT116 cells was examined by western blotting. Tubulin was used as a loading control. Representative blot is shown. The original HCT116 protein sample was diluted 1:10. The relative abundance of Rootletin and CEP68 was normalized to the corresponding tubulin signal in each condition.
- A
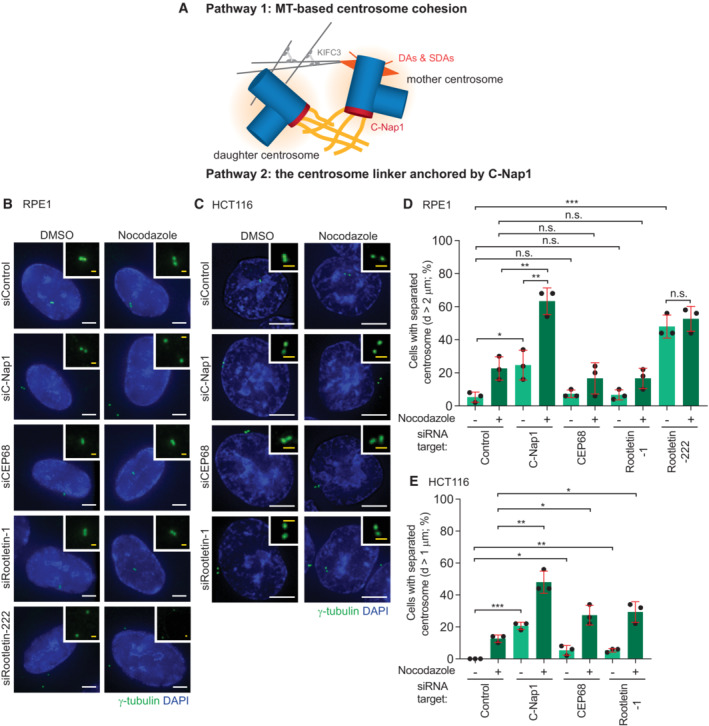
Model of the centrosome cohesion: Two pathways contribute to the centrosome cohesion: the centrosome linker and the MT‐based cohesion.
- B, C
Fluorescent images of centrosomes in RPE1 (B) and HCT116 (C) cells under siRNA depletion condition using the indicated siRNAs, without and with MT depolymerization by Nocodazole. γ‐tubulin was used to mark centrosomes and DNA was stained with DAPI. The box in the upper right‐hand corner shows the centrosome signals of the cell in the main panel. Scale bars in white: 5 μm. Scale bars in yellow: 1 μm.
- D, E
Quantification of cells with separated centrosomes (centrosome distance > 2 μm for RPE1 cells and > 1 μm for HCT116 cells) from RPE1 (B) and HCT116 (C) cells. N = 50 cells per analysis, n = 3 independent experiments. Bar and error represent mean and SD. Unpaired t‐test. n.s.—not significant P > 0.05, *P < 0.05, **P < 0.01, ***P < 0.001.
- A
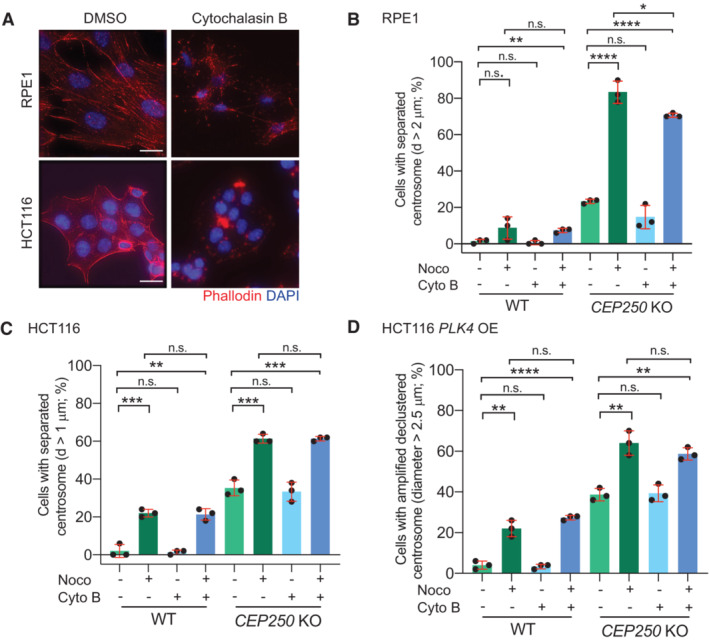
Representative fluorescent images of RPE1 WT and HCT116 WT cells show that the actin cytoskeleton was disrupted upon Cytochalasin B (20 μM) treatment. Scale bars: 20 μm.
- B, C
Quantification of cells with separated centrosomes (centrosome distance >2 μm for RPE1 cells and > 1 μm for HCT116 cells) from RPE1 WT and CEP250 KO (B) and HCT116 WT and CEP250 KO (C) cells.
- D
Quantification of the diameter of amplified centrosome in Dox‐inducible Flag‐PLK4 HCT116 WT and CEP250 KO cells. Centrosomes were marked with γ‐tubulin and centrin2 and considered as de‐clustered when the distance was > 2.5 μm.
- A–H
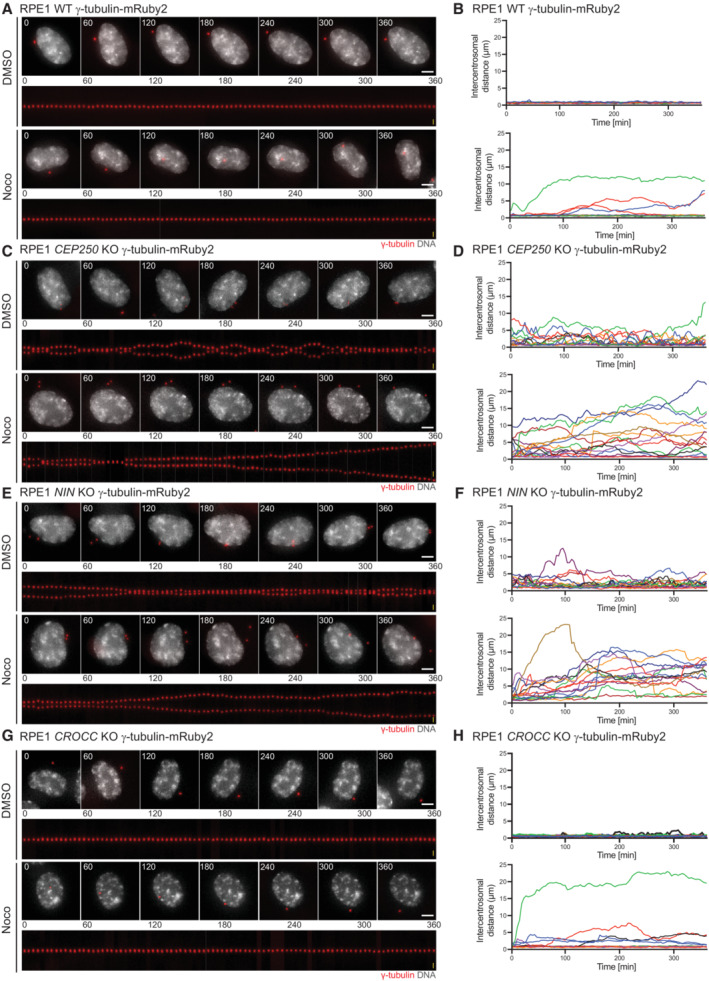
(A, C, E, G) Time‐lapse images (4‐min interval) of RPE1 WT, CEP250 KO, NIN KO, and CROCC KO cells expressing γ‐tubulin‐mRuby2 (red) as marker for the centrosomes with and without Nocodazole treatment. Representative still images (top rows) and kymographs of centrosomes (bottom rows) are shown. The DNA was marked with SPY‐DNA650 (gray). White scale bars, 5 μm. Yellow scale bars, 2 μm. (B, D, F, H) Intercentrosomal distances (μm) from (A), (C), (E), and (G) were plotted over time (n = 15 cells).
Fluorescent images of centrosomes in HCT116 cells under siRNA depletion condition, with and without Nocodazole. PCNT was used to mark centrosomes and DNA was stained with DAPI. The box in the upper right‐hand corner shows the centrosome signals of the cell in the main panel. Scale bars in white: 5 μm. Scale bars in yellow: 1 μm.
Quantification of cells with separated centrosomes (centrosome distance >1 μm) from HCT116 samples (E). N = 50 cells per experiment, n = 3 independent experiments. Bar and error represent mean and SD. Unpaired t‐test. n.s.—not significant P > 0.05, *P < 0.05, **P < 0.01.
Fluorescent image of centrosomes in HCT116 NIN KO, without and with MT depolymerization using Nocodazole. γ‐tubulin was used to mark centrosomes and DNA was stained with DAPI. The boxes on top show the enlargement of the centrosome signals of the cell in the main panel. White scale bars, 10 μm. Yellow scale bars, 2 μm.
Quantification of cells with separated centrosomes (centrosome distance >1 μm) from HCT116 WT and NIN KO (C). N = 50 cells per experiment, n = 3 independent experiments. Bar and error represent mean and SD. Unpaired t‐tests. ***P < 0.001.
Fluorescent images of Rootletin and CEP68 in HCT116 WT and NIN KO cells using the indicated antibodies. DNA was stained with DAPI. The boxes on top show the enlargement of the centrosome signals of the cell in the main panel. Scale bars in white: 5 μm; scale bars in yellow: 1 μm.
Quantification of relative Rootletin and CEP68 intensity at the centrosome in HCT116 WT and NIN KO cells (E). N = 50 cells per experiment, n = 4 independent experiments. Bar and error represent mean and SD. Unpaired t‐test. n.s.—not significant P > 0.05.
Fluorescent images of Ninein in HCT116 WT, CROCC KO, and NIN KO cells using indicated antibodies. DNA was stained with DAPI. The boxes on top show the enlargement of the centrosome signals of the cell in the main panel. Scale bars in white: 5 μm; scale bars in yellow: 1 μm.
Quantification of relative Ninein intensity at the centrosome in HCT116 WT, CROCC KO, and NIN KO cells (G). N = 50 cells per experiment, n = 4 independent experiments. Bar and error represent mean and SD. Unpaired t‐test. n.s.—not significant P > 0.05, ***P < 0.001, ****P < 0.0001.
Quantification of centrosomes separation in HCT NIN KO cells with the indicated siRNA depletions, without and with MT depolymerization using Nocodazole. N = 50 cells per experiment, n = 3 independent experiments. Bar and error represent mean and SD. Unpaired t‐test. n.s.—not significant P > 0.05, *P < 0.05, **P < 0.01, ***P < 0.001.
- A
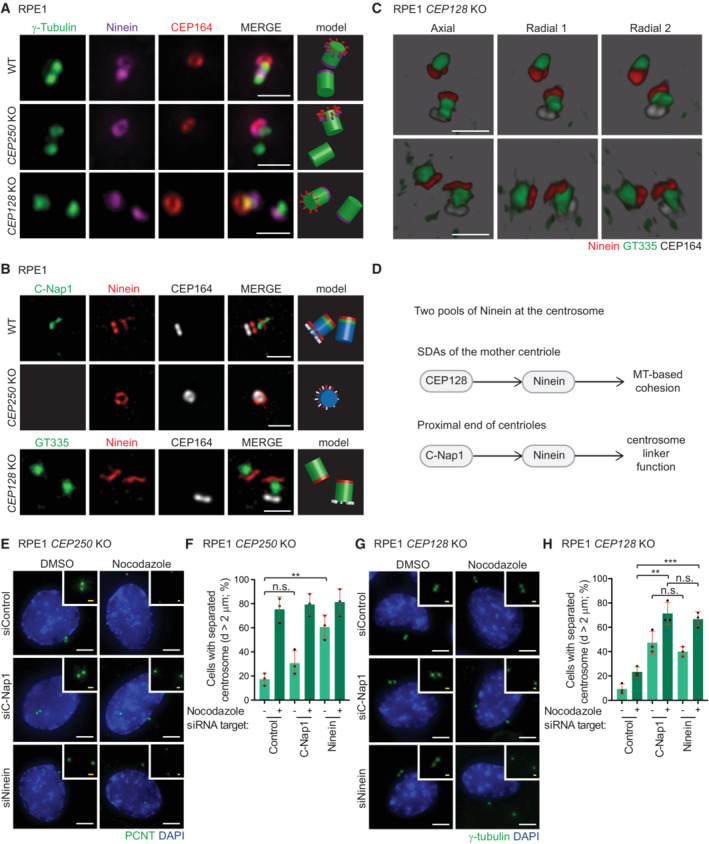
Indirect immunofluorescence analysis of Ninein at the centrosomes in RPE1 WT, CEP250 KO, and CEP128 KO cells. CEP164 marks the mother centriole, γ‐tubulin was used as a centrosome marker. The model panel illustrates the position of the centrioles and centriole appendages. Scale bars: 1 μm.
- B
STED super‐resolution image and model of Ninein at the centrosome in RPE1 WT, CEP250 KO, and CEP128 KO cells. CEP164, C‐Nap1, and GT335 were used to mark the mother centriole, the proximal end of centrioles, and the centriole wall, respectively. The model panel illustrates the position of the centrioles and appendages (colors as indicated). For WT and CEP250 KO a blue centriole model was used for better illustration of the different positions. Scale bars: 1 μm.
- C
3D reconstructed model of Ninein stained centrosomes from 3D STED images in RPE1 CEP128 KO cells. Scale bars: 1 μm.
- D
Summary of Ninein localizations and functions at the centrosome, based on the results from (A), (B), and (C).
- E–H
(E, G) Fluorescent images of centrosomes in RPE1 CEP250 KO and CEP128 KO cells with the indicated siRNA depletions, without and with MT depolymerization using Nocodazole. PCNT or γ‐tubulin was used to mark centrosomes and DNA was stained with DAPI. The box in the upper right‐hand corner shows the centrosome signals of the cell in the main panel. Scale bars in white: 5 μm. Scale bars in yellow: 1 μm. (F, H) Quantification of cells with separated centrosomes (centrosome distance > 2 μm) for RPE1 CEP250 KO (E) and CEP128 KO (G) samples. N = 50 cells per experiment, n = 3 independent experiments. Bar and error represent mean and SD. Unpaired t‐test. n.s.—not significant P > 0.05, **P < 0.01, ***P < 0.001.
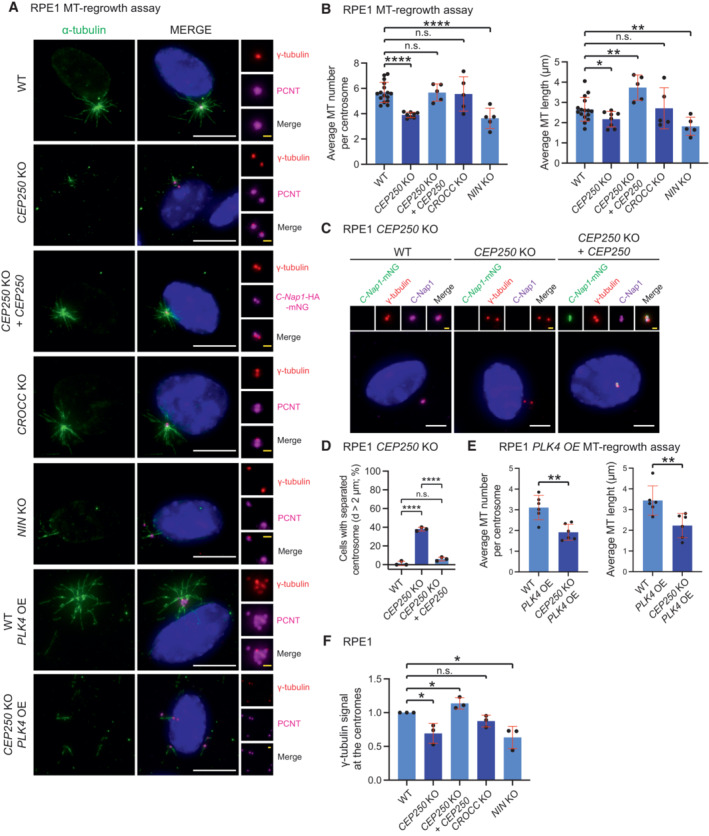
Representative fluorescent images of MT asters nucleated from the centrosome (γ‐tubulin) after in vivo MT regrowth assay. The enlargements on the right show the centrosome signal of the cell in the main panel. Scale bars in white: 10 μm; scale bars in yellow: 1 μm.
Quantification of the average number (left) and length (right) of MTs re‐nucleated from the centrosomes in (A). N = 50 cells per experiment, n ≥ 5 independent experiments. Bar and error represent mean and SD. Unpaired t‐test. n.s.—not significant P > 0.05, *P < 0.05, **P < 0.01, ****P < 0.0001.
Representative fluorescent images of RPE1 CEP250 KO and CEP250 KO expressing C‐Nap1‐HA‐mNeonGreen (CEP250 KO + CEP250). The indicated antibodies were used for indirect fluorescent analysis. Scale bars in white: 5 μm; scale bars in yellow: 1 μm.
Quantification of centrosome separation from (C). N = 50 cells per experiment, n = 3 independent experiments. Bar and error represent mean and SD Unpaired t‐test. n.s.—not significant P > 0.05, ****P < 0.0001.
Quantification of the average number (left) and length (right) of MTs re‐nucleated from the centrosomes in (A) from RPE1 WT and CEP250 KO cells with PLK4 OE. N = 50 cells per experiment, n = 3 independent experiments. Bar and error represent mean and SD Unpaired t‐test. **P < 0.01.
Quantification of relative γ‐tubulin intensity at the centrosome in RPE1 cells. Mean value of relative γ‐tubulin intensity at the centrosome is shown. N = 50 cells per experiment, n = 3 independent experiments. Bar and error represent mean and SD. Unpaired t‐test. n.s.—not significant P > 0.05, *P < 0.05.
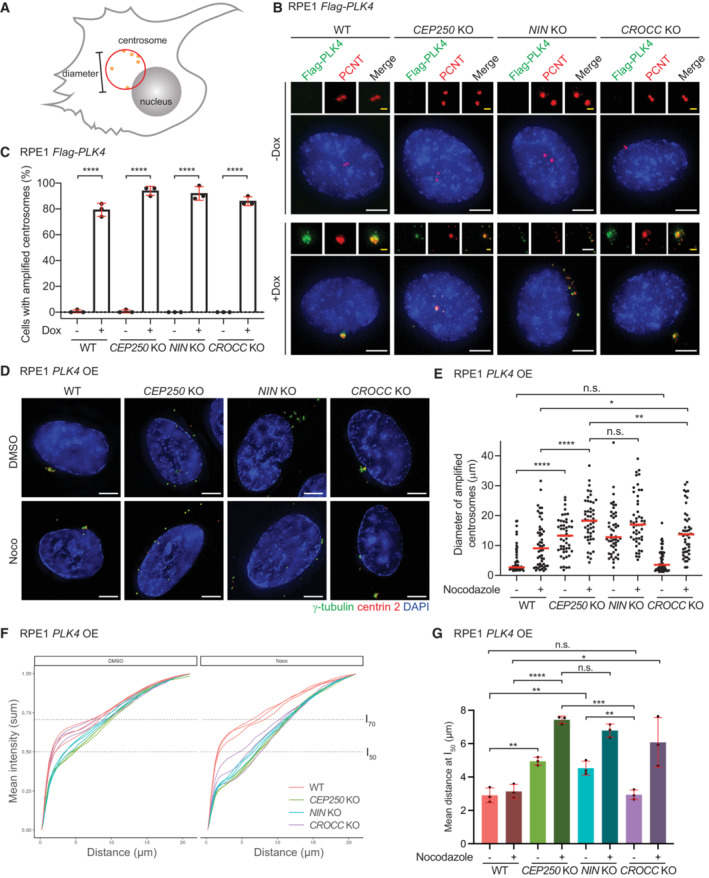
Model of how to measure the diameter of amplified centrosomes.
Fluorescent images of centrosomes in Dox‐inducible Flag‐PLK4 RPE1 WT, CEP250 KO, NIN KO, and CROCC KO cells, with and without Dox induction. Flag‐PLK4 was stained with Flag antibodies, PCNT was used as a centrosome marker and DNA was stained with DAPI. The boxes on top show the enlargement of the centrosome signals of the cell in the main panel. Scale bars in white: 5 μm; scale bars in yellow: 1 μm.
Quantification of amplified centrosomes in cells from (B). N = 50, n = 3 independent experiments. Dots represent the percentage of cells with amplified centrosomes in each sample. Bar and error represent mean and SD. Unpaired t‐test. ****P < 0.0001.
Fluorescent images of centrosomes in Dox‐inducible Flag‐PLK4 RPE1 WT, CEP250 KO, NIN KO, and CROCC KO cells upon 48 h Dox induction, without and with MT depolymerization using Nocodazole. DNA was stained with DAPI. Scale bars: 5 μm.
Quantification of the diameter of amplified centrosomes from (D) as outlined in (A). A representative dataset from six replicates (three replicates per experiment) is shown. N = 50 cells. Dot represents the diameter of amplified centrosomes in each cell with amplified centrosomes. The red lines represent the median. Unpaired t‐test. n.s.—not significant P > 0.05, *P < 0.05, **P < 0.01, ****P < 0.0001.
Mean intensity sum per replicate after radial scanning of the centrosome signal intensity from the brightest point outwards in Dox‐inducible Flag‐PLK4 RPE1 WT (red lines), CEP250 KO (green lines), NIN KO (light blue lines), and CROCC KO (purple lines) cells upon 48 h Dox induction, with and without MT depolymerization using Nocodazole. The dot line, named half intensity (I50), represents the distance where 50% of the maximum intensity was reached. I70 is where 70% of the maximum intensity was reached.
The mean of I50 values from (F). N ≥ 22 cells per replicate, n = 3 biological replicates. Bar and error represent mean and SD. Unpaired t‐test. n.s.—not significant P > 0.05, *P < 0.05, **P < 0.01, ***P < 0.001, ****P < 0.0001. The average of I70 values is shown in Appendix Fig S9E.

Fluorescent images of CEP97 and γ‐tubulin co‐localization, γ‐tubulin, and centrin2 co‐localization in Flag‐PLK4 inducible RPE1 CEP250 KO. Scale bars in white: 10 μm; scale bars in yellow: 5 μm.
Quantification of co‐localizations of γ‐tubulin, CEP97, and Centrin2 foci from (A).
Fluorescent images of centrosomes in Flag‐PLK4 inducible HCT116 WT, CEP250 KO, NIN KO, and CROCC KO cells upon 48 h Dox induction, with and without MT depolymerization using Nocodazole. DNA was stained with DAPI. Scale bars: 5 μm.
Quantification of the diameter of amplified centrosome of cells in (C). A representative dataset from six replicates (three replicates per experiment) is shown. N = 50 cells. Dot represents the diameter of amplified centrosomes in each analyzed cell. Red line represents median. Unpaired t‐test. n.s.—not significant P > 0.05, *P < 0.05, ***P < 0.001, ****P < 0.0001.
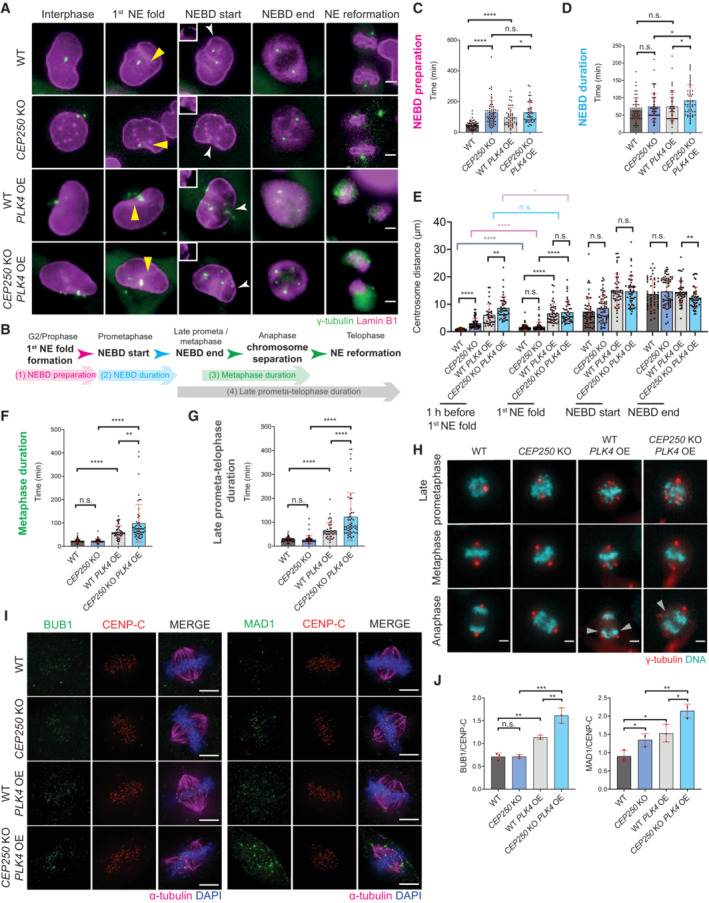
Representative images of live cell imaging analysis of RPE1 WT, CEP250 KO, WT PLK4 OE, and CEP250 KO PLK4 OE cells expressing LaminB1‐mNeonGreen (magenta) and γ‐tubulin‐mRuby2 (green) as markers for the NE and centrosomes, respectively. Yellow arrows indicate first NE fold. White arrows indicate first NE discontinuation. The inlet boxes show enlargement of first NE discontinuation. Scale bars: 5 μm.
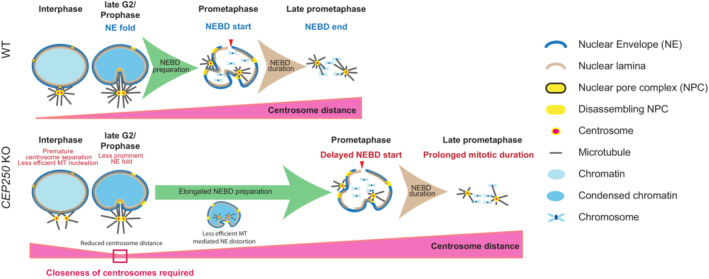
Experiment design. Four critical time points were defined for the analysis: 1st NE fold formation close to the centrosomes; NEBD start (appearance of the first discontinuation in the NE); NEBD end (LaminB1 signal completely dispersed from the NE); NE reformation (reformation of LaminB1 signal around the chromosomes). The time between critical time points was analyzed: (i) NEBD preparation time, (ii) NEBD duration, (iii) metaphase duration, and (iv) late prometa‐telophase duration.
Quantification of NEBD preparation time. WT: n = 54 cells from six independent experiments, CEP250 KO: n = 56 cells from six independent experiments, WT PLK4 OE: n = 48 cells from seven independent experiments, CEP250 KO PLK4 OE: n = 47 cells from eight independent experiments.
Quantification of NEBD duration. WT: n = 54 cells from six independent experiments, CEP250 KO: n = 56 cells from six independent experiments, WT PLK4 OE: n = 48 cells from seven independent experiments, CEP250 KO PLK4 OE: n = 47 cells from eight independent experiments.
Quantification of centrosome distance (in case of WT PLK4 OE and CEP250 KO PLK4 OE cells the centrosome distribution) at 1 h before 1st NE fold formation, 1st NE fold formation, NEBD start, and NEBD end. WT: n = 54 cells from six independent experiments, CEP250 KO: n = 56 cells from six independent experiments, WT PLK4 OE: n = 48 cells from seven independent experiments, CEP250 KO PLK4 OE: n = 47 cells from eight independent experiments.
Quantification of metaphase duration. WT: n = 52 cells from three independent experiments, CEP250 KO: n = 56 cells from three independent experiments, WT PLK4 OE: n = 52 cells from three independent experiments, CEP250 KO PLK4 OE: n = 53 cells from three independent experiments.
Quantification of late prometa‐telophase duration. WT: n = 54 cells from six independent experiments, CEP250 KO: n = 56 cells from six independent experiments, WT PLK4 OE: n = 48 cells from seven independent experiments, CEP250 KO PLK4 OE: n = 47 cells from eight independent experiments.
Representative images from live cell imaging analysis of WT, CEP250 KO, WT PLK4 OE, and CEP250 KO PLK4 OE cells expressing γ‐tubulin‐mRuby2 (red) as a marker for the centrosomes. The DNA was marked by SPY‐DNA650 dye (cyan). Gray arrows highlight chromosome segregation errors. Scale bars: 5 μm.
Fluorescent images of RPE1 WT, CEP250 KO, WT PLK4 OE, and CEP250 KO PLK4 OE cells. BUB1 and MAD1 were stained to analyze the signal distribution or accumulation/persistence. CENP‐C was used as centromere marker, α‐tubulin to visualize the mitotic spindle and DNA was stained with DAPI. Scale bars: 5 μm.
Quantification of BUB1 and MAD1 signal intensity from (I) normalized to the corresponding CENP‐C signal. N ≥ 46 cells, n = 3 independent experiments. Bar and error represent mean and SD. Unpaired t‐test. n.s.—not significant P > 0.05, *P < 0.05, **P < 0.01, ***P < 0.005.

Fluorescent image of mitotic spindles in Dox‐inducible Flag‐PLK4 RPE1 WT, CEP250 KO, NIN KO, and CROCC KO cells upon 48 h Dox induction (PLK4 OE). CW069 was used to partially inhibit HSET. DMSO is solvent control. White scale bars: 5 μm.
Quantification of mitotic cells with multipolar spindle from (A). N = 50 cells per experiment, n = 3 independent experiments. Bar and error represent mean and SD. Unpaired t‐test. *P < 0.05, **P < 0.01, ***P < 0.001.
Quantification of multipolar spindle/chromosome mis‐segregation of Dox‐inducible Flag‐PLK4 RPE1 WT and CEP250 KO cells upon 48 h Dox induction expressing γ‐tubulin‐mScarlet‐I (red) as markers for the centrosomes with or without CW069 treatment. The DNA was marked with SPY‐DNA650 (gray). WT PLK4 OE: n DMSO = 28 cells, n CW069 = 40 cells, CEP250 KO PLK4 OE: n DMSO = 26 cells, n CW069 = 31 cells; from two independent live cell experiments. Bar represents mean. Unpaired t‐test. *P < 0.05.
Time‐lapse analysis of RPE1 WT PLK4 OE and CEP250 KO PLK4 OE cells expressing γ‐tubulin‐mScarlet‐I (red) as markers for the centrosomes followed by 30 h siHSET. The DNA was marked with SPY‐DNA650 (gray). (D) shows representative still images of live cell imaging analysis. Scale bars: 10 μm.
Quantification of multipolar spindle/chromosome mis‐segregation from (D) in RPE1 WT PLK4 OE and CEP250 KO PLK4 OE with siControl and siHSET for 30 h. WT PLK4 OE: n siControl = 59 cells, n siHSET = 59 cells, CEP250 KO PLK4 OE: n siControl = 45 cells, n siHSET = 32 cells; from three independent experiments. Bar and error represent mean and SD. Unpaired t‐test. *P < 0.05, **P < 0.01.

Fluorescent images of RPE1 anaphase cells with supernumerary centrosomes (red; γ‐tubulin) upon 48 h of Flag‐PLK4 Dox induction and CW069 treatment with and without chromosome mis‐segregation. DNA was stained with DAPI. White arrows show lagging and bridging chromosomes. Scale bars: 5 μm.
Quantification of anaphase cells from (A) with chromosome mis‐segregation in Flag‐PLK4 inducible RPE1 WT and CEP250 KO upon 48 h Dox induction and with or without HSET inhibitor CW069 treatment. N = 45 cells per experiment, n = 3 independent experiments. Bar and error represent mean and SD. Unpaired t‐test. **P < 0.01, ***P < 0.001.
Experimental design of siHSET (30 h) live cell analysis.
Western blot of HSET in RPE1 WT and CEP250 KO cells with PLK4 OE after 30 h siRNA treatment. GAPDH was used as a loading control.
Representative fluorescent images of HSET signal at mitotic spindles in Dox‐inducible Flag‐PLK4 RPE1 WT cells after siControl and siHSET (30 h). γ‐tubulin was used as centrosome maker, α‐tubulin to visualize the spindle, and DAPI to stain DNA. Scale bars: 5 μm.
Quantification of relative HSET intensity at the metaphase spindle from (G). N = 50 cells; a representative dataset from two independent experiments is shown. Dot represents the relative intensity of HSET at the metaphase spindle in each cell. Mean is shown in red. Unpaired t‐tests. ****P < 0.0001.
Fluorescent image of mitotic spindles in Dox‐inducible Flag‐PLK4 HCT116 WT, CEP250 KO, NIN KO, and CROCC KO cells upon 48 h Dox induction (PLK4 OE). CW069 was used to partially inhibit HSET. Scale bars: 5 μm.
Quantification of mitotic cells with multipolar spindle in Dox‐inducible Flag‐PLK4 HCT116 WT, CEP250 KO, NIN KO, and CROCC KO cells upon 48 h Dox induction. HSET was inhibited by CW069 addition. DMSO was added as solvent control. N = 50 cells per experiment, n = 3 independent experiments. Bar and error represent mean and SD. Unpaired t‐tests. n.s.—not significant P > 0.05, **P < 0.01.
References
-
- Banterle N, Gönczy P (2017) Centriole biogenesis: from identifying the characters to understanding the plot. Annu Rev Cell Dev Biol 33: 23–49 - PubMed
-
- Beaudouin J, Gerlich D, Daigle N, Eils R, Ellenberg J (2002) Nuclear envelope breakdown proceeds by microtubule‐induced tearing of the lamina. Cell 108: 83–96 - PubMed
-
- Bettencourt‐Dias M, Rodrigues‐Martins A, Carpenter L, Riparbelli M, Lehmann L, Gatt MK, Carmo N, Balloux F, Callaini G, Glover DM (2005) SAK/PLK4 is required for centriole duplication and flagella development. Curr Biol 15: 2199–2207 - PubMed
Publication types
MeSH terms
Substances
LinkOut - more resources
Full Text Sources
