. 2023 Oct;19(7):2251-2273.
doi: 10.1007/s12015-023-10580-8. Epub 2023 Jul 4.

Sex Hormone-Binding Globulin (SHBG) Maintains Proper Equine Adipose-Derived Stromal Cells (ASCs)' Metabolic Functions and Negatively Regulates their Basal Adipogenic Potential

Affiliations

Sex Hormone-Binding Globulin (SHBG) Maintains Proper Equine Adipose-Derived Stromal Cells (ASCs)' Metabolic Functions and Negatively Regulates their Basal Adipogenic Potential

Lynda Bourebaba et al. Stem Cell Rev Rep. 2023 Oct.

Abstract

Background: Sex hormone binding globulin (SHBG) deteriorated expression has been recently strongly correlated to increased level of circulating pro-inflammatory cytokines and insulin resistance, which are typical manifestations of equine metabolic syndrome (EMS). Despite previous reports demonstrated the potential therapeutic application of SHBG for liver-related dysfunctions, whether SHBG might modulate equine adipose-derived stem/stromal cells (EqASCs) metabolic machinery remains unknown. Therefore, we evaluated for the first time the impact of SHBG protein on metabolic changes in ASCs isolated from healthy horses.

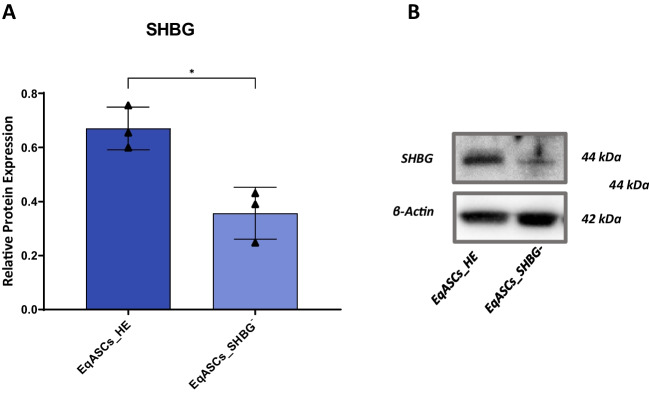
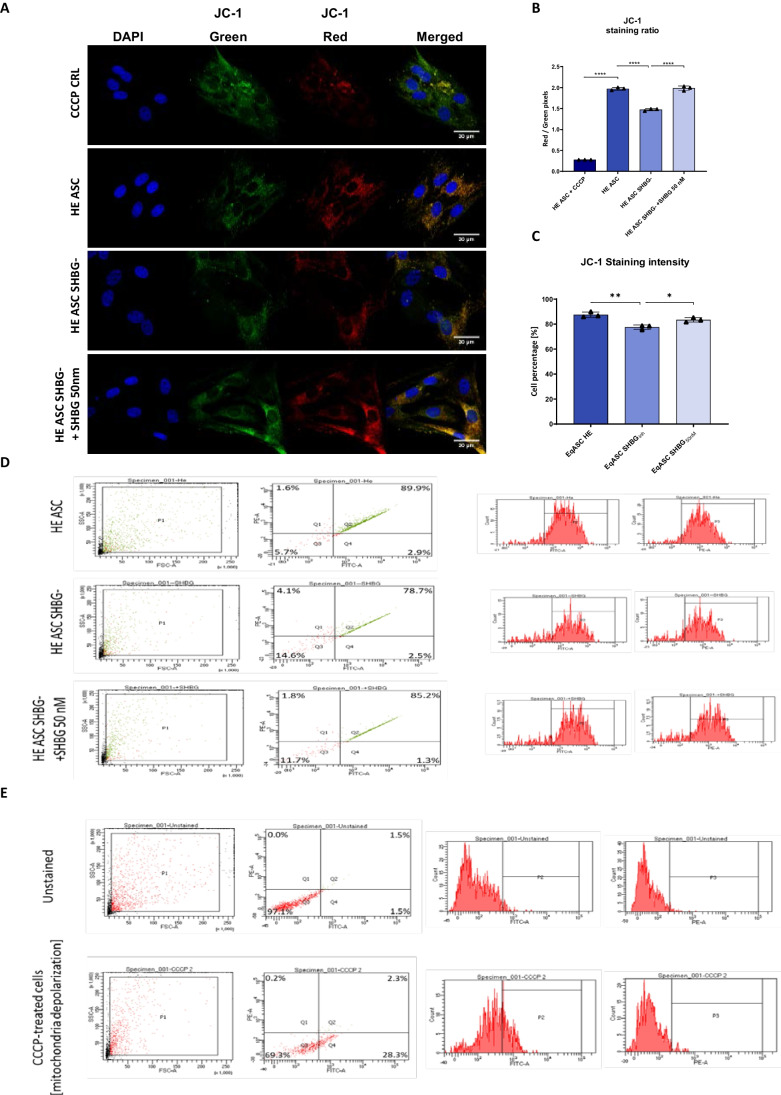
Methods: Beforehand, SHBG protein expression has been experimentally lowered using a predesigned siRNA in EqASCs to verify its metabolic implications and potential therapeutic value. Then, apoptosis profile, oxidative stress, mitochondrial network dynamics and basal adipogenic potential have been evaluated using various molecular and analytical techniques.

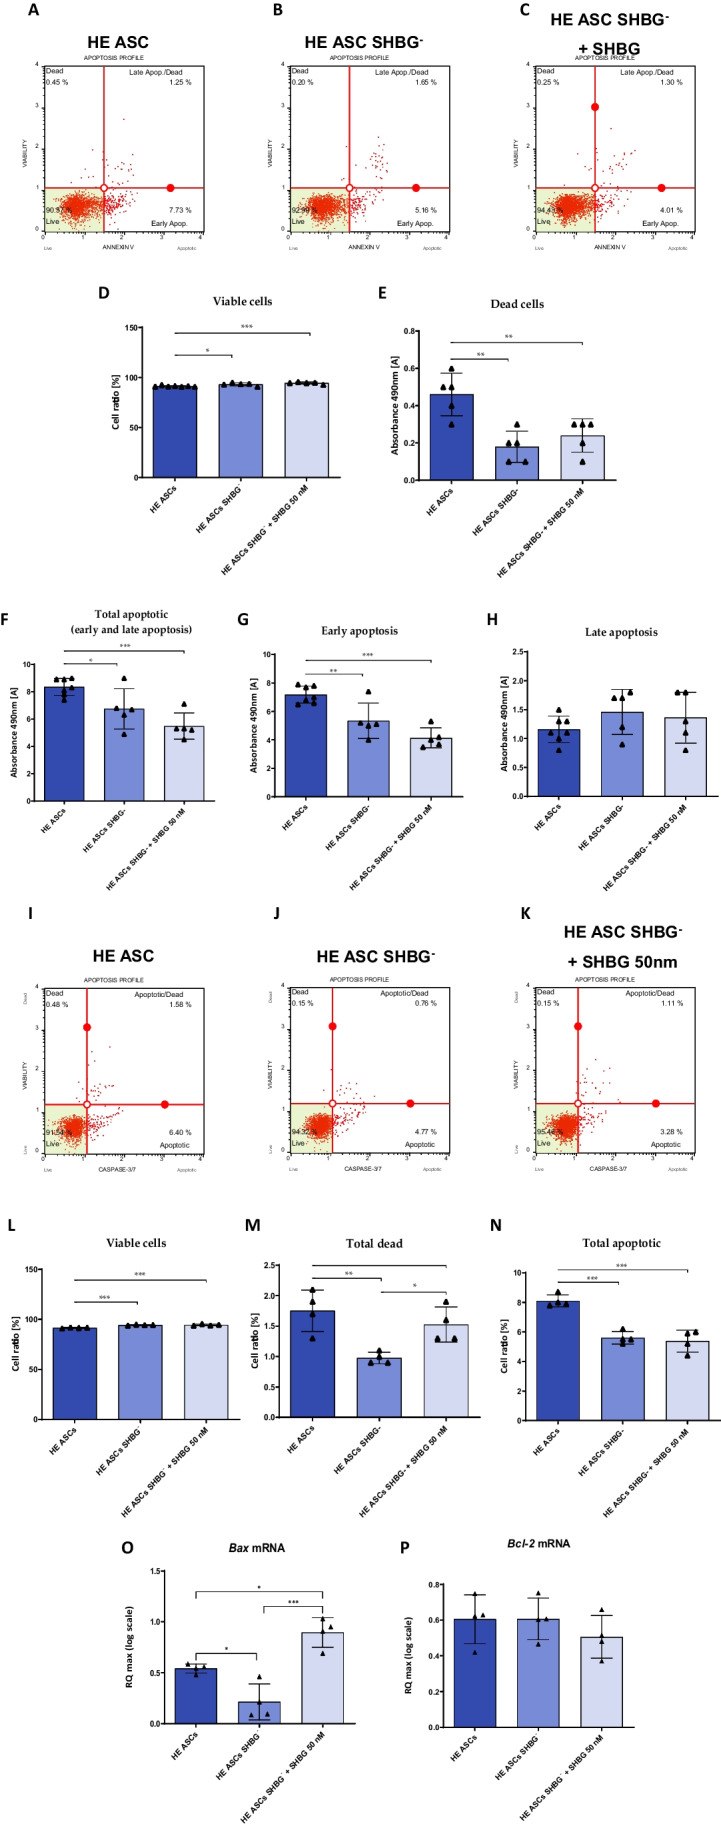
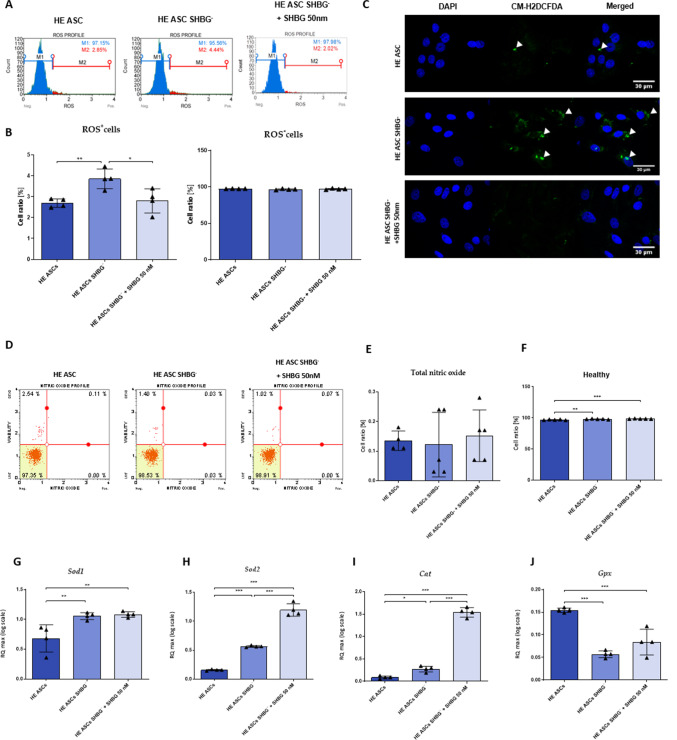
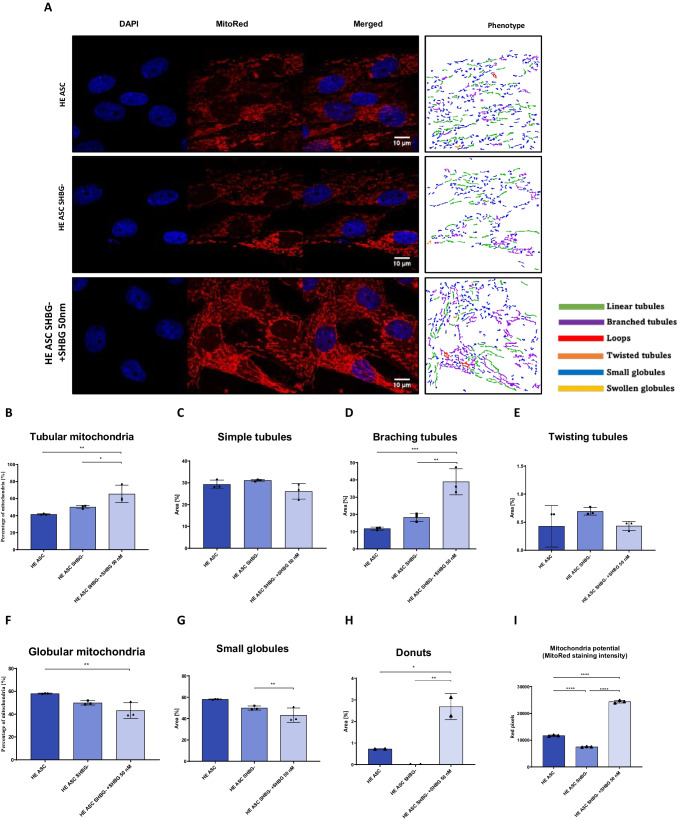
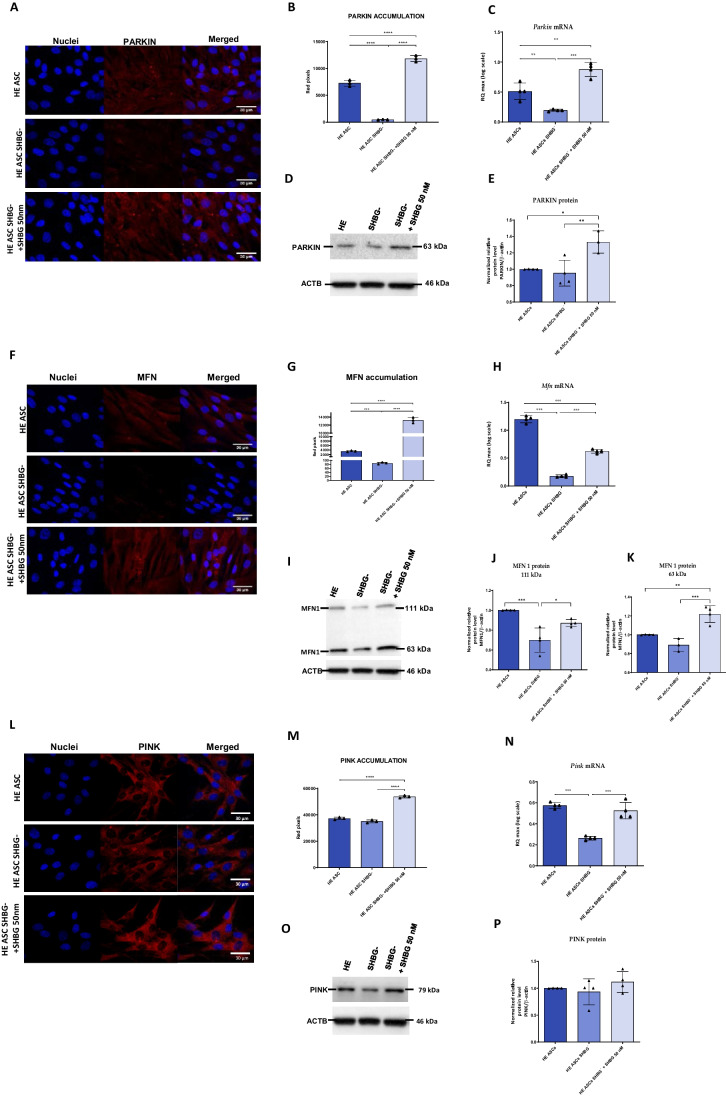
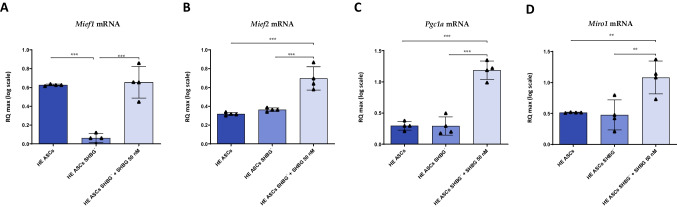
Results: The SHBG knockdown altered the proliferative and metabolic activity of EqASCs, while dampening basal apoptosis via Bax transcript suppression. Furthermore, the cells treated with siRNA were characterized by senescent phenotype, accumulation of reactive oxygen species (ROS), nitric oxide, as well as decreased mitochondrial potential that was shown by mitochondrial membrane depolarization and lower expression of key mitophagy factors: PINK, PARKIN and MFN. The addition of SHBG protein reversed the impaired and senescent phenotype of EMS-like cells that was proven by enhanced proliferative activity, reduced apoptosis resistance, lower ROS accumulation and greater mitochondrial dynamics, which is proposed to be related to a normalization of Bax expression. Crucially, SHBG silencing enhanced the expression of key pro-adipogenic effectors, while decreased the abundance of anti-adipogenic factors namely HIF1-α and FABP4. The addition of exogenous SHBG further depleted the expression of PPARγ and C/EBPα and restored the levels of FABP4 and HIF1-α evoking a strong inhibitory potential toward ASCs adipogenesis.

Conclusion: Herein, we provide for the first time the evidence that SHBG protein in importantly involved in various key metabolic pathways governing EqASCs functions, and more importantly we showed that SHBG negatively affect the basal adipogenic potential of tested ASCs through a FABP4-dependant pathway, and provide thus new insights for the development of potential anti-obesity therapeutic approach in both animals and humans.

Keywords: ASCs; Antiadipogenic; Apoptosis; Knockdown; Mitochondrial dynamics; SHBG.


Conflict of interest statement

Not Applicable.

Figures

Fig. 1
Fig. 1
SHBG silencing efficiency (A). Protein expression was detected using Western blot technique (B). Significant differences were calculated for normalized values and shown as means ± SD. *p value < 0.05
Fig. 2
Fig. 2
Morphology and viability of native, SHBG-silenced and after exogenous SHBG treatment. Morphology was evaluated under a confocal microscope of stained cells with – DAPI for cell nuclei, − phalloidin for F-actin cytoskeleton and mitoRed for mitochondrion (A). Metabolic activity was determined using MTS assay. The unit of metabolic activity factor was determined for silenced and treated cells, in reference to the native cells (considered as 1 = 100% of metabolic activity) (B). The proliferative capacity evaluated based on Ki67 expression and accumulation (C, D). Cell senescence was checked by β-galactosidase staining (E, F). Wound healing test (G-J). Bars representing means ± SD. *p value < 0.05, **p value < 0.01, ***p value < 0.001 and ****p value < 0,0001
Fig. 3
Fig. 3
Impact of SHBG downregulation on apoptosis machinery. Apoptosis profile plots (A-C). Bar graphs showing the percentage of viable (D) and dead (E) cells and total apoptotic (F), early apoptotic (G), and late apoptotic (H) cells. Caspase-3/7 profile plots (I-K). Bar graphs depicting the percentage of viable (L), dead (M) and total apoptotic (N) cells. Representative bar graphs of the relative expression of apoptotic key markers Bax (O) and Bcl-2 (P). Representative data are shown as mean ± SD. *p value < 0.05, **p value < 0.01 and ***p value < 0.001
Fig. 4
Fig. 4
Evaluation of the oxidative status under SHBG deficiency condition. Histograms showing the distribution of cells based on ROS accumulation (A) and comparative analysis of ROS+ and ROS cells (B). ROS cells labeled with CM-H2DCFDA staining and analyzed by confocal microscopy (C). Representative plots showing the distribution of cells based on intracellular accumulation of nitric oxide (D) and statistical analysis of total nitric oxide (E) and healthy (F) cells. Graphs showing the relative expression of oxidative stress markers Sod1 (G), Sod2 (H), Cat (I) and Gpx (J). Representative data are shown as mean ± SD. *p value < 0.05, **p value < 0.01 and ***p value < 0.001
Fig. 5
Fig. 5
Analysis of mitochondrial network organization and transmembrane potential in the absence and presence of SHBG protein (A), classification of mitochondrial morphology (B-H) and analysis of mitochondrial network and membrane potential (A) and classification of mitochondrial morphology (B-H). Means ± SD as columns and bars. *p value < 0.05, **p value < 0.01, ***p value < 0.001 and ****p value < 0.0001
Fig. 6
Fig. 6
Impact of SHBG knockdown on potential and depolarization of the mitochondrial membrane. Analysis was performed using a confocal microscope using the specific JC-1 Red and JC-1 Green stains (A) and the results are presented in the form of a staining quantification graph (B). JC-1 staining was also evaluated using the FACS method (C-E). Representative data are shown as mean ± SD. *p value < 0.05, **p value < 0.01, and ****p value < 0.0001
Fig. 7
Fig. 7
Changes in mitochondrial dynamics and mitophagy regulators expression following SHBG downregulation. PARKIN (A-E), PINK1 (F-K) and MFN1 (L-P) were determined based on antibody labeling analyzed by confocal microscope (A, B, F, G, L, M), mRNA (C, H, N) and protein levels (representative blots C, D, I-K, O, P). Representative data are shown as mean ± SD. * p value < 0.05, **p value < 0.01, ***p value < 0.001 and ****p value < 0.0001
Fig. 8
Fig. 8
Representative graphs showing the relative expression levels of genes involved in mitochondrial metabolism. The expression of Mief1 (A), Mief2 (B), Pgc1a (C) and Miro1 (D) was performed by RT-PCR analysis. Representative data are shown as mean ± SD. **p value < 0.01, ***p value < 0.001
Fig. 9
Fig. 9
SHBG and adipogenesis regulators interplay analysis. The relative expression levels of Acly (A), Hif1a (B), Pparγ (C) and Srebp1c (D) were analyzed by RT-PCR. Protein levels of CEBBPα (E), FABP4 (F), GLUT-4 (H, I) and FASN (J) were analyzed by Western Blot (G, representative membranes). Representative data are shown as mean ± SD. **p value < 0.01, ***p value < 0.001 and ****p value < 0.0001

References

    1. Hammond GL. Diverse roles for sex hormone-binding globulin in reproduction. Biology of Reproduction. 2011;85(3):431–441. doi: 10.1095/biolreprod.111.092593. - DOI - PMC - PubMed
    1. Hammond GL. Diverse roles for sex hormone-binding globulin in reproduction. Biology of Reproduction. 2011;85(3):431–441. doi: 10.1095/biolreprod.111.092593. - DOI - PMC - PubMed
    1. Simó R, Sáez-López C, Barbosa-Desongles A, Hernández C, Selva DM. Novel insights in SHBG regulation and clinical implications. Trends in Endocrinology & Metabolism. 2015;26(7):376–383. doi: 10.1016/j.tem.2015.05.001. - DOI - PubMed
    1. Saéz-López C, Rivera-Giménez M, Hernández C, Simó R, Selva DM. SHBG-C57BL/ksJ-db/db: A new mouse model to study SHBG expression and regulation during obesity development. Endocrinology. 2015;156(12):4571–4581. doi: 10.1210/en.2015-1677. - DOI - PubMed
    1. Saez-Lopez, C., Barbosa-Desongles, A., Hernandez, C., Dyer, R. A., Innis, S. M., Simó, R., & Selva, D. M. (2017). Sex hormone-binding globulin reduction in metabolic disorders may play a role in NAFLD development. EndocrinologyJN.10.1210/en.2016-1668 - PubMed

Publication types

MeSH terms

Substances