. 2023 Aug;32(8):e4719.
doi: 10.1002/pro.4719.

Analysis of neutral mutational drift in an allosteric enzyme

Affiliations

Analysis of neutral mutational drift in an allosteric enzyme

Evan T Liechty et al. Protein Sci. 2023 Aug.

Abstract

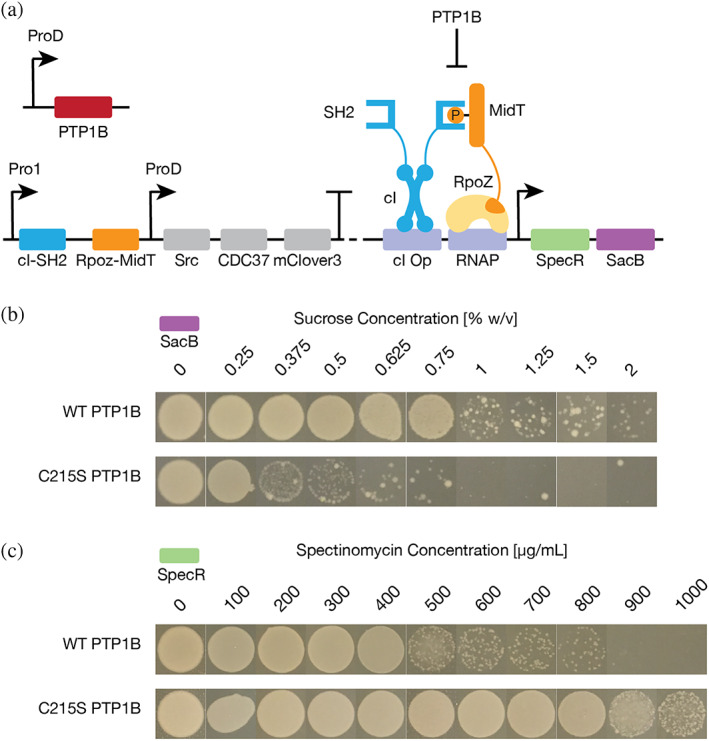
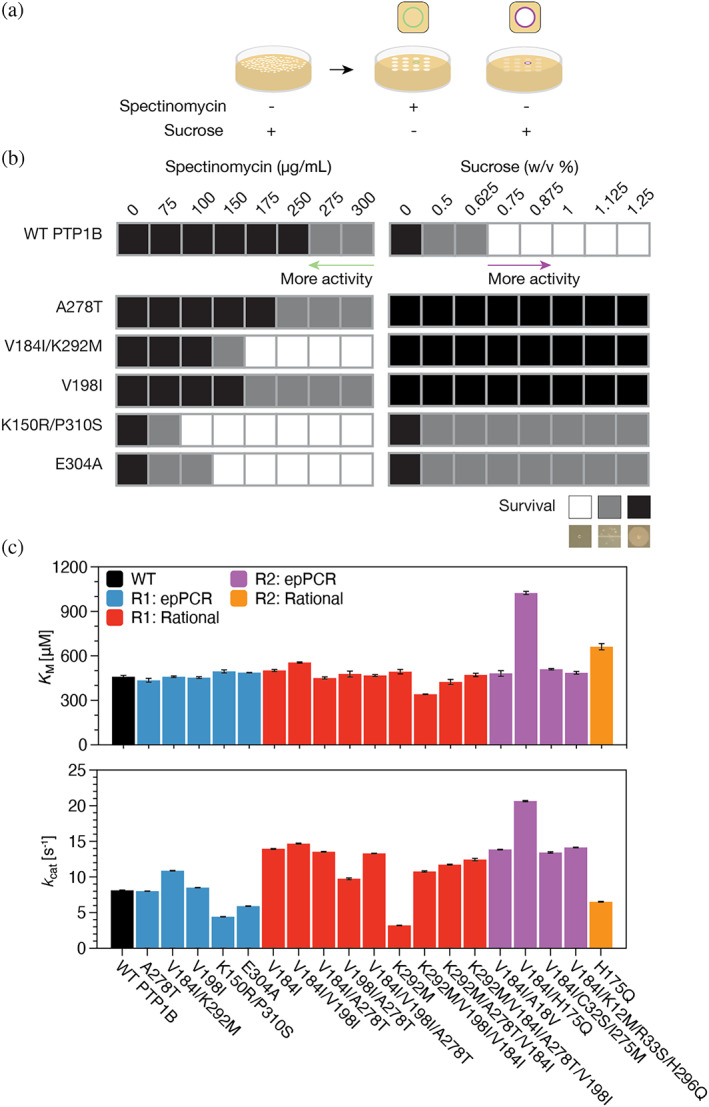
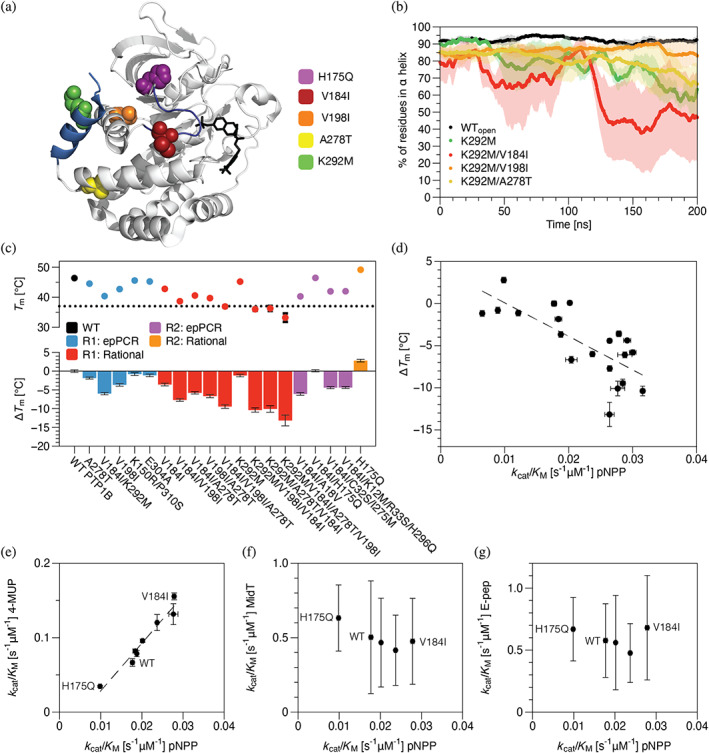
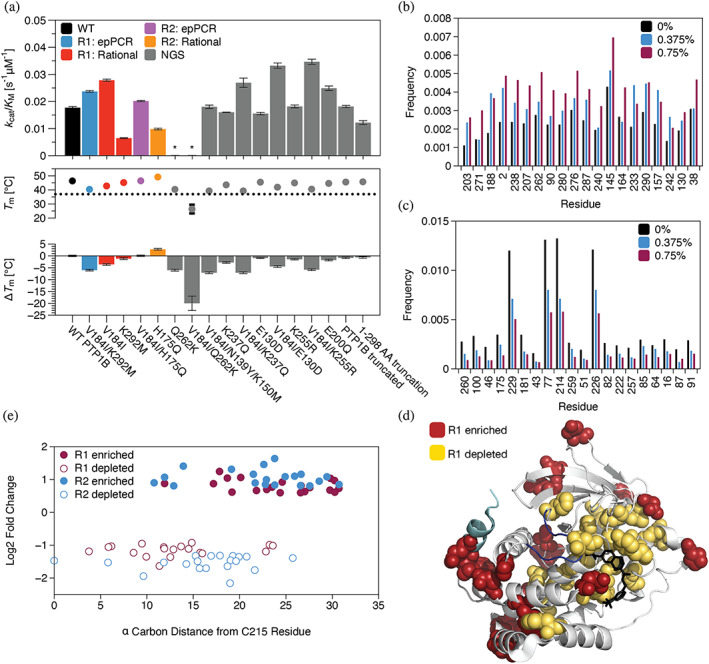
Neutral mutational drift is an important source of biological diversity that remains underexploited in fundamental studies of protein biophysics. This study uses a synthetic transcriptional circuit to study neutral drift in protein tyrosine phosphatase 1B (PTP1B), a mammalian signaling enzyme for which conformational changes are rate limiting. Kinetic assays of purified mutants indicate that catalytic activity, rather than thermodynamic stability, guides enrichment under neutral drift, where neutral or mildly activating mutations can mitigate the effects of deleterious ones. In general, mutants show a moderate activity-stability tradeoff, an indication that minor improvements in the activity of PTP1B do not require concomitant losses in its stability. Multiplexed sequencing of large mutant pools suggests that substitutions at allosterically influential sites are purged under biological selection, which enriches for mutations located outside of the active site. Findings indicate that the positional dependence of neutral mutations within drifting populations can reveal the presence of allosteric networks and illustrate an approach for using synthetic transcriptional systems to explore these mutations in regulatory enzymes.

Keywords: neutral drift; protein allostery; protein evolutionary patterns; protein tyrosine phosphatases.


Conflict of interest statement

Jerome M. Fox is a founder of Think Bioscience, Inc., which develops small‐molecule therapeutics and employs Jerome M. Fox and Levi Kramer, who hold equity interests in the company. Think Bioscience is exploring many drug targets, including protein tyrosine phosphatases such as PTP1B. Michael R. Shirts is an Open Science Fellow at and consultant for Psivant Sciences, and a consultant for Relay Therapeutics.

Figures

FIGURE 1
FIGURE 1
A dual selection system enables detection of intracellular PTP1B activity. (a) A bacterial two‐hybrid (B2H) system that links the inactivation of PTP1B to the transcriptional activation of genes that confer spectinomycin resistance (SpecR) and sucrose sensitivity (SacB). Major components include (i) a kinase substrate (MidT) fused to the omega subunit of RNA polymerase (RpoZ), (ii) a Src Homology 2 (SH2) domain fused to the 434 phage cI repressor (cI), (iii) an operator for 434cI (cI op), (iv) a binding site for RNA polymerase (RNAP), and (v) the remainder of RNA polymerase (yellow) (Sarkar et al., 2021). PTP1B is encoded by a separate plasmid. Src and PTP1B promote and inhibit SH2‐MidT binding via phosphorylation and dephosphorylation, respectively. (b, c) Images show the growth of B2H‐encoded E. coli cells on agar plates with different concentrations of (b) sucrose or (c) spectinomycin. Active PTP1B, which prevents transcriptional activation, confers (b) resistance to sucrose and (c) sensitivity to spectinomycin. Inactive PTP1B confers (b) sensitivity to sucrose and (c) resistance to spectinomycin.
FIGURE 2
FIGURE 2
Error‐prone PCR yields neutral mutants of PTP1B. (a) We examined epPCR libraries for active PTP1B in four steps: (i) We plated cells containing the B2H system and library plasmids on plates with 0%–1% sucrose. (ii) We selected colonies that grew at sucrose concentrations matching or slightly exceeding those tolerated by wild‐type PTP1B (0.375%–1.0% and 0.375%–0.75% sucrose for the R1 and R2 libraries, respectively) and used them to inoculate liquid cultures. (iii) We dropped liquid cultures onto plates with either 0%–1.25% sucrose or 0–300 μg/mL spectinomycin (image right of arrow). (iv) We selected hits that preserved or enhanced sucrose tolerance and spectinomycin sensitivity. (b) The growth of hits from our selection on solid media with different concentrations of spectinomycin (left) or sucrose (right). (c) Kinetic analysis of purified mutants on p‐nitrophenyl phosphate (pNPP). Despite minor changes in k cat—and, for V184I/H175Q, K M —selected mutations changed PTP1B activity (k cat/K M ) by two‐fold or less (Figure S6). R1 denotes the initial epPCR library; R2, the epPCR library of V184I variants. The label “rational” denotes mutants generated via site‐directed mutagenesis. Data represent the mean and standard error for n ≥ 3 technical replicates.
FIGURE 3
FIGURE 3
Mutations identified in neutral drift tend to reduce thermodynamic stability but exhibit substrate‐specific effects on activity. (a) A crystal structure of PTP1B (PDB entry 2f71) shows the locations of a subset of neutral (V198I and A278T), activating (V184I), or inactivating (K292M and H175Q) mutations identified in neutral drift experiments (PDB entry 2a5j). Highlights: competitive inhibitor (black), ⍺7 helix (285–298, light blue), and WPD loop (178–185, dark blue). (b) The percent of residues in the core of the ⍺7 helix (287–295) that exhibit ⍺‐helical conformations in each uncorrelated trajectory frame of MD trajectories. Mutant K292M accelerates ⍺7 helix disordering, and V198I suppresses this disruptive effect. (c) We used differential scanning calorimetry (DSF) to measure changes in the melting temperature of PTP1B: ΔT m = T m‐mut − T m‐WT. Most mutations reduced the melting temperature, an effect that was largely additive when mutations were combined. (d) Mutation‐derived shifts in melting temperature and catalytic activity are moderately correlated (r 2 = 0.55). (e) The activities of mutants on two model substrates—pNPP and 4‐methylumbelliferyl phosphate (4‐MUP)—are strongly correlated and differ by two‐ to four‐fold, depending on substrate; all have similar activities on (f) MidT and (g) E‐Pep, two phosphopeptides. MidT = EPQpYEEIPIYL, and E‐Pep = DADEpYLIPQQG. In b‐g, data depict the mean and standard error for n ≥ 3 technical replicates (MD and kinetic data) or mean and standard deviation for n ≥ 12 technical replicates (T m).
FIGURE 4
FIGURE 4
Catalytically influential residues outside of the active site resist mutations under neutral drift. (a) Analysis of mutants identified in NGS (gray). Top: The catalytic efficiencies (k cat/K M) of selected variants on pNPP matched or slightly exceed that of the wild type. Bottom: Most mutations reduced melting temperature (T m), an effect that was largely additive when mutations were combined. Data depict the mean and standard error for n ≥ 3 technical replicates (kinetic data) or mean and standard deviation for n ≥ 12 technical replicates (T m). (b, c) Analysis of enrichment in the R1 library (we used 0.375% and 0.75% sucrose plates for both R1 and R2 libraries). These plots show the normalized frequency of mutations at sites where mutations were (b) most enriched or (c) most depleted by selection on 0.75% sucrose. Bars show mutation frequencies at 0, 0.375, and 0.75% sucrose. (d) A crystal structure of PTP1B shows the locations of the sites where mutations were most enriched (red) or most depleted (yellow; PDB entry 2f71). Highlights: competitive inhibitor (black), ⍺7 helix (light blue), and WPD loop (dark blue). (e) With the exception of Q262, the most mutationally enriched sites in the R1 library were located outside of the active site (i.e., ≥ 15 Å from the C⍺ carbon of the catalytic cysteine), while the most mutationally depleted sites extended from the active site to almost 25 Å away. Trends in the R2 library were similar with more enriched mutations close to the active site.
FIGURE 5
FIGURE 5
Q262K is a substrate‐trapping mutant. (a) A luminescent B2H system that enables arabinose‐inducible titration of PTP1B from a second plasmid. The base B2H has an inactive variant of PTP1B (C215S) that does not interfere with SH2‐MidT binding. (b) Titration of wild‐type and Q262K variants reduces the luminescent signal; C215S has a negligible effect. The depletion of luminescence by Q262K, a mutation that inactivates PTP1B, suggests that it binds and sequesters MidT.

References

    1. Abraham MJ, Murtola T, Schulz R, Páll S, Smith JC, Hess B, et al. Gromacs: high performance molecular simulations through multi‐level parallelism from laptops to supercomputers. SoftwareX. 2015;1–2:19–25.
    1. Akashi H, Osada N, Ohta T. Weak selection and protein evolution. Genetics. 2012;192:15–31. - PMC - PubMed
    1. Amarasinghe SL, Su S, Dong X, Zappia L, Ritchie ME, Gouil Q. Opportunities and challenges in long‐read sequencing data analysis. Genome Biol. 2020;21:30. - PMC - PubMed
    1. Arcus VL, Prentice EJ, Hobbs JK, Mulholland AJ, Van Der Kamp MW, Pudney CR, et al. On the temperature dependence of enzyme‐catalyzed rates. Biochemistry. 2016;55:1681–1688. - PubMed
    1. Barr AJ, Ugochukwu E, Lee WH, King ONF, Filippakopoulos P, Alfano I, et al. Large‐scale structural analysis of the classical human protein tyrosine Phosphatome. Cell. 2009;136:352–363. - PMC - PubMed

Publication types

LinkOut - more resources