. 2023 Aug 15;133(16):e168965.
doi: 10.1172/JCI168965.

Transepidermal water loss rises before food anaphylaxis and predicts food challenge outcomes

Affiliations

Transepidermal water loss rises before food anaphylaxis and predicts food challenge outcomes

Charles F Schuler 4th et al. J Clin Invest. .

Abstract

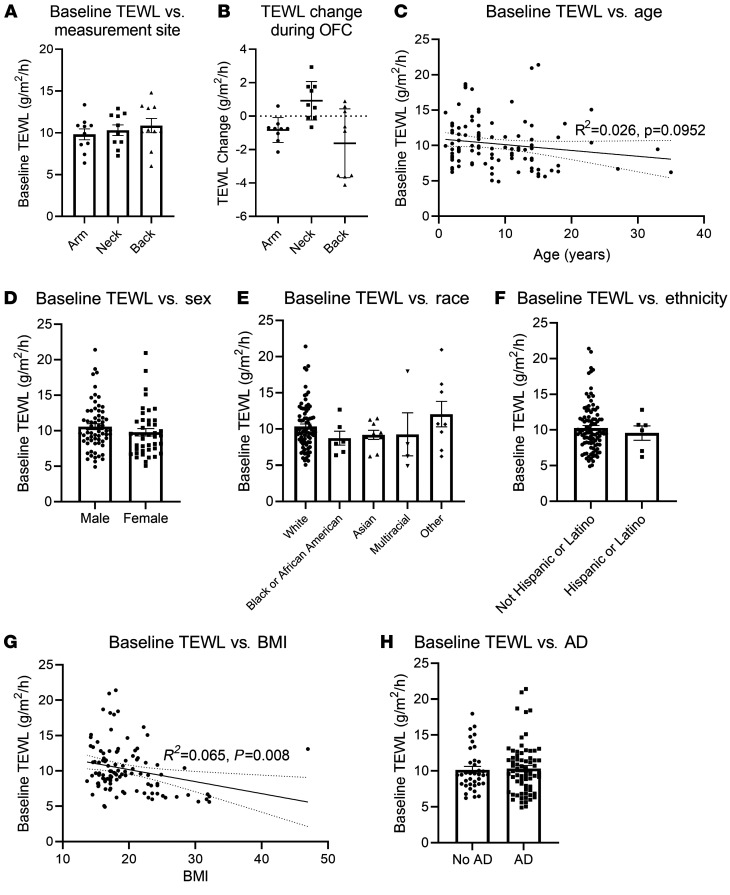
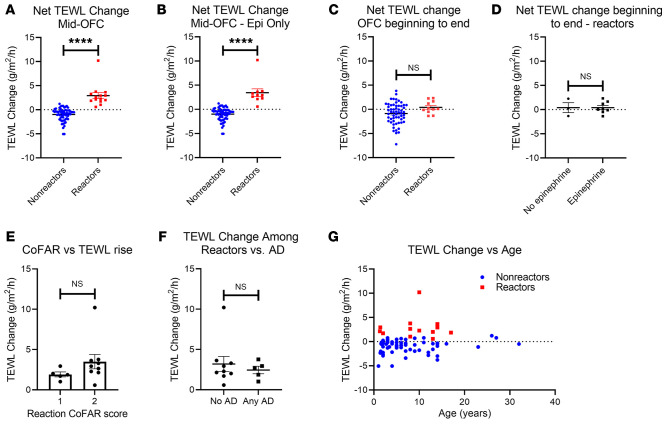
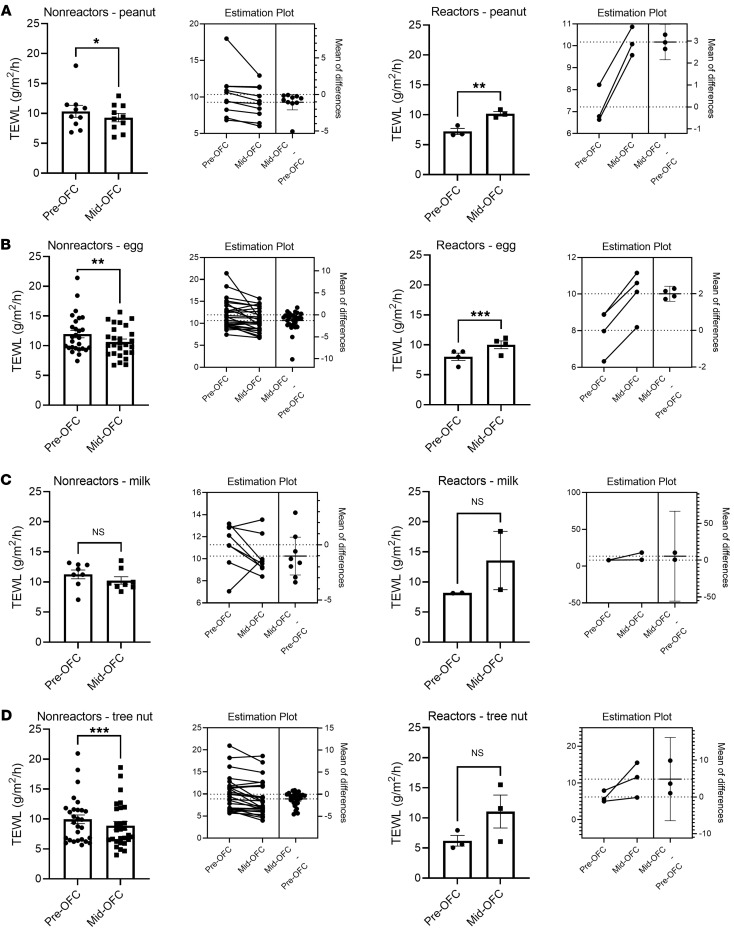
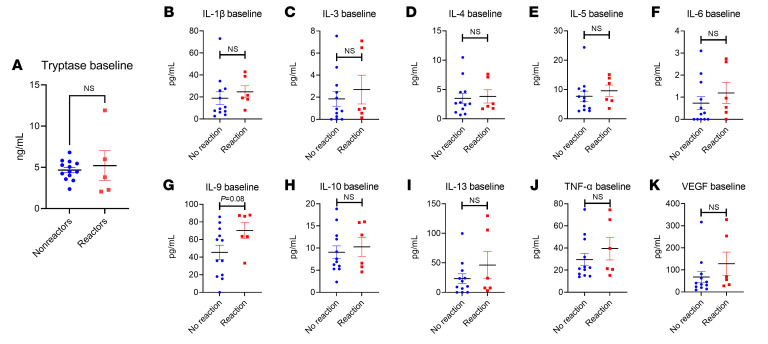
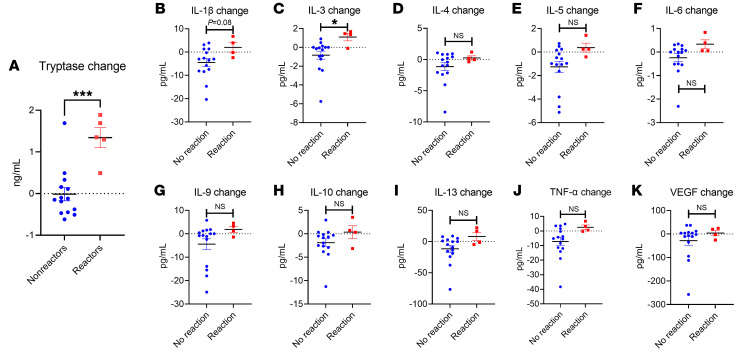
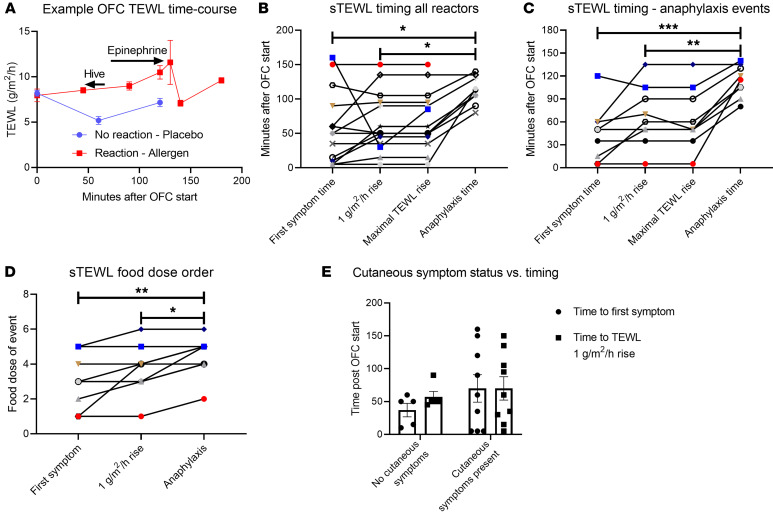
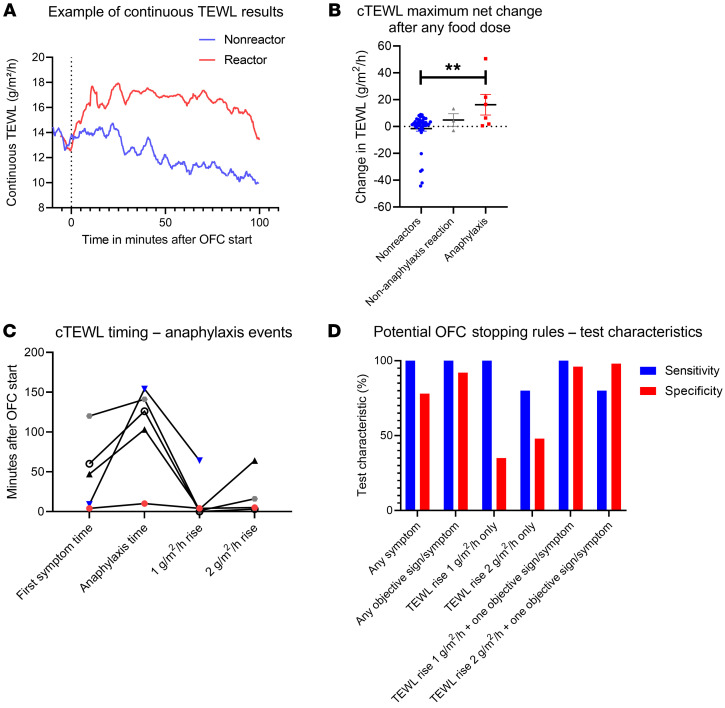
BACKGROUNDFood allergy (FA) is a growing health problem requiring physiologic confirmation via the oral food challenge (OFC). Many OFCs result in clinical anaphylaxis, causing discomfort and risk while limiting OFC utility. Transepidermal water loss (TEWL) measurement provides a potential solution to detect food anaphylaxis in real time prior to clinical symptoms. We evaluated whether TEWL changes during an OFC could predict anaphylaxis onset.METHODSPhysicians and nurses blinded to the TEWL results conducted and adjudicated the results of all 209 OFCs in this study. A study coordinator measured TEWL throughout the OFC and had no input on the OFC conduct. TEWL was measured 2 ways in 2 separate groups. First, TEWL was measured using static, discrete measurements. Second, TEWL was measured using continuous monitoring. Participants who consented provided blood samples before and after the OFCs for biomarker analyses.RESULTSTEWL rose significantly (2.93 g/m2/h) during reactions and did not rise during nonreacting OFCs (-1.00 g/m2/h). Systemic increases in tryptase and IL-3 were also detected during reactions, providing supporting biochemical evidence of anaphylaxis. The TEWL rise occurred 48 minutes earlier than clinically evident anaphylaxis. Continuous monitoring detected a significant rise in TEWL that presaged positive OFCs, but no rise was seen in the OFCs that resulted in no reaction, providing high predictive specificity (96%) for anaphylaxis against nonreactions 38 minutes prior to anaphylaxis onset.CONCLUSIONSDuring OFCs, a TEWL rise anticipated a positive clinical challenge. TEWL presents a monitoring modality that may predict food anaphylaxis and facilitate improvements in OFC safety and tolerability.

Keywords: Allergy; Clinical practice; Diagnostics; Immunology; Inflammation.


Figures

Figure 1
Figure 1. Influence of participants’ intrinsic characteristics on baseline TEWL.
(A) Baseline TEWL results from 3 body areas (volar forearm, supraclavicular neck, upper posterior torso over the scapula). n = 10 per group. (B) Difference between baseline TEWL and TEWL at food dose 2 or 3 during the OFC. n = 9 per group. (CH) Baseline TEWL on volar forearm shown by age (n = 107), sex (n = 107), race (n = 106), ethnicity (n = 105), BMI (n = 107), and AD status (n = 107). (C and G) Simple linear regression results with baseline static TEWL as the dependent variable and (C) age or (G) BMI as the sole independent variables.
Figure 2
Figure 2. Change in sTEWL during OFC.
(A and B) Difference between baseline TEWL and TEWL at food dose 2 or 3 (nonreactors, n = 62) or prior to epinephrine or other treatment (reactors) during the OFC. (A) All reactors (n = 14) and (B) only the reactors who required epinephrine (Epi) (n = 10). (C) Difference between baseline TEWL and TEWL at the end of the OFC (nonreactor, n = 58; reactor, n = 11). (D) Difference between baseline TEWL and TEWL at the end of the OFC for reactors only, separated according to participants who required epinephrine (n = 8) and those who did not (n = 3). (E) Difference between baseline TEWL and prior to epinephrine or other treatment versus CoFAR grade of anaphylaxis (n = 14). (F) Difference between baseline TEWL and prior to epinephrine or other treatment versus AD status (n = 14). (G) Difference between baseline TEWL and TEWL at food dose 2 or 3 (nonreactors, n = 62) or prior to epinephrine or other treatment (reactors, n = 14) during the OFC, shown by age and color coded for reaction status. Simple t tests were used to compare means for 2-variable plots. ****P < 0.0001.
Figure 3
Figure 3. Change in sTEWL results by food type.
Each panel shows the change in TEWL from baseline to either food dose 2 or 3 for nonreactors or prior to epinephrine or other treatment for reactors, with each panel delineated by food type. Estimation plots for pairwise P values for each group are shown. (A) Peanut OFCs (nonreactors, n = 10; reactors, n = 3). (B) Egg OFCs, which included both baked and cooked egg challenges (nonreactors, n = 27; reactors, n = 4). (C) Milk OFCs, which included both baked and unbaked milk OFCs (nonreactors, n = 8; reactors, n = 2). (D) Tree nut OFCs, which included all tree nut OFCs in the study (nonreactors, n = 28; reactors, n = 3). Paired t tests were used to compare means for 2-variable plots. *P < 0.05, **P < 0.01, and ***P < 0.001.
Figure 4
Figure 4. Baseline systemic immune markers.
Baseline plasma results for (A) tryptase (n = 20), (B) IL-1β, (C) IL-3, (D) IL-4, (E) IL-5, (F) IL-6, (G) IL-9, (H) IL-10, (I) IL-13, (J) TNF-α, and (K) VEGF (n = 18 for BK). All results are shown by reaction status. Simple t tests were used to compare 2-variable plots with normally-distributed data (tryptase, IL-1β, IL-5, IL-9), and Kruskal-Wallis tests were used to compare non-normally-distributed data (IL-3, IL-4, IL-6, IL-10, IL-13, TNF-α). Normality testing results are shown in Supplemental Table 1.
Figure 5
Figure 5. Change in systemic immune markers during OFC.
Difference between post-OFC value and pre-OFC baseline result for the following markers: (A) tryptase, (B) IL-1β, (C) IL-3, (D) IL-4, (E) IL-5, (F) IL-6, (G) IL-9, (H) IL-10, (I) IL-13, (J) TNF-α, and (K) VEGF (all n = 19). All results are shown by reaction status. Simple t tests were used to compare 2-variable plots. *P < 0.05 and ***P < 0.001.
Figure 6
Figure 6. Timing of TEWL changes in relation to clinical events.
(A) Representative time course of TEWL results for a reactive OFC (red) that led to anaphylaxis and a nonreactive challenge (blue). (B and C) Time to first symptom, to a 1 g/m2/h rise in TEWL, to the maximal TEWL rise, and to anaphylaxis (if it occurred) during OFCs resulting in (B) any reaction (n = 14) or (C) anaphylaxis that required epinephrine administration (n = 9). (D) Food dose of first symptom, of a 1 g/m2/h rise in TEWL, and of epinephrine administration during OFCs resulting in anaphylaxis and requiring epinephrine administration (n = 9). (E) Time to first symptom and to a 1-unit TEWL rise among reactors with cutaneous symptoms at any point (n = 5) or no cutaneous symptoms at any point (n = 9). Simple t tests were used to compare 2-variable plots, and ANOVA was used to compare means for plots showing 3 or more variables. *P < 0.05, **P < 0.01, and ***P < 0.001.
Figure 7
Figure 7. Results of cTEWL monitoring of the OFCs.
(A) Example time course of a reactive OFC resulting in anaphylaxis (red) and a nonreactive OFC (blue). (B) The maximal net change in the mean TEWL value from the 2 minutes after any food dose during the OFC versus the 2 minutes prior to the same food dose (n = 53). (C) cTEWL event timing for anaphylaxis events in which the individual had a 1-unit TEWL increase, as in B (n = 5). (D) Sensitivity and specificity graphed for potential OFC stopping rules including for any symptom, any objective sign/symptom, 1- or 2-unit TEWL increases within 2 minutes before/after any food dose, and the 1- or 2-unit TEWL increases in combination with any objective symptom. ANOVA was used to compare means for plots showing 3 or more variables. **P < 0.01.

References

    1. Gupta RS, et al. The Public Health Impact of Parent-Reported Childhood Food Allergies in the United States. Pediatrics. 2018;142(6):e20181235. doi: 10.1542/peds.2018-1235. - DOI - PMC - PubMed
    1. Gupta RS, et al. Prevalence and severity of food allergies among US adults. JAMA Netw Open. 2019;2(1):e185630. doi: 10.1001/jamanetworkopen.2018.5630. - DOI - PMC - PubMed
    1. Bilaver LA, et al. Economic burden of food allergy: a systematic review. Ann Allergy Asthma Immunol. 2019;122(4):373–380. doi: 10.1016/j.anai.2019.01.014. - DOI - PubMed
    1. Rudders SA, et al. Trends in pediatric emergency department visits for food-induced anaphylaxis. J Allergy Clin Immunol. 2010;126(2):385–388. doi: 10.1016/j.jaci.2010.05.018. - DOI - PubMed
    1. Robinson LB, et al. Trends in US Emergency Department visits for anaphylaxis among infants and toddlers: 2006-2015. J Allergy Clin Immunol Pract. 2021;9(5):1931–1938.e2. doi: 10.1016/j.jaip.2021.01.010. - DOI - PMC - PubMed

Publication types

Supplementary concepts