. 2023 Jul 4;16(792):eabn8668.
doi: 10.1126/scisignal.abn8668. Epub 2023 Jul 4.

Clustering of phosphatase RPTPα promotes Src signaling and the arthritogenic action of synovial fibroblasts

Affiliations

Clustering of phosphatase RPTPα promotes Src signaling and the arthritogenic action of synovial fibroblasts

Sho Sendo et al. Sci Signal. .

Abstract

Receptor-type protein phosphatase α (RPTPα) promotes fibroblast-dependent arthritis and fibrosis, in part, by enhancing the activation of the kinase SRC. Synovial fibroblasts lining joint tissue mediate inflammation and tissue damage, and their infiltration into adjacent tissues promotes disease progression. RPTPα includes an ectodomain and two intracellular catalytic domains (D1 and D2) and, in cancer cells, undergoes inhibitory homodimerization, which is dependent on a D1 wedge motif. Through single-molecule localization and labeled molecule interaction microscopy of migrating synovial fibroblasts, we investigated the role of RPTPα dimerization in the activation of SRC, the migration of synovial fibroblasts, and joint damage in a mouse model of arthritis. RPTPα clustered with other RPTPα and with SRC molecules in the context of actin-rich structures. A known dimerization-impairing mutation in the wedge motif (P210L/P211L) and the deletion of the D2 domain reduced RPTPα-RPTPα clustering; however, it also unexpectedly reduced RPTPα-SRC association. The same mutations also reduced recruitment of RPTPα to actin-rich structures and inhibited SRC activation and cellular migration. An antibody against the RPTPα ectodomain that prevented the clustering of RPTPα also inhibited RPTPα-SRC association and SRC activation and attenuated fibroblast migration and joint damage in arthritic mice. A catalytically inactivating RPTPα-C469S mutation protected mice from arthritis and reduced SRC activation in synovial fibroblasts. We conclude that RPTPα clustering retains it to actin-rich structures to promote SRC-mediated fibroblast migration and can be modulated through the extracellular domain.


Figures
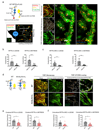
Figure 1.
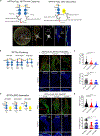
Figure 1.. Super-resolution microscopy of migrating SF suggests that RPTPα clusters interact with SRC along actin stress fibers
(a) Left side: drawn schematic of our experimental targets and reagents labelling strategy (upper left) and a diagram of cellular compartments for migrating cell with leading lamellipodium showing leading edge (LEDGE) and polarized basal stress fibers (BSTRESS, lower left). Right side: TIRF micrograph (I), STORM localization map (II), and low (III) vs high (IV, V) magnification of leading lamellipodial edge rendering of overlap TIRF-STORM images of WT RPTPα-expressing SF, with localization map of clustered (red spheres, distance <65 nm) vs non clustered (blue spheres, distance >65 nm) RPTPα, clustered (yellow spheres, distance <65 nm) SRC, and colocalized RPTPα-SRC (white spheres, distance <65 nm) overlaid on the F-actin TIRF image (green). Scale bar in I and IV is 5 μm and 500 nm, respectively. (b,c) Density of clustered vs non clustered RPTPα (b) or colocalized vs non colocalized RPTPα-SRC (c) in LEDGE (left) or BSTRESS (right) of WT RPTPα-expressing SF. (d) Left side: drawn schematic of our experimental targets, reagents and labelling strategy. Right side: representative TIRF (I, II) and low (III) vs high (IV) magnification overlap TIRF-STORM images of SF expressing WT RPTPα-FLAG (WT, upper panels) compared with SF expressing P210L/P211L RPTPα-FLAG (P210, lower panels) with localization map coded as in a-III,IV. Scale bar in I and IV is 3 μm and 1 μm, respectively. Relative density of clustered RPTPα (e) or colocalized RPTPα-SRC (f) in LEDGE and BSTRESS of WT and P210 cells. (b,c,e,f) Each point represents a transfected cell. N=10 cells per construct across 4 experiments using 4 αKO lines for WT, N=9 cells per construct across 3 experiments using 3 αKO lines for P210. Data are means±SEM. **** p ≤0.0001, *** p ≤0.001, ** p ≤0.01, * p ≤0.05 by Mann-Whitney.
Figure 2.
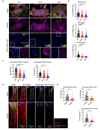
Figure 2.. SEcFRET-assessment of migrating SF suggests that clustering of RPTPα correlates with association with SRC
(a) Upper part: drawn schematic of our experimental targets and reagents labelling strategy. Lower part: (I) low resolution 10x multi-tiled stitched representative scratch wound in a monolayer of SF labeled with anti-FLAG-AF568 (red), anti-HA-AF488 (green), and Hoechst (blue) for SEcFRET analysis of migrating SF LEDGEs (scale bar is 1 mm); (II-V), method for analyzing FRET-positive regions: each cell is quadri-sected (II, color code is as in I, scale bar is 5 μm), FRET zones auto-outlined (III); (IV) SEcFRET density map image, magnified in V (scale bar is 500 nm). (b) Left side: drawn schematic of our experimental targets and reagents labelling strategy. Right side: representative FLAG- and HA-RPTPα staining (upper panels, scale bar is 10 μm) and LEDGE SEcFRET localization in WT-WT, P210-P210 and dD2-dD2 SF (middle panels) and highlighted in magnified box insets (lower panels, scale bar is 2 μm). (c) SEcFRET signal (upper graph) and calculated % FRET efficiency (lower graph) of RPTPα homodimer in the 90-degree quadrant corresponding to the LEDGE. (d) Left side: schematic of our experimental targets, reagents labelling strategy. Right side: representative RPTPα-FLAG and SRC staining (upper panels, scale bar is 10 μm) and LEDGE SEcFRET localization in WT-SRC, P210-SRC and dD2-SRC SF (middle panels) and highlighted in magnified box insets (lower panels, scale bar is 2 μm). (e) SEcFRET signal (upper graph) and calculated % FRET efficiency (lower graph) of RPTPα-SRC association in the 90-degree quadrant corresponding to the LEDGE. Each point in (c,e) represents a transfected cell. N= 40–60 cells per construct across 2 experiments using 2 αKO lines for RPTPα homodimer, N= 65–130 cells per construct across 3 experiments using 3 αKO lines for RPTPα-SRC association. Data are means±SEM. **** p ≤0.0001, * p ≤0.05 by Kluskal-Wallis with corrected Dunn’s test.
Figure 3.
Figure 3.. ApFRET and FLIM assessment of migrating SF suggests that clustering of RPTPα correlates with association with SRC
(a) Typical apFRET images. The whole cell (box in I) was imaged at t=0 with donor and acceptor merged (I, scale bar is 5 μm), then magnified in II (scale bar is 5 μm) to highlight bleached ROI (box in II) and then post bleached at t=182 sec - showing bleached (III) and unbleached (IV) portions of the lamellipodium. V shows representative post-photo-bleaching apFRET analysis: the relative fluorescence vs time graphs of photo-bleached anti-FLAG-AF568 acceptor (red) and unquenched anti-HA-AF488 donor (green) are shown for photo-bleached ROIs from III, together with graphs for donor (black) and acceptor (yellow) for control non bleached ROI from IV. (b, d) Summary of experimental setting for panel c and e. (c, e) Post-bleaching fluorescence intensity (left graph) and % FRET efficiency (right graph) of donor in apFRET of RPTPα clustering in WT-WT, P210-P210 and dD2-dD2 SF (c) and of RPTPα-SRC association in WT-SRC, P210-SRC and dD2-SRC SF (e). Each point in (c,e) represents a ROI which stringently outlines the cell lamellipodium. N= 7–11 cells for (c) and N=9–14 cells for (e) per construct across 2 experiments using 2 αKO lines. (f) Representative Fast Lifetime Contrast (FALCON) FLIM acquisition and phasor plot analysis of RPTPα clustering. (I) Post-bleached acceptor signal (bleached area in yellow box ROI); (II) FLIM acquired image highlighting the donor unquenching in bleached area (N-FRET, red pseudocolor in yellow box ROI) contrasting with the highly quenched (>50% efficiency) FRET (H-FRET) positive regions in white; (III) location of N-FRET (red circle) vs H-FRET (white circle) vs <35% FRET efficiency (L-FRET) pixels in the phasor loop. Scale bar is 10 μm. (g) Representative FLIM images of RPTPα clustering in WT-WT, P210-P210 and dD2-dD2 SF (left panel, scale bar is 10 μm) and quantification of % FLIM-FRET efficiency (right panel). Fluorescent Images in upper panels are RPTPα donor fluorescent signal. Middle panels are FLIM images displaying H-FRET vs L-FRET pseudocolored in white and yellow respectively. Lifetimes are shown in lower panels. Donor only control lifetimes cluster in red circles in Phasor loops. Each point represents a transfected cell. N= 10–33 cells per construct across 2 experiments using 2 αKO lines. Data are means±SEM. **** p ≤0.0001, *** p ≤0.001, ** p ≤0.01, by Kluskal-Wallis with corrected Dunn’s test for (c) and (e) right panels, or ordinary one-way ANOVA calculated on AUC (Dunnett’s multiple comparison test) for (c) and (e), left panels.
Figure 4.
Figure 4.. RPTPα clustering correlates with cortactin recruitment to the LEDGE of migrating SF and its co-localization with RPTPα and SRC
(a) Representative images of wound edge migrating SF transfected with WT PTPRA-FLAG (WT), P210L/P211L PTPRA-FLAG (P210) or dD2 PTPRA-FLAG (dD2) expression constructs. Upper panel: staining with anti-FLAG-AF568 (red), anti-SRC-AF488 (green), anti-cortactin-AF647 (magenta) and Hoechst (blue) (scale bar is 10 μm). The second from top panels display cortactin only (magenta). The third from top and the bottom panels show the SEcFRET images of these representative cells, and a zoomed-in panel series (scale bar is 10 μm). (b) Quantification of RPTPα, SRC and cortactin positive area in the LEDGE of transfected migrating SF. (c) Quantification of colocalized RPTPα-cortactin and SRC-cortactin in the LEDGE of transfected migrating SF. Each point in (b,c) represents a transfected cell. N= 5 αKO lines across 5 experiments. (d) Representative images of migrating αKO SF transfected with WT PTPRA-HA (WT) expression constructs treated with DMSO (control, upper panel) or SU6656 (SRC inhibitor, bottom panel) (scale bar is 10 μm). (I): staining with anti-HA-AF488 (green), anti-SRC-AF568 (magenta), Phalloidin-AF647 (red) and hoechst (blue). (II,III): SRC-F-ACTIN colocalization signal (gray) on cell outline with (II) or without (III) phalloidin (red). (IV): RPTPα-SRC and (V): SRC-F-ACTIN colocalization signal (gray) on cell outline. (e) Quantification of colocalized SRC-F-ACTIN (left), RPTPα-SRC (upper right) and RPTPα -F-ACTIN (lower right) in transfected migrating SF. Each point represents a transfected cell. N=43–54 cells per group across 2 experiments using 2 αKO lines. Data are means±SEM. **** p ≤0.0001, *** p ≤0.001, by Kluskal-Wallis with corrected Dunn’s test (panels b, c) or Mann-Whitney (panel e)).
Figure 5.
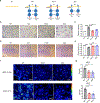
Figure 5.. Clustering-impaired RPTPα mutations impair SF migration and phosphorylation of SRC and RAC
(a) Summary of experimental setting for the experiment outlined in b-g. Representative images (b) and migration rate (c) of EV, WT, P210 or dD2 SF, normalized by EV. Representative images of scratched wound (d) and wound area reduction (e) in monolayers of EV, WT, P210 or dD2 SF. Graph shows ratio between the area at 24h vs time 0 normalized by the area change of EV. Scale bar in (b,d) is 200 μm. Each point (c,e) represents a different transfected cell line (N=4) across 4 experiments. Representative heat maps (f), with scale bar (100μm) and mean fluorescence intensity (g) of images of pSRC (Tyr419), pRAC (Ser71) in monolayers of migrating WT, P210 or dD2 SF. Each point represents the intensity level in a selected microscopy field. N=4 fields per construct across 2 experiments using 2 αKO lines. Data are means±SEM. **** p ≤0.0001, *** p ≤0.001, ** p ≤0.01, * p ≤0.05 by ordinary one-way ANOVA (Dunnett’s multiple comparison test).
Figure 6.
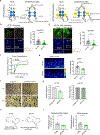
Figure 6.. RPTPα-blocking Ab reduces RPTPα clustering and association with SRC at the LEDGE of migrating SF
(a) Drawn schematic of our experimental targets and reagents labelling strategy for the experiment outlined in b-d. SF were transfected with WT PTPRA-FLAG with (panels b,c, WT-WT) or without (panel d, WT-SRC) WT PTPRA-HA and incubated with isotype Ab or anti-RPTPα blocking Ab (2F8). (b,d) Left: representative SEcFRET image (scale bar is 20 μm). Right: quantified total SEcFRET signal areas at the LEDGE. Each point represents a transfected cell. N=65–76 cells for b, N=37–75 cells for d across 3 experiments using 3 αKO lines. (c) Post-bleaching time resolved average fluorescence intensity profile of dequenched donor signal of RPTPα clustering using the apFRET method. N=12–13 cells per group across 2 experiments using 2 αKO lines. (e) Representative heat maps (left) and mean fluorescence intensity (right) of images of pSRC (Tyr419) in monolayers of WT SF incubated with or without anti-RPTPα blocking Ab (2F8). Scale bar is 100 μm. Each point represents the intensity level in a microscopy field. N=9–12 fields and 2 cell lines across 2 experiments. (f,g) Representative images (f) and migration rate (g) of WT (N=4 lines) or αKO (N=4 lines) SF, normalized by migration of SF incubated with isotype control Ab. Scale bar in (f) is 200 μm. Each point represents a different cell line across 4 experiments. (h,i) Schematic of experiment (h) and histological scores (i, Left: synovial inflammation, Right: bone erosion) for STIA in female BALB/c mice subjected to injection with anti-RPTPα blocking Ab (2F8) or PBS (2F8 Ab: N= 9, PBS: N= 10). Each point represents the score ratio of 2F8Ab or saline injected joint vs contralateral non-injected joint of a mouse. Graphs in e, g and i show means and SEM. **** p ≤0.0001, ** p ≤0.01, * p ≤0.05 by Mann-Whitney (panel b,d,e,i), unpaired t-test calculated on AUC (panel c) or paired t test (panel g).
Figure 7.
Figure 7.. RPTPα inactivation reduced arthritis severity in mice and removes the inhibitory effect of 2F8 on ex vivo SF migration
(a) Drawn schematic for the experiments in b-e. (b) Clinical score (left) and ankle thickness (right) for STIA in female WT (N=11) and homozygous RPTPα C469S (CS/CS, N=12) littermate mice. (c) RPTPα vs GAPDH expression in lysates of SF derived from WT or CS/CS mice. Data is representative n=2 independent experiments. (d) Representative heat maps (left) and mean fluorescence intensity (right) of images of pSRC (Tyr419) and pRAC (Ser71) in monolayers of WT, CS/CS SF. Each point represents intensity level in a selected field. N=3 WT and 3 CS lines across 3 experiments (e) Representative images (left) and migration rate of CS/CS SF (N=4 lines) (right), incubated with 2F8 Ab or isotype control Ab, normalized by isotype control Ab. Scale bar is 200 μm. Each point represents a different SF line across 4 experiments. Data are means±SEM. ** p ≤0.01, * p ≤0.05 by unpaired t-test calculated on AUC (panel b), Mann-Whitney (panel d) or paired t test (panel e).
Figure 8.
Figure 8.. Working model for relationship between clustering of RPTPα and SRC activation at the LEDGE of migrating SF
Drawn schematic of our proposal working model. Activation of SRC induces LEDGE formation also through downstream Rac activation and promotes recruitment and clustering of RPTPα at the LEDGE which in turn amplifies SRC activation and LEDGE assembly. De-clustering RPTPα mutations (P210, dD2) or Ab (2F8) impair RPTPα recruitment and clustering at the LEDGE and impair this amplification mechanism.

References

    1. Alonso A et al., Protein tyrosine phosphatases in the human genome. Cell 117, 699–711 (2004). - PubMed
    1. Wang Y, Pallen CJ, The receptor-like protein tyrosine phosphatase HPTP alpha has two active catalytic domains with distinct substrate specificities. EMBO J 10, 3231–3237 (1991). - PMC - PubMed
    1. Lim KL, Lai DS, Kalousek MB, Wang Y, Pallen CJ, Kinetic analysis of two closely related receptor-like protein-tyrosine-phosphatases, PTP alpha and PTP epsilon. Eur J Biochem 245, 693–700 (1997). - PubMed
    1. Blanchetot C, den Hertog J, Multiple interactions between receptor protein-tyrosine phosphatase (RPTP) alpha and membrane-distal protein-tyrosine phosphatase domains of various RPTPs. J Biol Chem 275, 12446–12452 (2000). - PubMed
    1. Blanchetot C, Tertoolen LG, den Hertog J, Regulation of receptor protein-tyrosine phosphatase alpha by oxidative stress. EMBO J 21, 493–503 (2002). - PMC - PubMed

Publication types

MeSH terms

Substances

LinkOut - more resources