. 2023 Jul 11;56(7):1561-1577.e9.
doi: 10.1016/j.immuni.2023.06.006. Epub 2023 Jul 3.

Macrophage-mediated extracellular matrix remodeling controls host Staphylococcus aureus susceptibility in the skin

Affiliations

Macrophage-mediated extracellular matrix remodeling controls host Staphylococcus aureus susceptibility in the skin

Benjamin Voisin et al. Immunity. .

Abstract

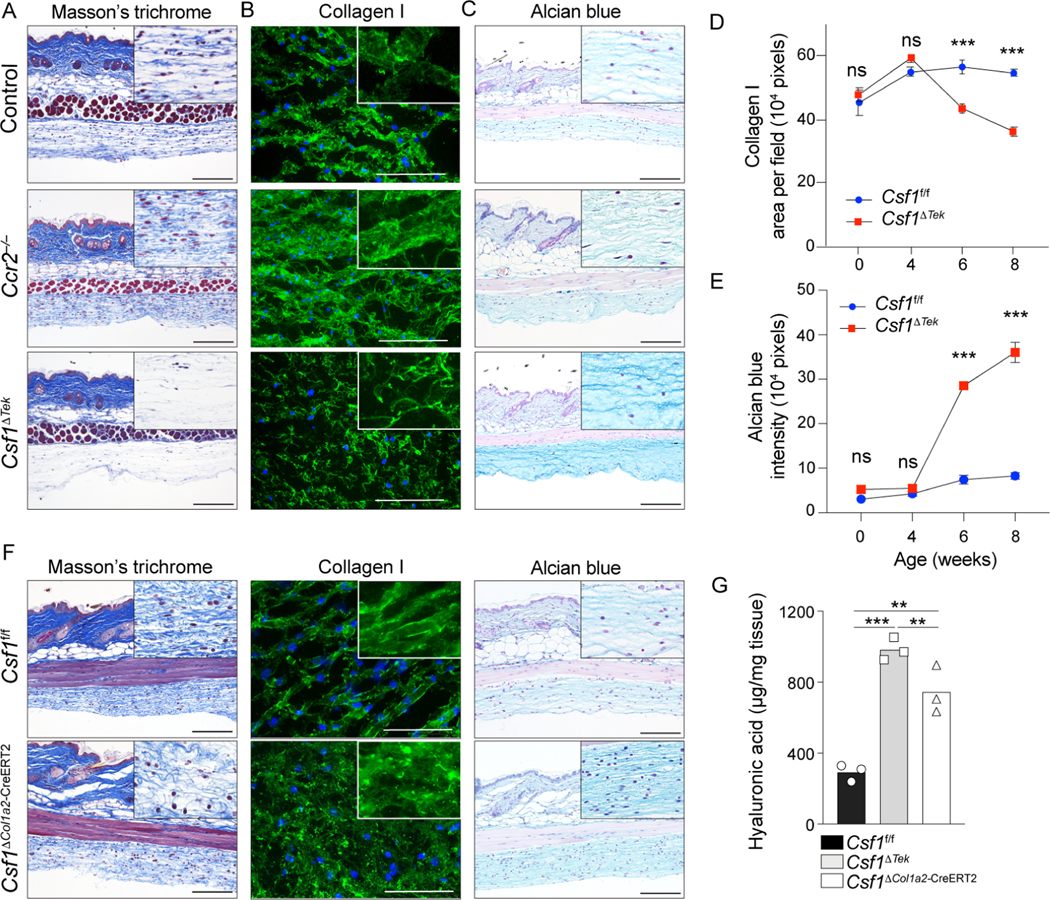
Hypodermis is the predominant site of Staphylococcus aureus infections that cause cellulitis. Given the importance of macrophages in tissue remodeling, we examined the hypodermal macrophages (HDMs) and their impact on host susceptibility to infection. Bulk and single-cell transcriptomics uncovered HDM subsets with CCR2-dichotomy. HDM homeostasis required the fibroblast-derived growth factor CSF1, ablation of which abrogated HDMs from the hypodermal adventitia. Loss of CCR2- HDMs resulted in accumulation of the extracellular matrix component, hyaluronic acid (HA). HDM-mediated HA clearance required sensing by the HA receptor, LYVE-1. Cell-autonomous IGF1 was required for accessibility of AP-1 transcription factor motifs that controlled LYVE-1 expression. Remarkably, loss of HDMs or IGF1 limited Staphylococcus aureus expansion via HA and conferred protection against cellulitis. Our findings reveal a function for macrophages in the regulation of HA with an impact on infection outcomes, which may be harnessed to limit the establishment of infection in the hypodermal niche.

Keywords: Staphylococcus aureus; extracellular matrix; hyaluronic acid; hypodermis; insulin-like growth factor 1; macrophages; skin.


Conflict of interest statement

Declaration of interests The authors declare no competing interests.

Figures

Figure 1.
Figure 1.. CCR2+ and CCR2 macrophage subsets with distinct transcriptomic profiles in the dermis and hypodermis.
(A) Flow cytometry analysis of live CD45+ cells isolated from indicated skin layers of C57BL/6 mice. Graph indicates the percentage of CD45+ CD11b+ in both skin layers. Each dot represents an individual mouse. Data representative of two independent experiments (n=5–6 per group). (B) Flow cytometry analysis of live CD45+CD11b+EpCAMLy6Clo cells from indicated skin layers. Data representative of more than 2 independent experiments (n=2–3 per experiment). (C) Giemsa stain on sorted dermal and hypodermal CCR2+ and CCR2 macrophages from C57BL/6 mice. Scale=10μm (D) Principal component analysis of RNA-seq transcriptome analysis of indicated sorted cells from C57BL/6 mouse skin. (E and F) Volcano plots presenting the differentially expressed genes (p-value <0.05) between dermal (n=4467) and hypodermal (n=2493) CCR2+ and CCR2 macrophages (blue). Genes with p-value <0.05 and an absolute value of Log2 fold change >2 are presented in red, with genes of interest showed in yellow. (G-H) UMAP of unsupervised clustering analysis from scRNA-seq performed on dermal and hypodermal immune cells. Feature plots show the expression of characteristic genes for indicated cell lineage. (I) Schematic representation of the strategy used to obtain gene sets specific for macrophages in both dermis and hypodermis (top). Enrichment score for bulk RNA-seq macrophage gene set projected onto UMAP plots of dermal and hypodermal myeloid cells (bottom left). Cell identity annotation based on enrichment scores (bottom right). (J and L) Unsupervised heatmap of top 20 DEG between macrophage clusters of dermis and hypodermis. Selected genes are depicted. (K and M) Violin plot depicting enrichment score in scRNA-seq macrophages clusters of gene sets for CCR2+ and CCR2 macrophages that were generated from macrophage bulk RNA-seq. (B-M) Macs: macrophages, DCs: dendritic cells.
Figure 2.
Figure 2.. CCR2+ and CCR2 macrophages have distinct tissue longevity and cytokine dependency.
(A) Percentage of donor derived (CD45.1+) or host derived (CD45.2+) cells within each skin layer of bone marrow chimeric mice 8 weeks after bone marrow transplantation. (B) Percentage of partner-derived cells in indicated cell populations of parabiotic mice analyzed by flow cytometry 8–10 weeks post-surgery. (C) GFP expression was triggered in somatic cells of R26-M2rtTAxCol1a1-tetO-H2B-GFP and its retention in indicated dermal and hypodermal cells was assessed by flow cytometry analysis at indicated times (top). Graphs represent GFP expression normalized to day 0, mean ± SD (bottom). (D to F) Numbers of CCR2+ and CCR2 DMs and HDMs assessed by flow cytometry analysis in indicated mouse genotype and from C57BL/6 mice injected or not with CSF1R blocking antibody (AFS98). (A to F) Data representative of 2 independent experiments (n=5–10 per group). (B, D-F) Each dot represents one mouse.
Figure 3.
Figure 3.. Hypodermis-specific depletion of Csf1 abrogates hypodermal macrophages.
(A and B) UMAP plot of CD45 cells sorted from C57BL/6 mouse dermis and hypodermis. (C and D) Feature plots showing the expression of indicated genes in dermal and hypodermal non-immune cells. Endo: endothelial cells. (E) Flow cytometry analysis of YFP expression by endothelial and fibroblasts cells in indicated layers of Tek-Cre×ROSA-YFP (Cre+) or control (Cre) mice. 2 independent experiments (n=4–6 per group). (F) Representative immunofluorescence staining for FOLR2 (red) and DAPI (white) in 8-week-old Csf1f/f and Csf1ΔTek mouse skins. Dashed lines delineate borders between panniculus carnosus and adventitia. Scale bar=50μm. (G) Quantification of macrophages per field of view in the adventitia of indicated mice. (H) CCR2+ and CCR2 macrophage numbers in hypodermis of indicated 8-week-old mice assessed by flow cytometry. (I) Flow cytometry analysis of macrophages in the hypodermis of indicated aged mice (left). Quantification of CD64+ macrophages (right). 2 independent experiments (n=7–14 per group). (J and K) Flow cytometry analysis of macrophages in the hypodermis of indicated mice at 8–10 weeks of age. Graphs depict hypodermal macrophage quantification. (L) Representative immunofluorescence microscopy as in (F) in indicated mice and adventitia macrophage quantification. (I, J, K) Gating strategy: CD45+CD11b+Ly-6C CD11clow-hi. (G, H, J, K, L) Each dot represents one mouse. Data representative of 2 independent experiments (n=4–10 per group).
Figure 4.
Figure 4.. Loss of macrophages in hypodermal adventitia confers resistance against S. aureus infection.
(A) Representative image of skin phenotype observed in Csf1f/f and Csf1ΔTek at indicated times post inoculation. Asterisks indicate the injection sites. Scale bar=0.5cm. (B-C) Disease parameters assessed in skin or spleen of indicated mice. (D) Disease score measured from Csf1f/f and Csf1ΔTek mice injected with S. aureus (E) Representative immunofluorescence staining for S. aureus (cyan) and collagen I (red) in adventitial sections from Csf1f/f and Csf1ΔTek mice at indicated time points after S. aureus injection. Scale bar=50μm. (F) Representative image of cutaneous phenotype in indicated mice injected with S. aureus and associated disease score. (G) Quantification of immune cell subsets as assessed by flow cytometry at indicated time points post S. aureus injection. ILCs: innate lymphoid cells. (H-I) Representative image of skin phenotype 24H post-S. aureus injection in indicated mice (top). Disease parameters assessed in skin (bottom). (B, D, F, H, I) Each dot represents one mouse. Data representative of 2 independent experiments (n=5–20 per group).
Figure 5.
Figure 5.. Loss of hypodermal macrophages leads to altered formation of the extracellular matrix.
(A-C, F) Representative Masson’s Trichrome stain, alcian blue stain and immunofluorescence staining of collagen I on skin sections from indicated mice at 8-weeks of age. High magnifications of hypodermal adventitia are presented in upper corner. Scale bar=50μm. (D, E) Quantification of collagen I and alcian blue in the adventitia of indicated mice and time points. 2 independent experiments (n=5–6 per group). (G) Quantification of hyaluronic acid in the hypodermis of 8-week-old indicated mice assessed by ELISA on tissue lysates. Data representative of 2 independent experiment (n=3 per group).
Figure 6.
Figure 6.. Hyaluronic acid deposition renders mice resistant to S. aureus skin infection.
(A) Ligand-receptor interaction map generated from single-cell analysis of hypodermal immune and stromal cells. The thickness of the lines is proportional to the number of ligand-receptor couple detected between two cell-types. Ligands expressed by macrophages interacting with fibroblast or macrophage receptors are represented by the red arrows. (B) Database for Annotation, Visualization and integrated Discovery pathway analysis performed on ligand genes expressed by hypodermal macrophages that have receptors expressed by hypodermal macrophages and fibroblasts. (C) Quantification of collagen I immunofluorescence staining in hypodermal adventitia of 8-week-old mice. Each dot represents one mouse. n=12 for control WT mice and n=2–4 for other indicated mice. (D) Quantification of alcian blue staining as in (C). n=3–5. (E) Quantification of hyaluronic acid in the hypodermis of 8-week-old indicated mice assessed by ELISA on tissue lysates. Data representative of 2 independent experiments (n=3 per group). (F) pathway analysis performed on ligand genes expressed by hypodermal macrophages that have receptors expressed by hypodermal macrophages and fibroblasts. (G) Disease score measured from indicated mice injected with S. aureus. (H) Optical density measurement of S. aureus growth in vitro in the absence (control) or presence of vancomycin or indicated concentrations of hyaluronic acid (HA, 500–750kDa). Each dot represents an independent S. aureus culture. Data representative of 2 independent experiments. (I) Representative images of cellulitis phenotype observed at 24H post-injection of S. aureus in C57BL/6 mice pre-treated with indicated agents. (G, I) Each dot represents one mouse. Data representative of 2 independent experiments (n=5 per group). (F, I) Scale bar=0.5cm.
Figure 7.
Figure 7.. Cell-autonomous production of IGF1 by hypodermal macrophage regulates hyaluronic acid deposition.
(A) Representative flow cytometry analysis of LYVE-1 expression on hypodermal macrophages in indicated mouse genotype (top). Graph shows quantification of LYVE-1 expression (bottom). n=3 per group. (B) Representative immunofluorescence staining for LYVE-1 (green), FOLR2 (red) and DAPI (blue) in adventitia of indicated mice. Graph shows quantification of LYVE-1 fluorescence in macrophages. n=12 per group. Scale bar=150μm. (C) Quantification of LYVE-1 immunofluorescence staining on macrophages isolated from hypodermis of indicated mice after 24 hours of culture with indicated concentrations of recombinant IGF1. (D, E) Quantification of FITC-coupled hyaluronic acid uptake by macrophages isolated from hypodermis of indicated mice after 24 hours of culture with indicated concentrations of recombinant IGF1 or anti-LYVE-1 blocking antibody. (F) Representative western-blot images of indicated proteins in isolated hypodermal macrophages from indicated mice upon stimulation with recombinant IGF1. (G) HDMs isolated from the adventitia of indicated mice and their expression of LYVE-1 as assessed by immunofluorescence staining after treating with indicated inhibitors. (H) UMAP of unsupervised clustering analysis from scATAC-seq performed on adventitia macrophages from Igf1ΔCsf1r or control mice. (I) Coverage plot depicting Lyve1 chromatin accessibility in macrophage cluster 1 of indicated mouse genotypes. Peak with differential expression is highlighted by dashed lines. (J) Heatmap displaying relative enrichment of transcription factor motifs in Igf1f/f and Igf1ΔCsf1r HDMs with selected transcription factors depicted on the right. Transcription factor motifs were classified into 3 groups (I-III) based on the enrichment pattern between Igf1f/f and Igf1ΔCsf1r HDMs. (K) Metascape pathway analysis on Group I to III transcription factors from (J). (L) LYVE-1 expression in C57BL/6 HDMs as measured by immunofluorescence staining after incubation with indicated AP-1 inhibitors. (A, B) Each dot represents one mouse. (C, D, E, L) Each dot represents one well. HA: hyaluronic acid, rIGF1: recombinant IGF1. Scale bar=50μm. (C, D, E, G, L) Data representative of 2 independent experiments (n=3–5 per group).

References

    1. Sundberg JP, Booth CJ, Nanney LB, Fleckman P, and King LE (2017). Comparative Anatomy and Histology (Second Edition) A Mouse, Rat, and Human Atlas (Academic Press; ). 10.1016/C2014-0-03145-0. - DOI
    1. Amit I, Winter DR, and Jung S. (2016). The role of the local environment and epigenetics in shaping macrophage identity and their effect on tissue homeostasis. Nat Immunol 17, 18–25. 10.1038/ni.3325. - DOI - PubMed
    1. Ginhoux F, and Guilliams M. (2016). Tissue-Resident Macrophage Ontogeny and Homeostasis. Immunity 44, 439–449. 10.1016/j.immuni.2016.02.024. - DOI - PubMed
    1. Perdiguero EG, and Geissmann F. (2016). The development and maintenance of resident macrophages. Nat Immunol 17, 2–8. 10.1038/ni.3341. - DOI - PMC - PubMed
    1. Guilliams M, and Scott CL (2017). Does niche competition determine the origin of tissue-resident macrophages? Nat Rev Immunol 17, 451–460. 10.1038/nri.2017.42. - DOI - PubMed

Publication types