. 2023 Jul 20;83(14):2449-2463.e13.
doi: 10.1016/j.molcel.2023.06.012. Epub 2023 Jul 3.

Transcription factors interact with RNA to regulate genes

Affiliations

Transcription factors interact with RNA to regulate genes

Ozgur Oksuz et al. Mol Cell. .

Abstract

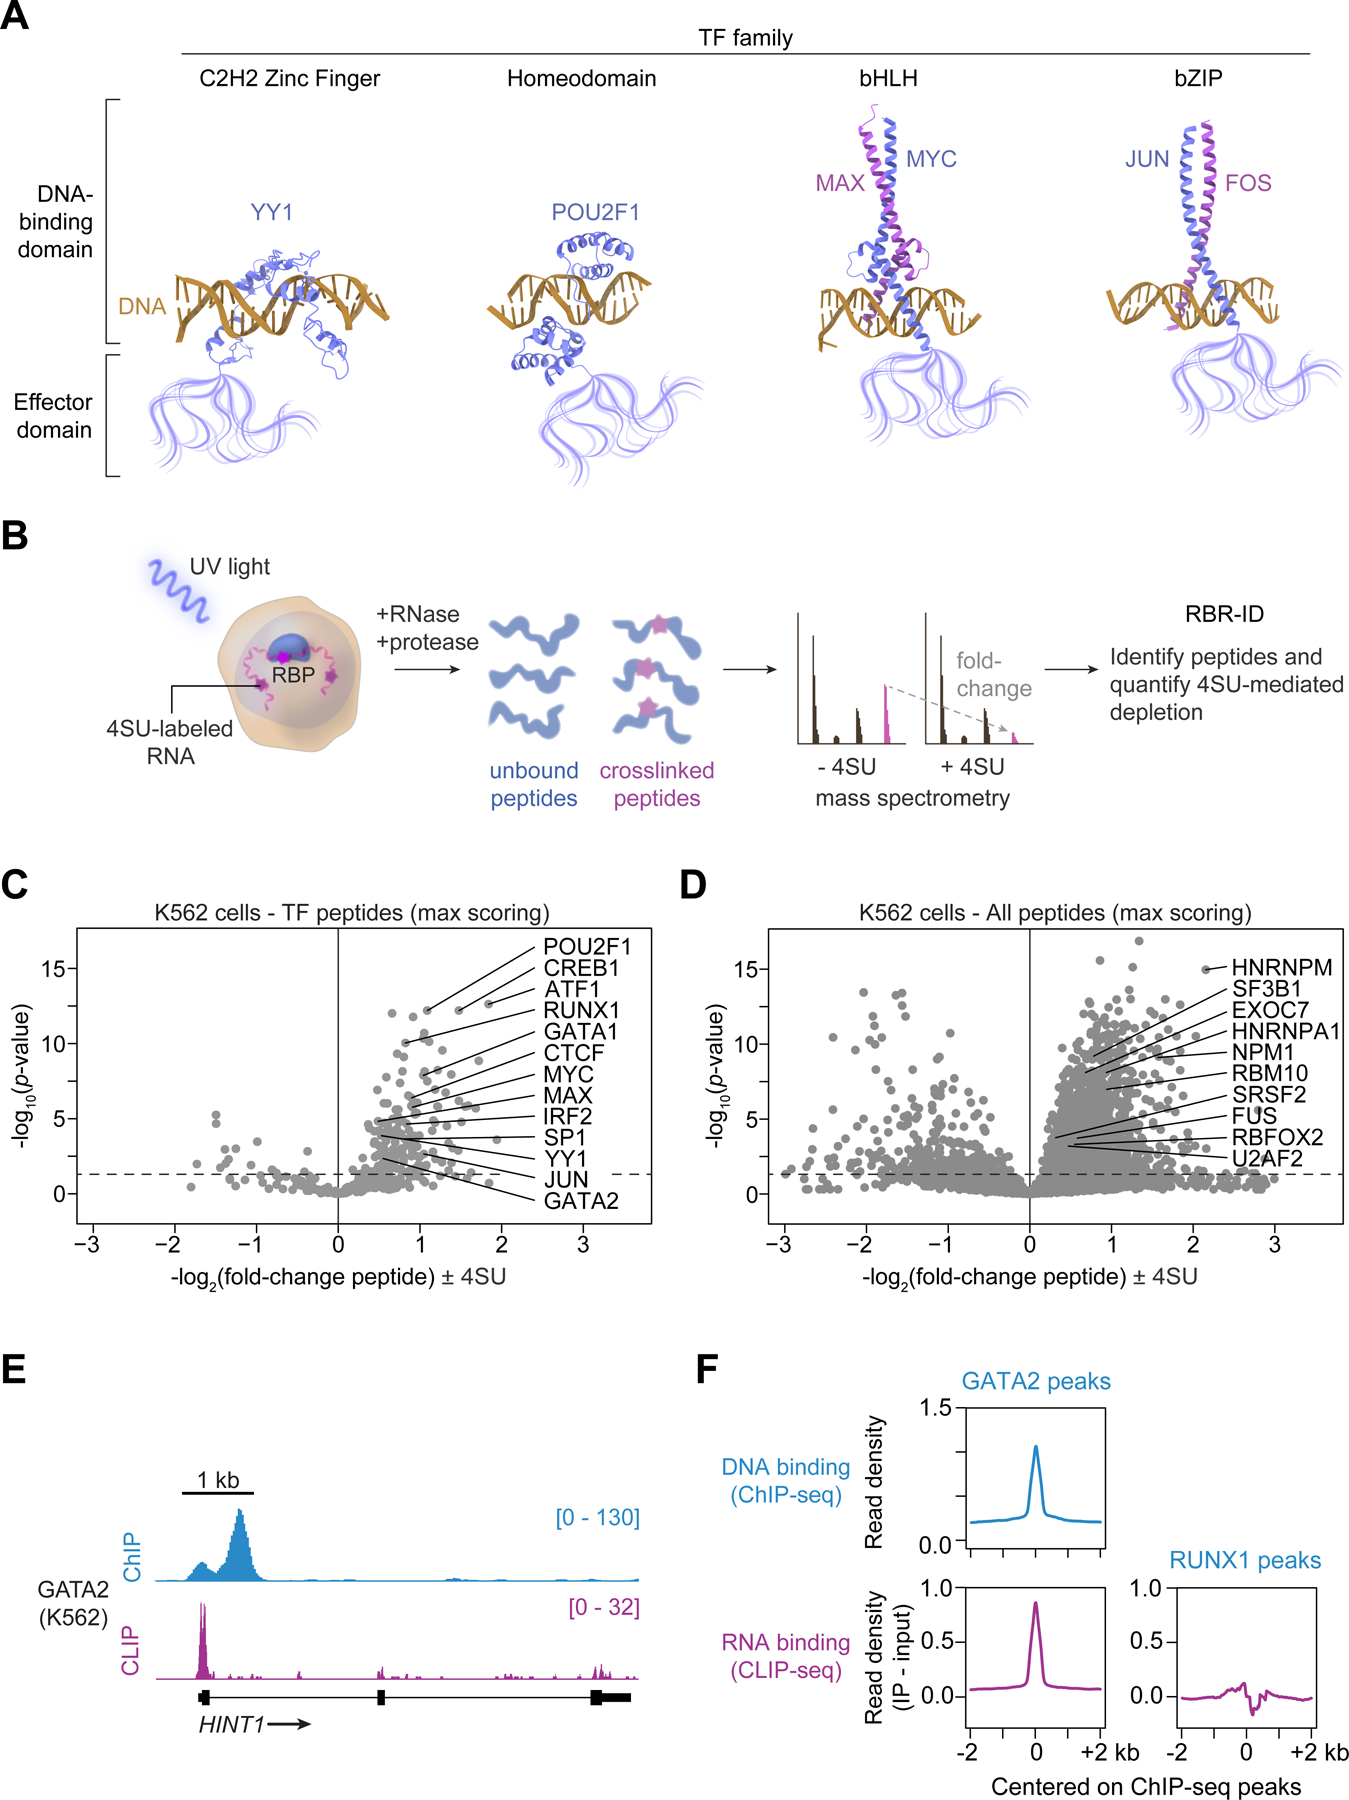
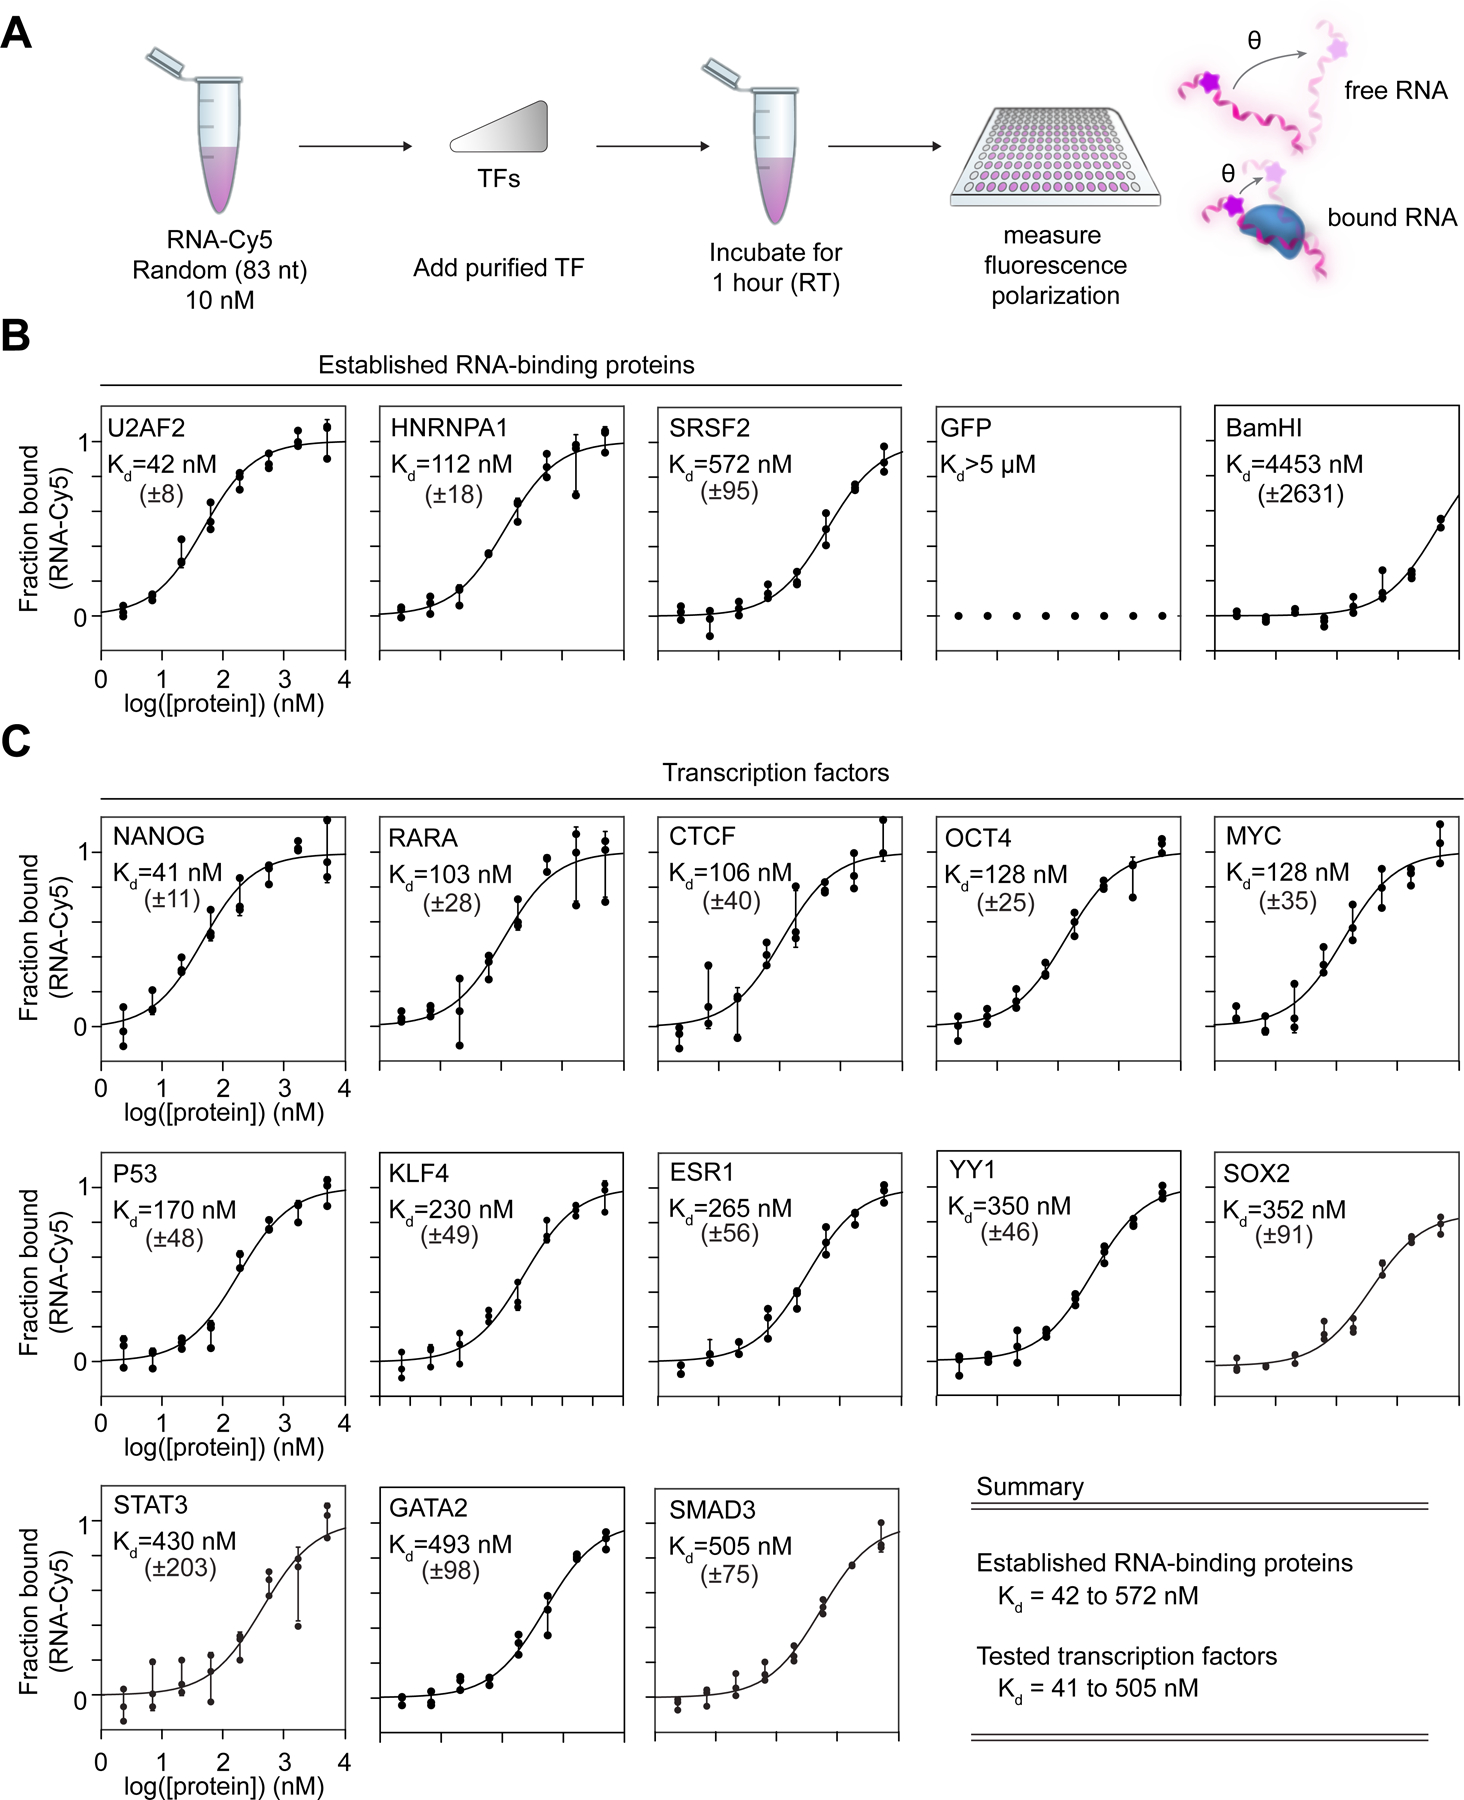
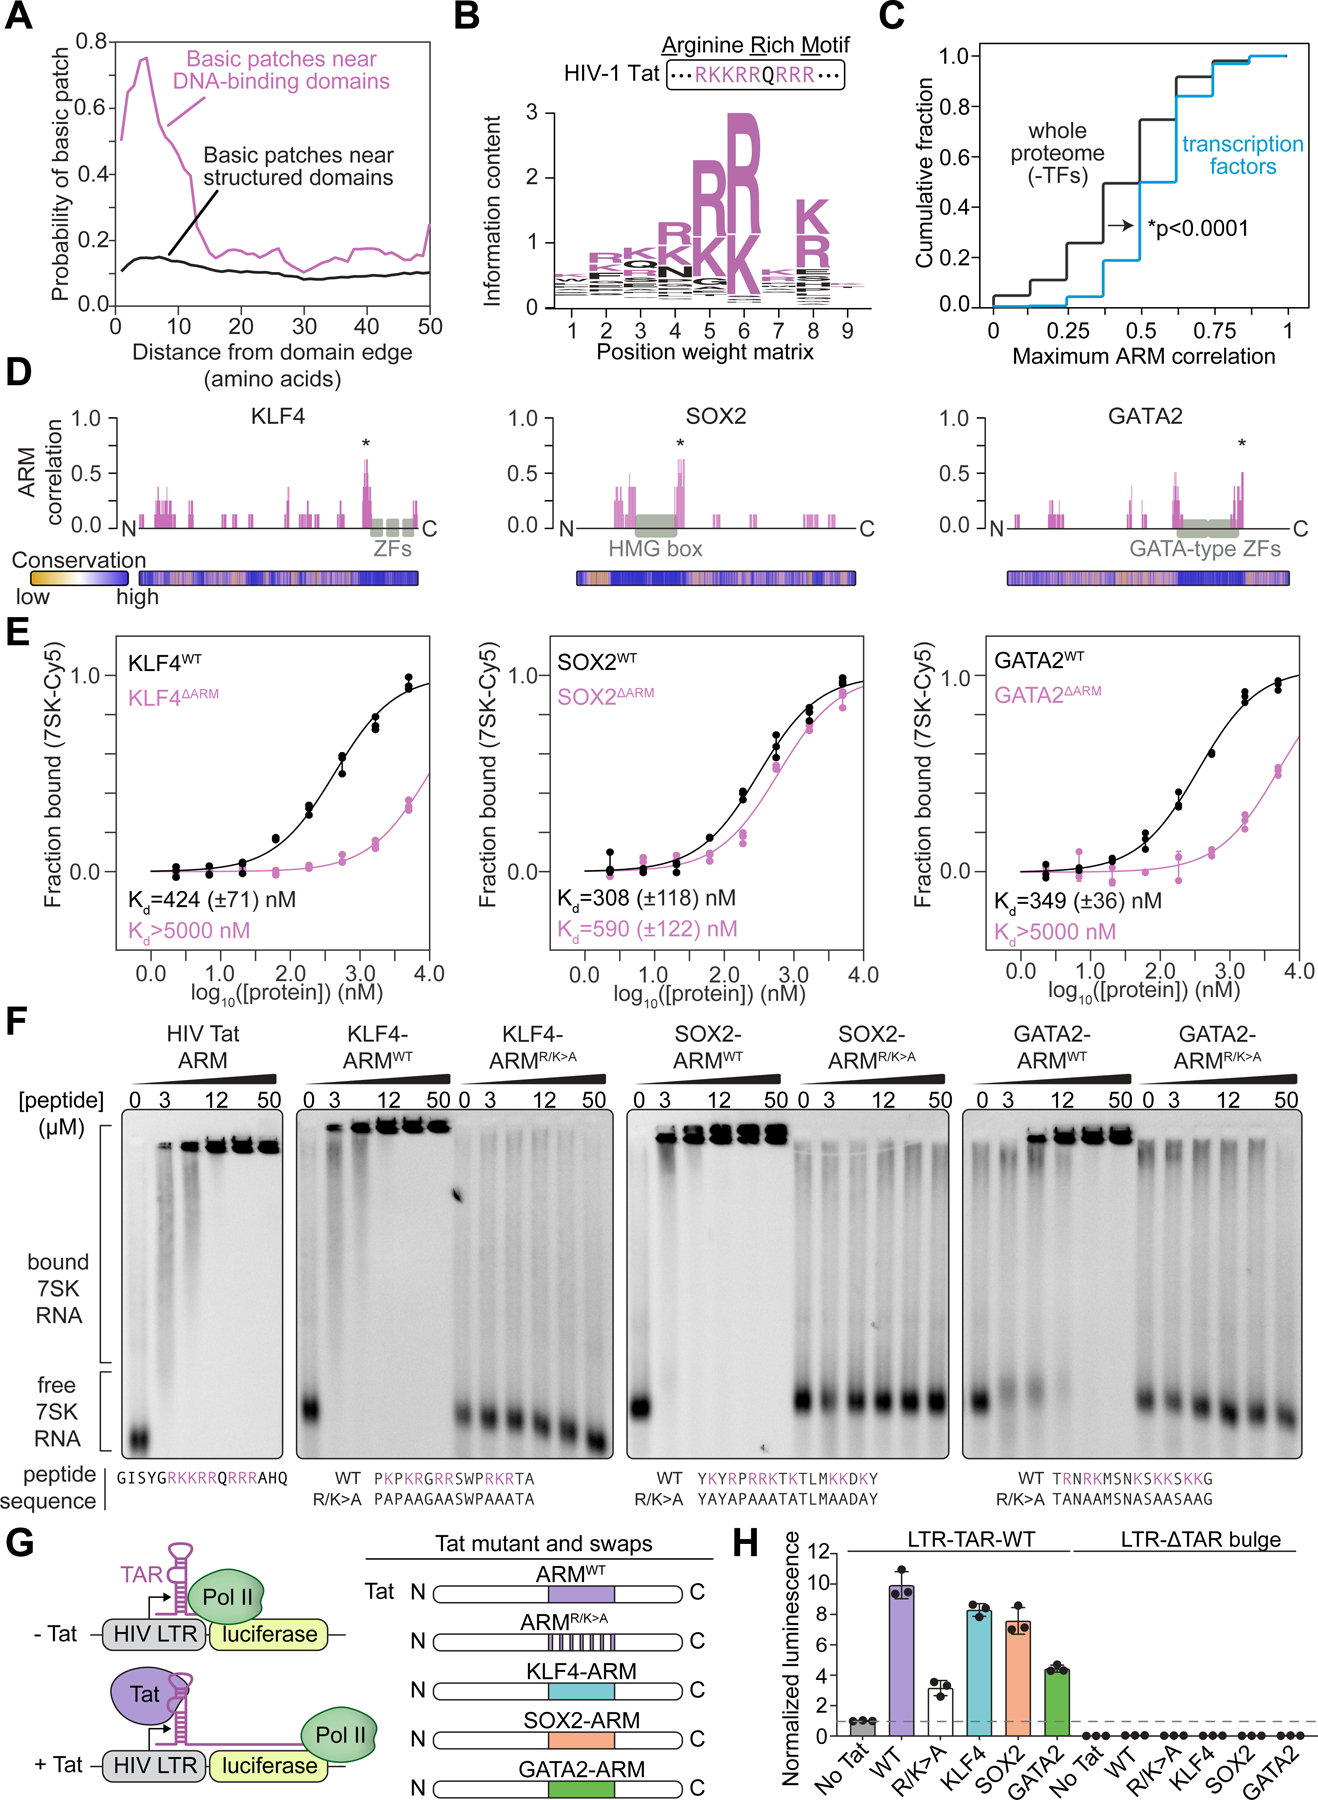
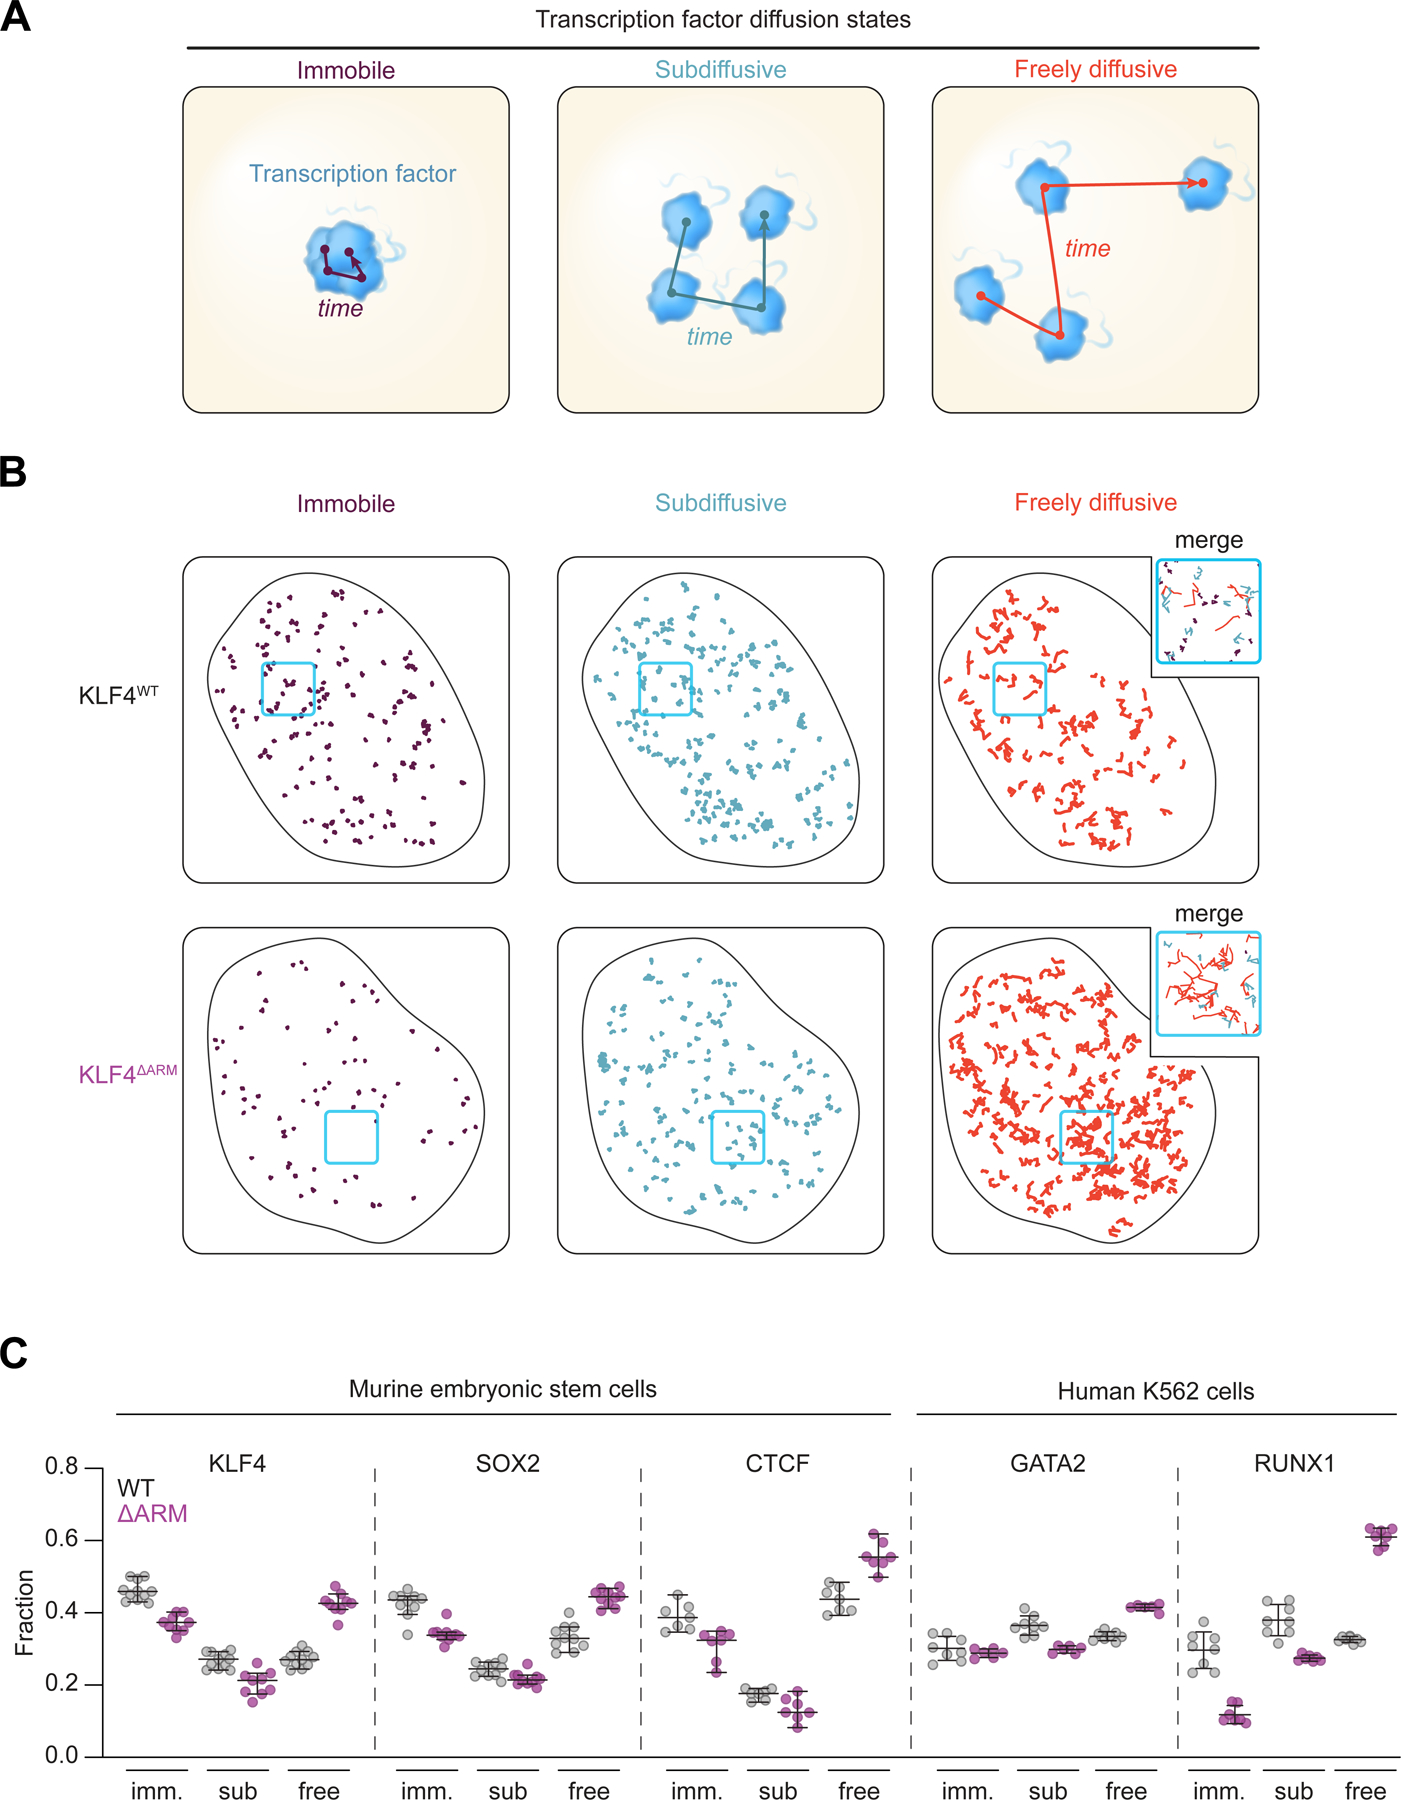
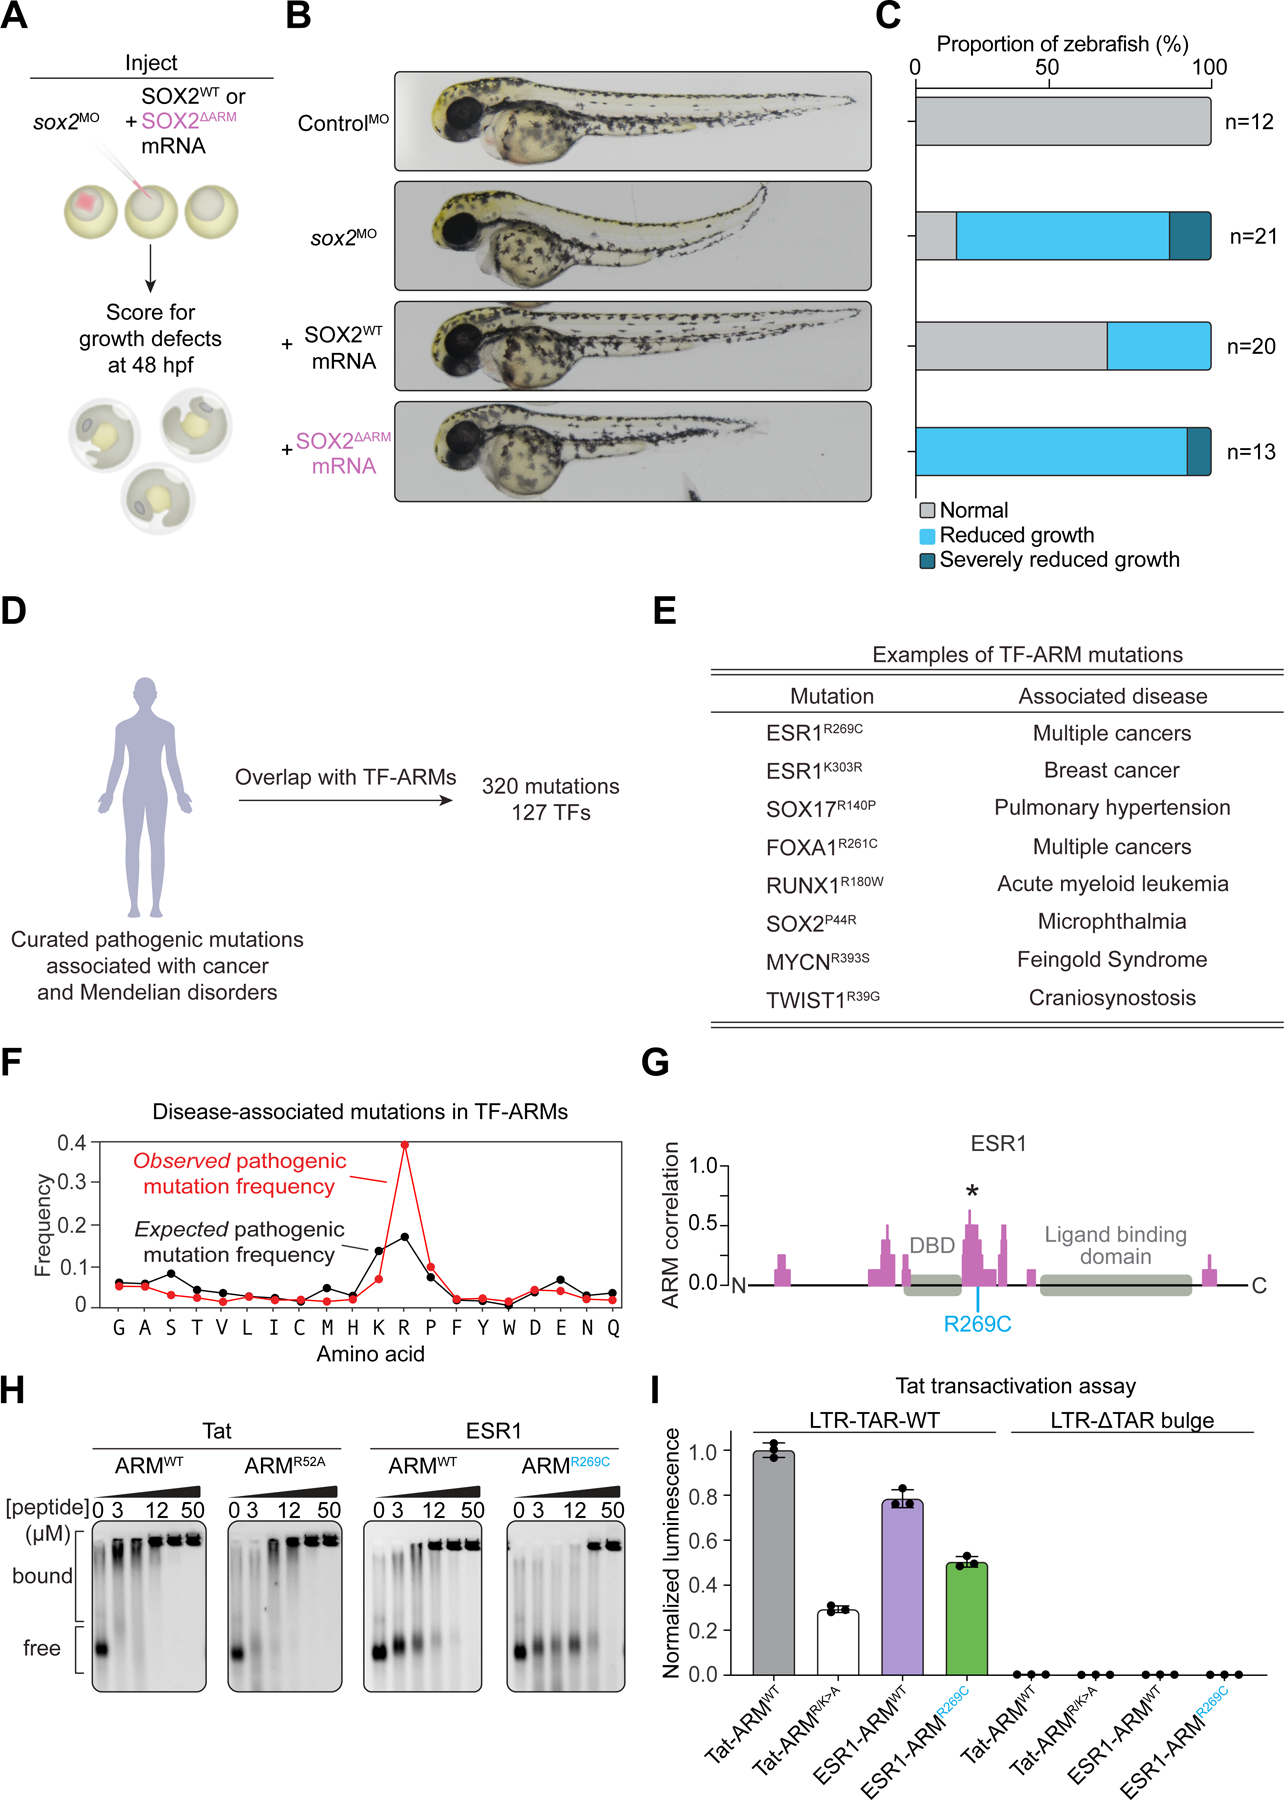
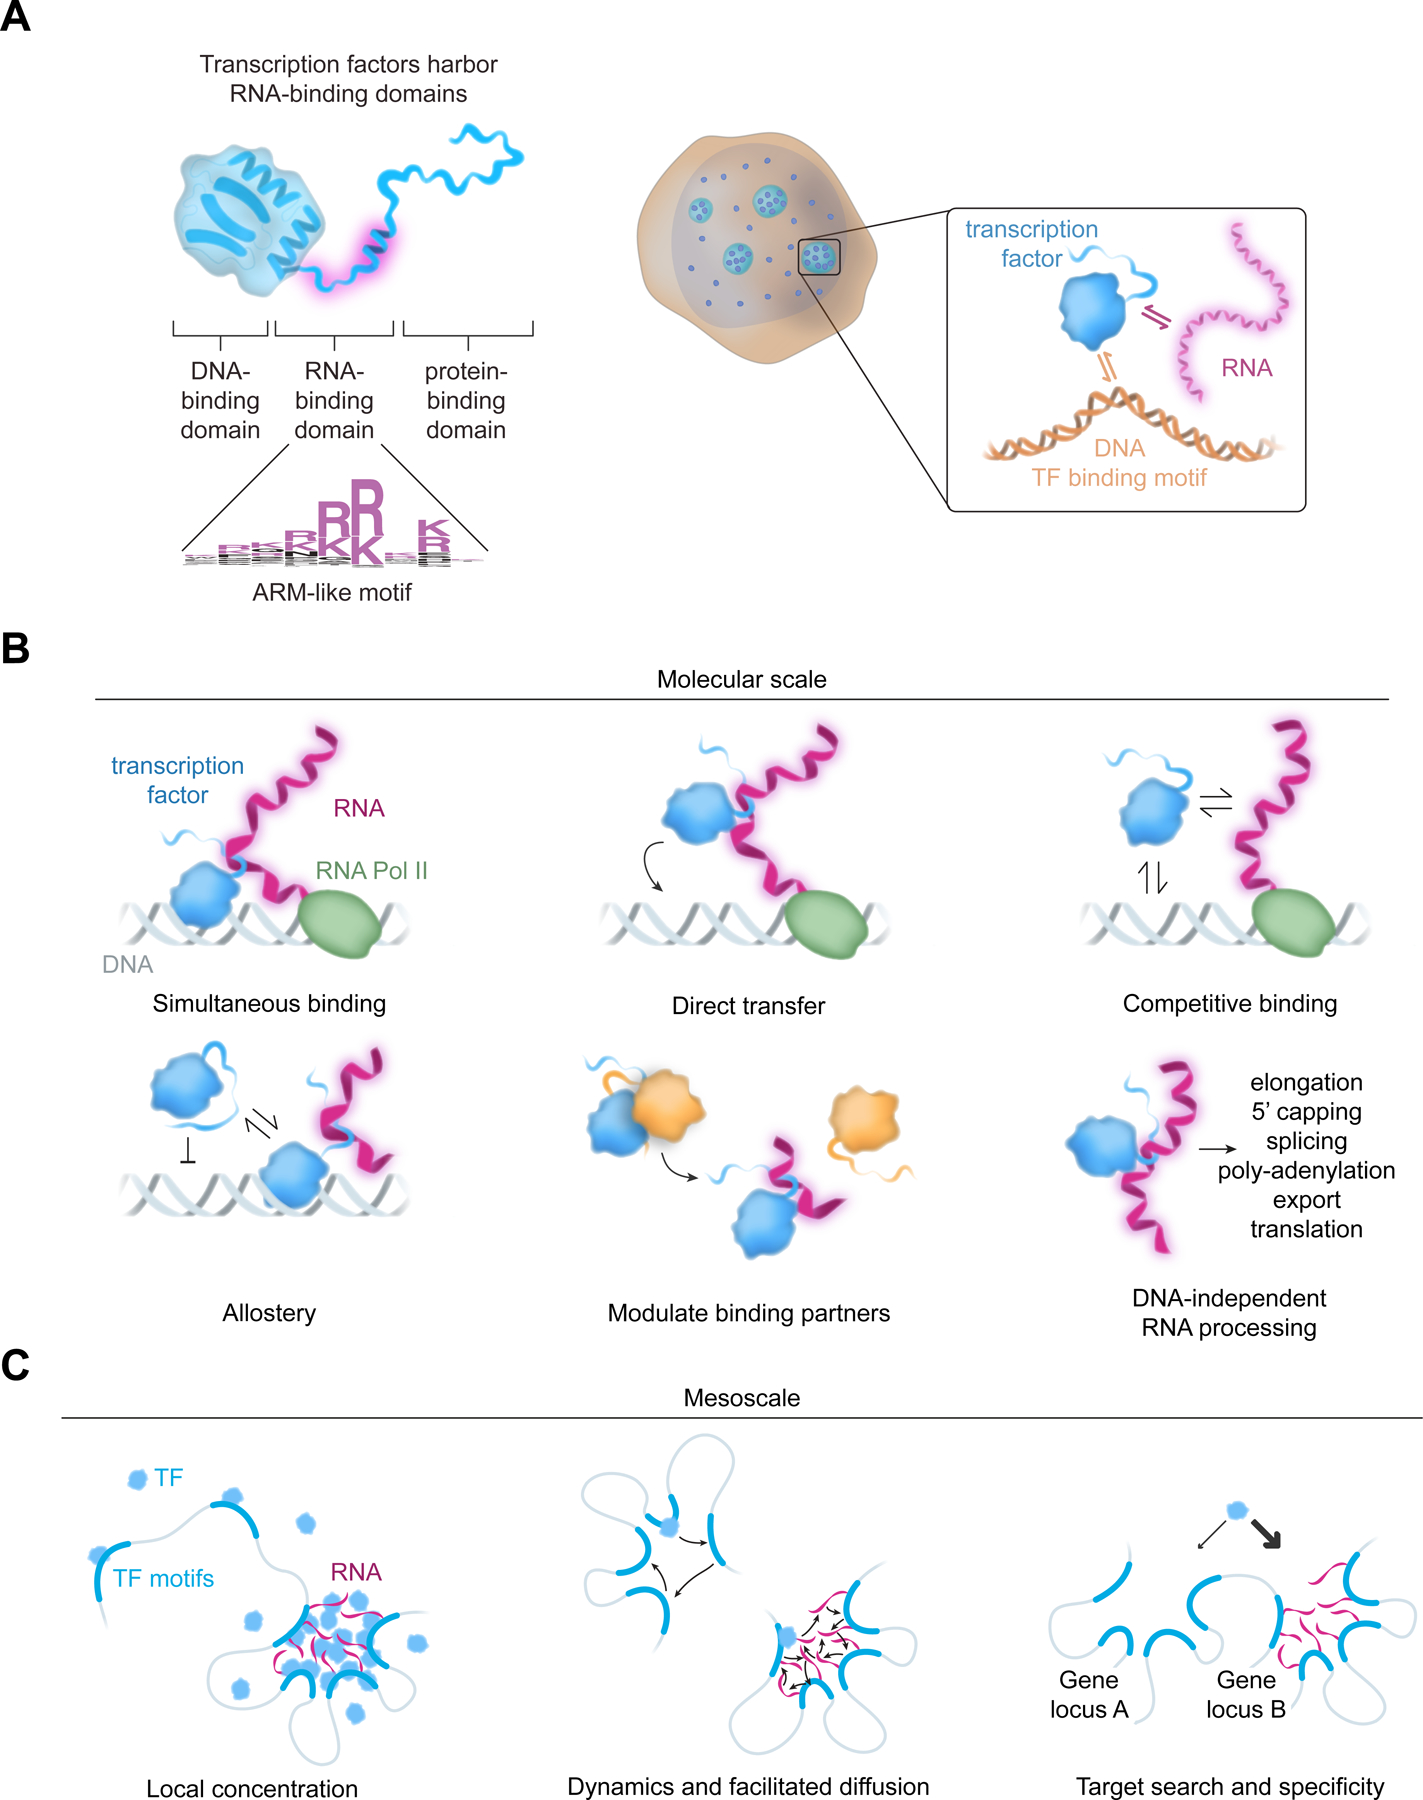
Transcription factors (TFs) orchestrate the gene expression programs that define each cell's identity. The canonical TF accomplishes this with two domains, one that binds specific DNA sequences and the other that binds protein coactivators or corepressors. We find that at least half of TFs also bind RNA, doing so through a previously unrecognized domain with sequence and functional features analogous to the arginine-rich motif of the HIV transcriptional activator Tat. RNA binding contributes to TF function by promoting the dynamic association between DNA, RNA, and TF on chromatin. TF-RNA interactions are a conserved feature important for vertebrate development and disrupted in disease. We propose that the ability to bind DNA, RNA, and protein is a general property of many TFs and is fundamental to their gene regulatory function.

Keywords: RNA; RNA-binding proteins; arginine-rich motif; chromatin; development; gene regulation; single-molecule imaging; transcription factor; zebrafish.


Conflict of interest statement

Declaration of interests R.A.Y. is a founder and shareholder of Syros Pharmaceuticals, Camp4 Therapeutics, Omega Therapeutics, Dewpoint Therapeutics, and Paratus Sciences. R.A.Y. is a member of Molecular Cell’s advisory board. O.O. and J.E.H. are consultants at Camp4 Therapeutics. L.I.Z. is a founder and stockholder of Fate Therapeutics, Camp4 Therapeutics, Amagma Therapeutics, Scholar Rock, and Branch Biosciences. L.I.Z. is a consultant for Celularity and Cellarity. The Whitehead Institute has filed a patent application related to this work.

Figures

Figure 1.
Figure 1.. Transcription factor binding to RNA in cells.
(A) Schematic of DNA-binding and effector domains in transcription factors from different families (PDB accession numbers in Methods). (B) Experimental scheme for RBR-ID in human K562 cells. 4SU-labeled RNAs are crosslinked to proteins with UV light. RNA-binding peptides are identified by comparing the levels of crosslinked and unbound peptides by mass spectrometry. (C) Volcano plot of TF peptides in RBR-ID for human K562 cells with select highlighted TFs (dotted line at p=0.05). Each marker represents the peptide with maximum RBR-ID score for each protein. (D) Volcano plot of all detected peptides in RBR-ID for human K562 cells with select highlighted RBPs (dotted line at p=0.05). Each marker represents the peptide with maximum RBR-ID score for each protein. (E) ChIP-seq and CLIP signal for GATA2 at the HINT1 locus in K562 cells. (F) Meta-gene analysis of input-subtracted CLIP signal centered on GATA2 or RUNX1 ChIP-seq peaks in K562 cells.
Figure 2.
Figure 2.. Transcription factor binding to RNA in vitro.
(A) Experimental scheme for measuring the equilibrium dissociation constant Kd for protein-RNA binding. Cy5-labeled RNA and increasing concentrations of purified proteins are incubated and protein-RNA interactions is measured by fluorescence polarization assay. (B) Fraction bound RNA with increasing protein concentration for established RNA-binding proteins, GFP, and the restriction enzyme BamHI (error bars depict s.d.). (C) Fraction bound RNA with increasing protein concentration for select transcription factors (error bars depict s.d.). A summary of Kd values for established RNA-binding proteins and TFs are indicated.
Figure 3.
Figure 3.. An arginine-rich domain in transcription factors.
(A) Plot depicting the probability of a basic patch as a function of the distance from either DNA-binding domains (magenta) or all other annotated structured domains (black). (B) Sequence logo derived from a position-weight matrix generated from the basic patches of TFs. (C) Cumulative distribution plot of maximum cross-correlation scores between proteins and the Tat ARM (*p < 0.0001, Mann Whitney U test) for the whole proteome excluding TFs (black line) or TFs alone (blue line). (D) Diagram of select TFs and their cross-correlation to the Tat ARM across a sliding window (*maximum scoring ARM-like region). Evolutionary conservation as calculated by ConSurf (Methods) is provided as a heatmap below the protein diagram. (E) Fraction bound RNA with increasing protein concentration for wildtype (WT) or deletion (ΔARM) TFs (KLF4 WT vs ΔARM: p=0.017; SOX2 WT vs ΔARM: p=0.0012; GATA2 WT vs ΔARM: p=0.018). (F) Gel shift assay for 7SK RNA with synthesized peptides encoding wildtype or R/K>A mutations of TF-ARMs. (G) Experimental scheme for Tat transactivation assay. RNA Pol II transcribes the luciferase gene in the presence of Tat protein and bulge-containing TAR RNA. Indicated TF-ARMs are tested for their ability to replace Tat ARM. (H) Bar plots depicting the normalized luminescence values for the Tat transactivation assay with or without the TAR RNA bulge with the indicated TF-ARM replacements. Values are normalized to the control condition (padj<0.0001 for Tat RK>A compared to No Tat, WT Tat, KLF4, SOX2, and all conditions with TAR deletion; padj = 0.0086 for Tat RK>A compared to GATA2, Sidak multiple comparison test).
Figure 4.
Figure 4.. TF-ARMs enhance chromatin occupancy and gene expression
(A) Meta-gene analysis of CUT&Tag for WT or ΔARM HA-tagged KLF4 or SOX2, centered on called WT peaks in mESCs (B) Example tracks of CUT&Tag (spike-in normalized) at specific genomic loci. (C) Diagram of KLF4 and its cross-correlation to the Tat ARM (magenta), predicted disorder (black line), DNA-binding domain (grey boxes) and predicted disordered domain (cyan). (D) Side and top views of the crystal structure of KLF4 with DNA (PDB: 6VTX) or AlphaFold predicted structure (ID: O43474) (E) Experimental scheme for TF gene activation assays. KLF4 ZFs are replaced either by GAL4 or TetR DBD. The effect of KLF4-ARM mutation or replacement of KLF4-ARM with Tat-ARM on gene activation is tested by UAS or TetO containing reporter system. (F) Normalized luminescence of gene activation assays, normalized to the “No TF” condition (error bars depict s.d., GAL4: p<0.0001 for all pairwise comparisons except WT vs. Tat-ARM, p=0.3363; TetR: NoTF vs. WT, p<0.0001, NoTF vs. R/K>A, p=0.5668, NoTF vs. Tat-ARM, p=0.0002, WT vs. R/K>A, p=0.0003, WT vs. Tat-ARM, p=0.7126, Tat-ARM vs. R/K>A, p=0.0008, one-way ANOVA)
Figure 5.
Figure 5.. A role for TF RNA-binding regions in TF nuclear dynamics.
(A) Cartoon depicting a 3-state model of TF diffusion. (B) Example of single nuclei single-molecule tracking traces for KLF4-WT and KLF4-ARM deletion. The traces are separated by their associated diffusion coefficient (Dimm: <0.04 μm2s™1; Dsub: 0.04–0.2 μm2s™1; Dfree: >0.2 μm2s™1). For each nucleus, 500 randomly sampled traces are shown. (C) Dot plot depicting the fraction of traces in the immobile, subdiffusive, or freely diffusing states. Each marker represents an independent imaging field (comparing WT and ARM-deletion, p<0.0001 for KLF4free, SOX2free, CTCFfree, GATA2free, RUNX1free, KLF4sub, GATA2sub, RUNX1sub, KLF4imm, SOX2imm, RUNX1imm ; p=0.0094 for SOX2sub; p=0.0101 for CTCFsub, p=0.0034 for CTCFimm, p=0.38 for GATA2imm, two-tailed Student’s t-test; error bars depict 95% C.I.).
Figure 6.
Figure 6.. TF-ARMs are important for normal development and disrupted in disease.
(A) Experimental scheme for injection of zebrafish embryos with morpholinos and rescue by co-injection with the indicated mRNAs (hpf = hours post-fertilization). (B) Representative images of injected zebrafish embryos at 48 hpf. (C) Scoring of zebrafish anterior-posterior axis growth. (D) The landscape of mutations in TF-ARMs associated with human disease (E) Examples of disease-associated mutations in TF-ARMs. (F) Line plot of the observed frequency (red) or expected frequency (black) of mutations for amino acids in TF-ARMs (p = 2.7 x 10™74 for enrichment of mutations in arginine, one-side binomial test with Benjamini-Hochberg correction). (G) Representation of the ESR1 protein and its correlation to the Tat ARM (*Maximum scoring ARM-like region). The selected mutation is provided in blue. (H) Gel shift assay with 7SK RNA and synthesized peptides for Tat-ARM-WT, Tat-ARM-R52A, ESR1-ARM-WT, and ESR1-ARM-R269C. (I) Tat transactivation reporter assay with wildtype or mutant versions of Tat and ESR1 ARMs and a version of the reporter without the Tat-binding TAR bulge. Values are normalized to the Tat-ARM-WT condition.
Figure 7.
Figure 7.. Transcription factors harbor functional RNA-binding domains.
(A) A model depiction of a previously unrecognized RNA-binding domain in a large fraction of transcription factors and its role in TF function. (B) Various ways by which RNA interactions could impact TF function at the molecular scale (C) Various ways by which RNA interactions could impact TF function at the mesoscale

Comment in

References

    1. Lambert SA, Jolma A, Campitelli LF, Das PK, Yin Y, Albu M, Chen X, Taipale J, Hughes TR, and Weirauch MT (2018). The Human Transcription Factors. Cell 172, 650–665. 10.1016/j.cell.2018.01.029. - DOI - PubMed
    1. Vaquerizas JM, Kummerfeld SK, Teichmann SA, and Luscombe NM (2009). A census of human transcription factors: function, expression and evolution. Nat. Rev. Genet 10, 252–263. 10.1038/nrg2538. - DOI - PubMed
    1. Cramer P (2019). Organization and regulation of gene transcription. Nature 573, 45–54. 10.1038/s41586-019-1517-4. - DOI - PubMed
    1. Lee TI, and Young RA (2013). Transcriptional regulation and its misregulation in disease. Cell 152, 1237–1251. 10.1016/j.cell.2013.02.014. - DOI - PMC - PubMed
    1. Stadhouders R, Filion GJ, and Graf T (2019). Transcription factors and 3D genome conformation in cell-fate decisions. Nature 569, 345–354. 10.1038/s41586-019-1182-7. - DOI - PubMed

Publication types